| Param | Original file | Final file |
|---|---|---|
| Filename | modeM0/AS1A07_097T01_9000003692_25231cztM0_level2.evt | modeM0/AS1A07_097T01_9000003692_25231cztM0_level2_quad_clean.evt |
| Size (bytes) | 547,053,120 | 76,930,560 |
| Size | 521.7 MB | 73.4 MB |
| Events in quadrant A | 3,456,312 | 480,761 |
| Events in quadrant B | 3,721,946 | 484,231 |
| Events in quadrant C | 3,650,940 | 463,168 |
| Events in quadrant D | 5,305,933 | 456,109 |
| Mode M0 | |||
|---|---|---|---|
| Quadrant | BADHDUFLAG | Total packets | Discarded packets |
| A | 0 | 14158 | 0 |
| B | 0 | 14993 | 0 |
| C | 0 | 14784 | 0 |
| D | 0 | 20255 | 0 |
| Mode M9 | |||
|---|---|---|---|
| Quadrant | BADHDUFLAG | Total packets | Discarded packets |
| A | 0 | 14 | 0 |
| B | 0 | 15 | 0 |
| C | 0 | 15 | 0 |
| D | 0 | 15 | 0 |
| Quadrant | Total seconds | Saturated seconds | Saturation percentage |
|---|---|---|---|
| A | 6385 | 129 | 2.020360% |
| B | 6385 | 184 | 2.881754% |
| C | 6385 | 166 | 2.599843% |
| D | 6385 | 335 | 5.246672% |
Noise dominated data is calculated using 1-second bins in cleaned event files. If a bin has >2000 counts, and if more than 50% of those come from <1% of pixels, then it is considered to be noise-dominated and hence unusable.
| Quadrant | # 1 sec bins | Bins with >0 counts | Bins with >2000 counts | High rate bins dominated by noise | Noise dominated (total time) | Noise dominated (detector-on time) | Marked lightcurve |
|---|---|---|---|---|---|---|---|
| A | 7555 | 6386 | 0 | 0 | 0.00% | 0.00% | 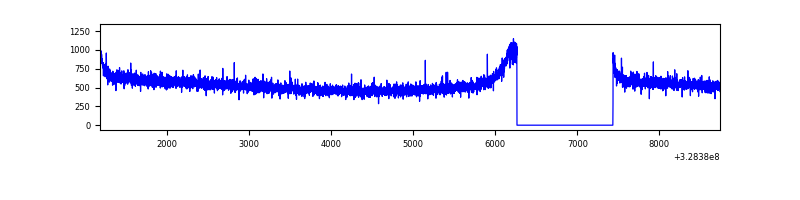 |
| B | 7555 | 6386 | 19 | 19 | 0.25% | 0.30% | 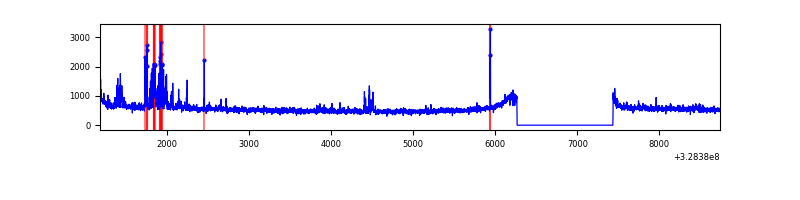 |
| C | 7555 | 6386 | 6 | 6 | 0.08% | 0.09% | 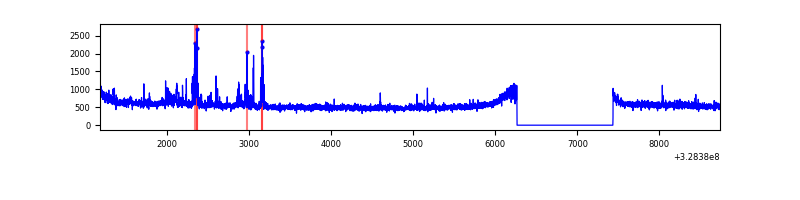 |
| D | 7555 | 6386 | 163 | 163 | 2.16% | 2.55% | 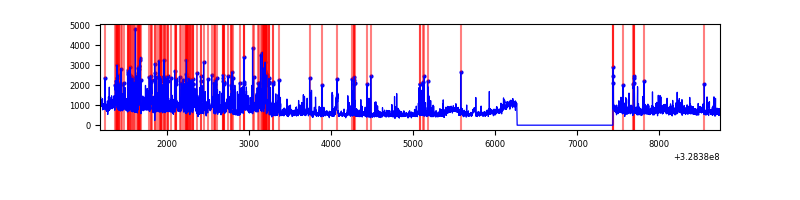 |
Top three noisy pixels from each quadrant. If the there are fewer than three noisy pixels in the level2.evt file, extra rows are filled as -1
| Pixel properties | Quadrant properties | ||||||
|---|---|---|---|---|---|---|---|
| Quadrant | DetID | PixID | Counts | Sigma | Mean | Median | Sigma |
| A | 13 | 254 | 10267 | 52.55 | 895 | 877 | 178.7 |
| A | 3 | 137 | 7745 | 38.44 | 895 | 877 | 178.7 |
| A | 0 | 226 | 7656 | 37.94 | 895 | 877 | 178.7 |
| B | 0 | 189 | 187888 | 1116.91 | 883 | 864 | 167.4 |
| B | 0 | 190 | 36353 | 211.94 | 883 | 864 | 167.4 |
| B | 12 | 111 | 19664 | 112.27 | 883 | 864 | 167.4 |
| C | 2 | 16 | 169342 | 844.94 | 856 | 865 | 199.4 |
| C | 14 | 238 | 138099 | 688.25 | 856 | 865 | 199.4 |
| C | 13 | 61 | 5894 | 25.22 | 856 | 865 | 199.4 |
| D | 1 | 52 | 1292259 | 6249.17 | 865 | 844 | 206.7 |
| D | 8 | 195 | 270364 | 1304.21 | 865 | 844 | 206.7 |
| D | 12 | 235 | 174889 | 842.21 | 865 | 844 | 206.7 |
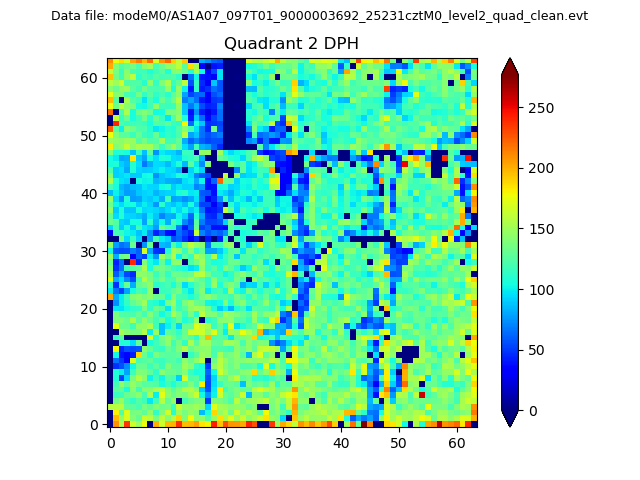
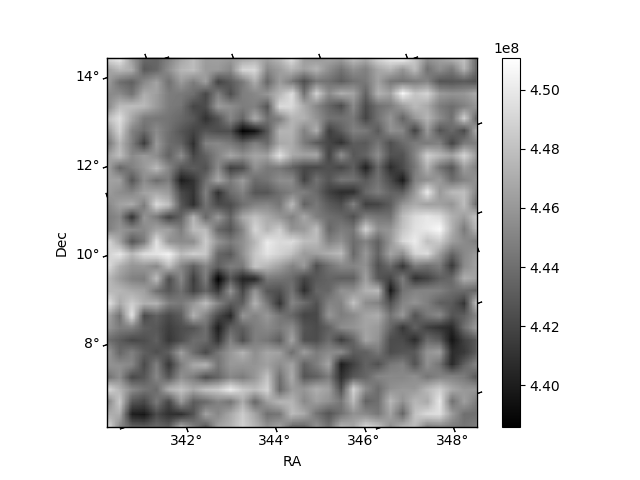
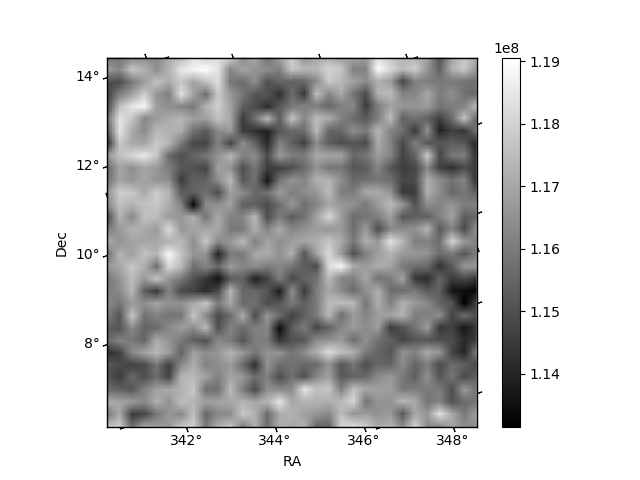
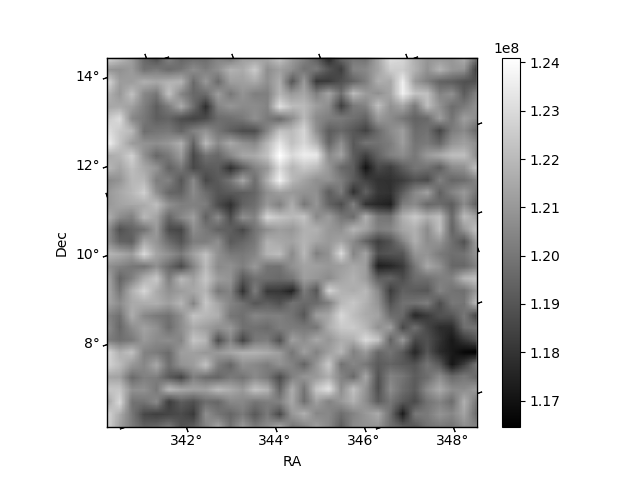
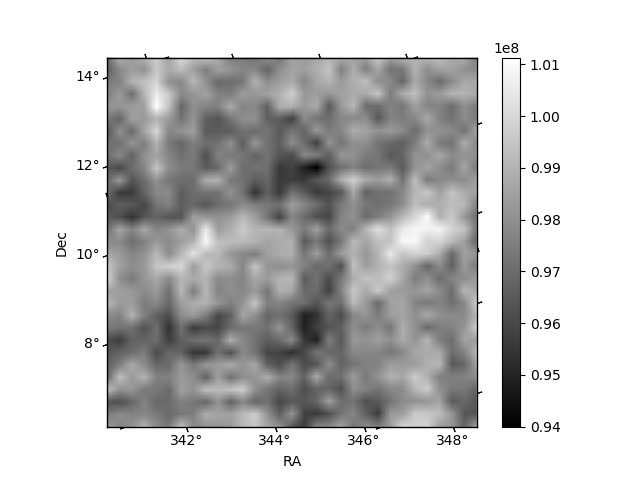
Histogram calculated using DETX and DETY for each event in the final _common_clean file
| Quadrant A | 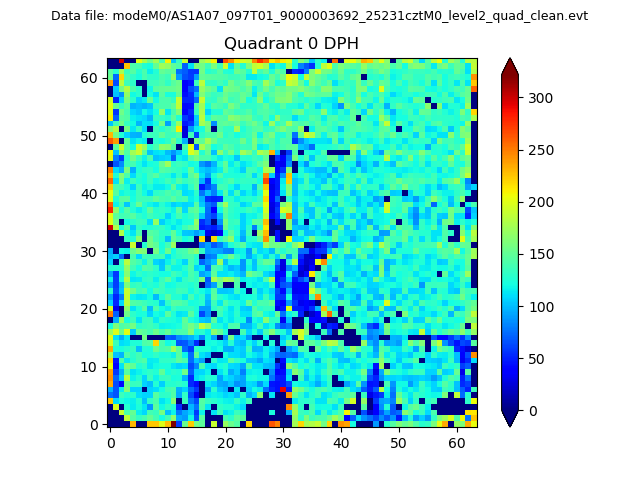 |
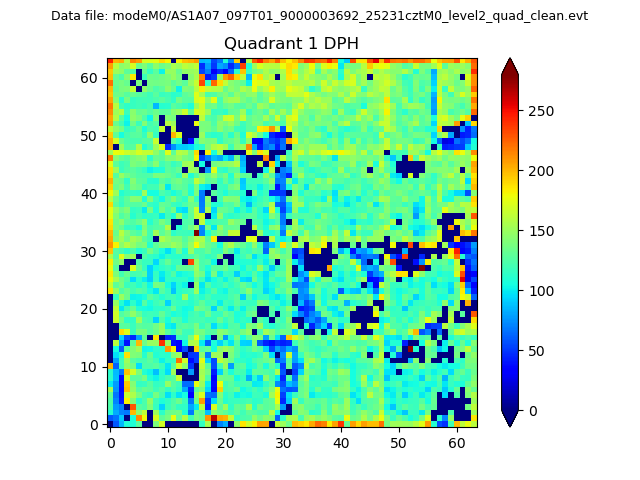 |
Quadrant B |
|---|---|---|---|
| Quadrant D | 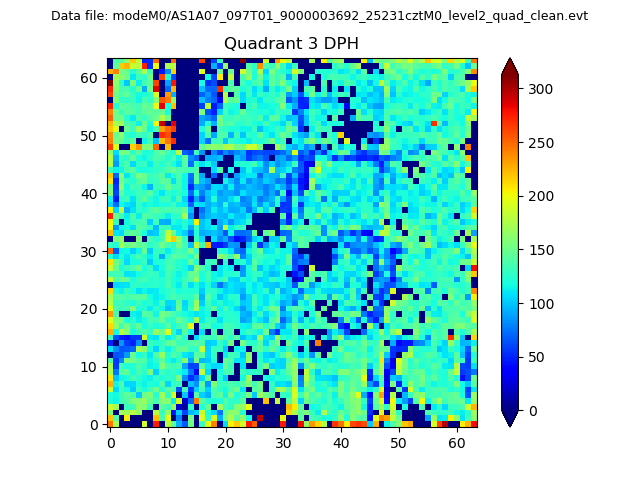 |
 |
Quadrant C |
| Plot type | Count rate plots | Images |
|---|---|---|
| Comparison with Poisson distribution Blue bars denote a histogram of data divided into 1 sec bins. Red curve is a Poisson curve with rate = median count rate of data. |
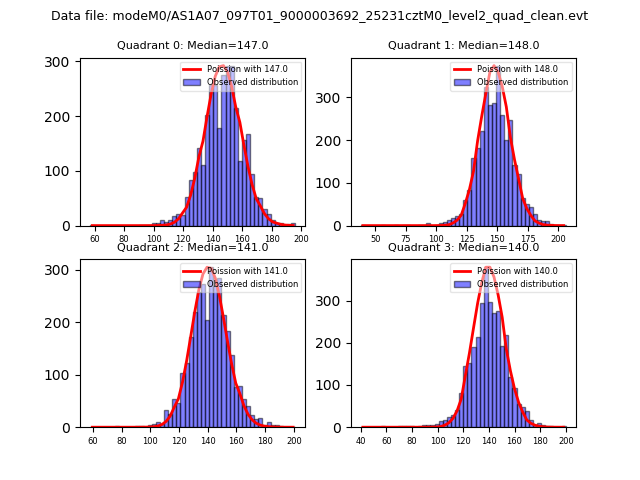 |
 |
| Quadrant-wise count rates Data is divided into 100 sec bins |
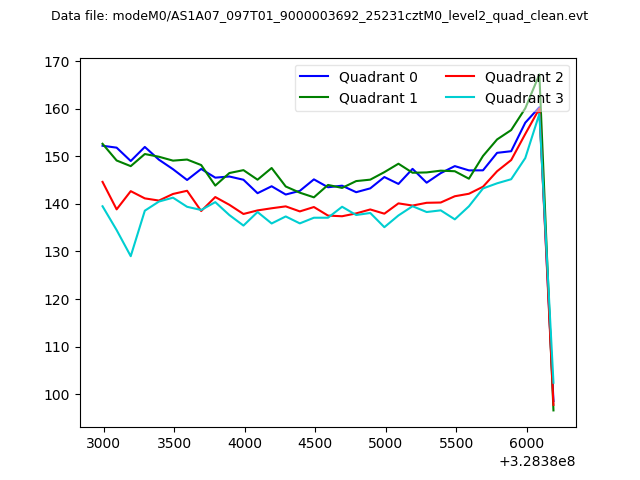 |
|
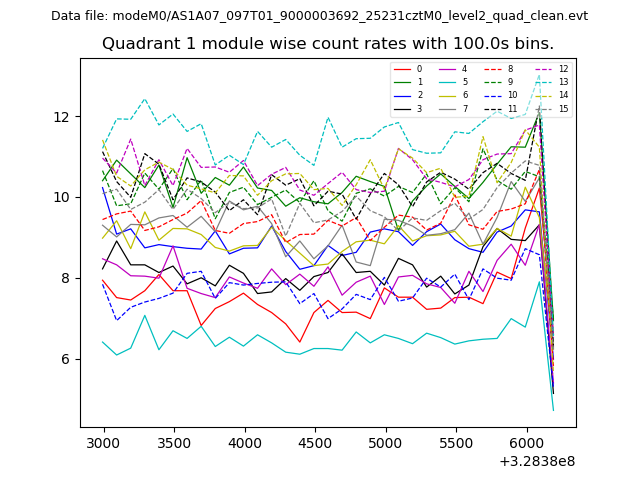
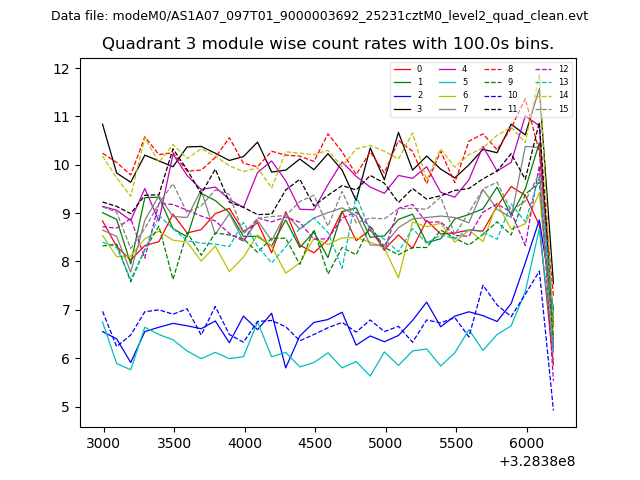
| Module-wise count rates for Quadrant A Data is divided into 100 sec bins |
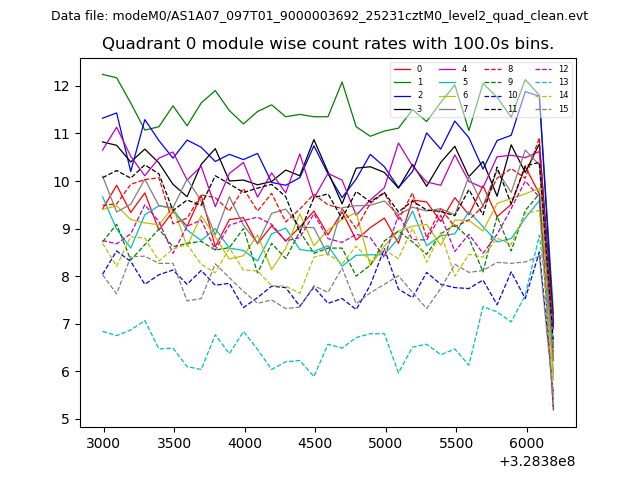 |
 |
| Module-wise count rates for Quadrant B Data is divided into 100 sec bins |
 |
 |
| Module-wise count rates for Quadrant C Data is divided into 100 sec bins |
 |
 |
| Module-wise count rates for Quadrant D Data is divided into 100 sec bins |
 |
 |
| Parameter | Plot |
|---|---|
| CZT HV Monitor | 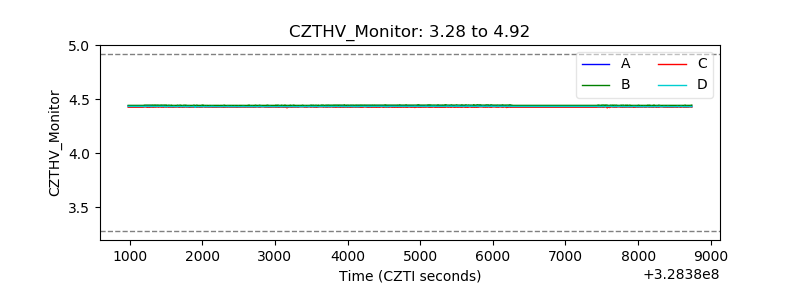 |
| D_VDD | 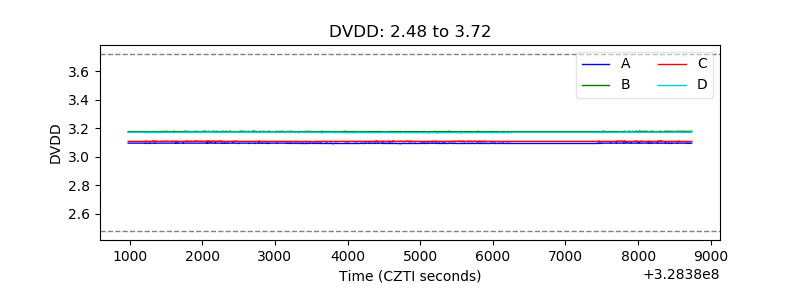 |
| Temperature 1 | 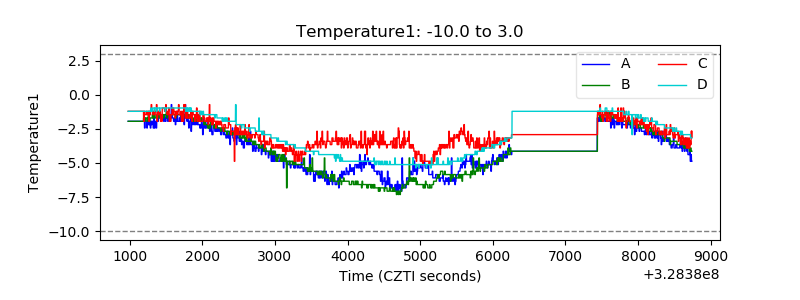 |
| Veto HV Monitor | 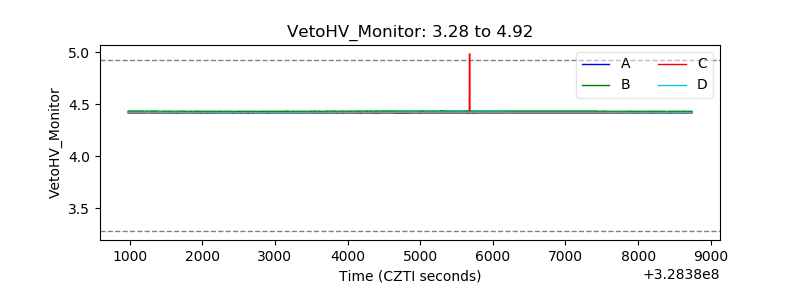 |
| Veto LLD | 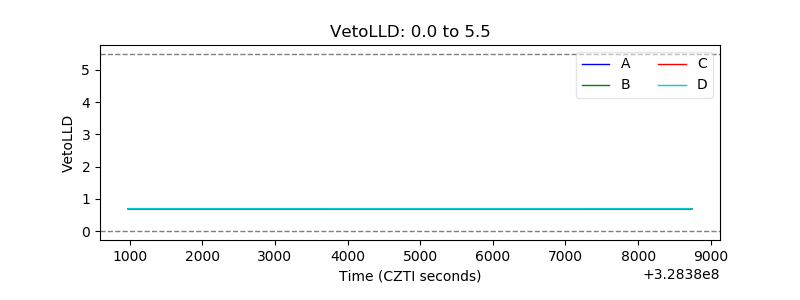 |
| Alpha Counter | 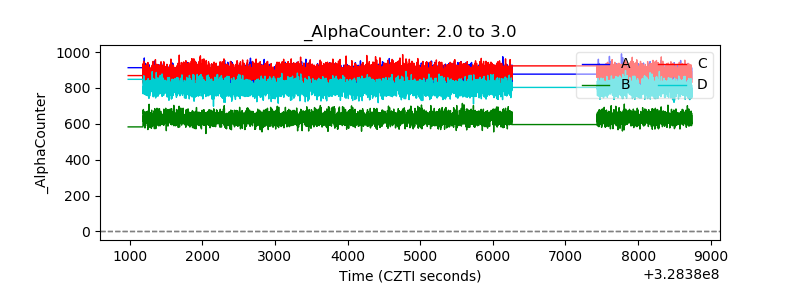 |
| _CPM_Rate | 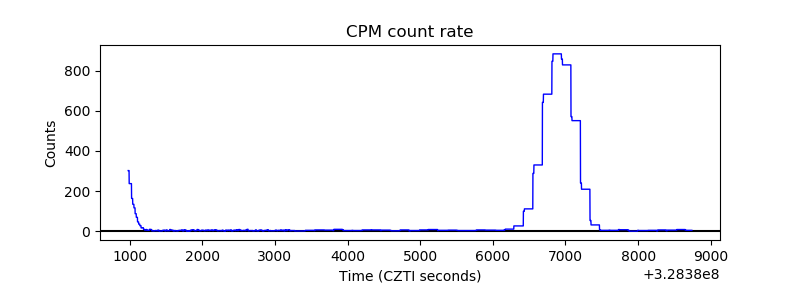 |
| CZT Counter | 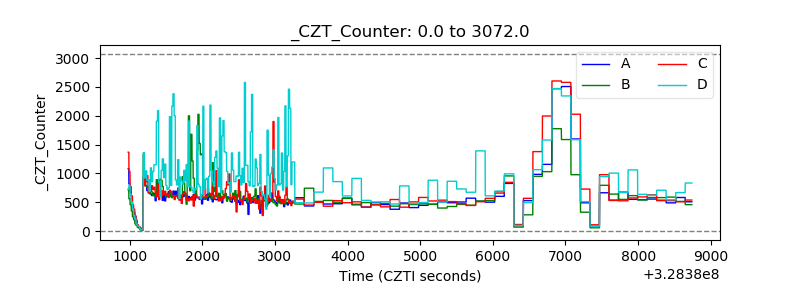 |
| +2.5 Volts monitor |  |
| +5 Volts monitor |  |
| _ROLL_ROT | 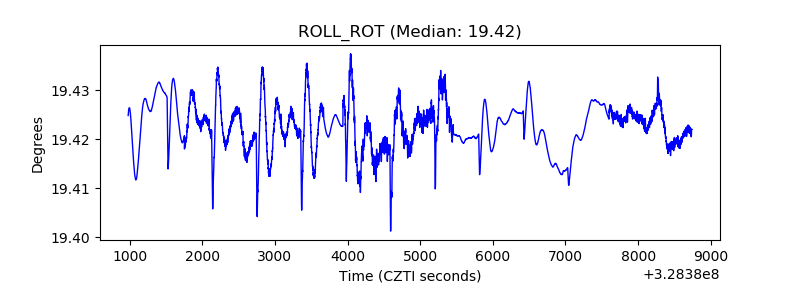 |
| _Roll_DEC | 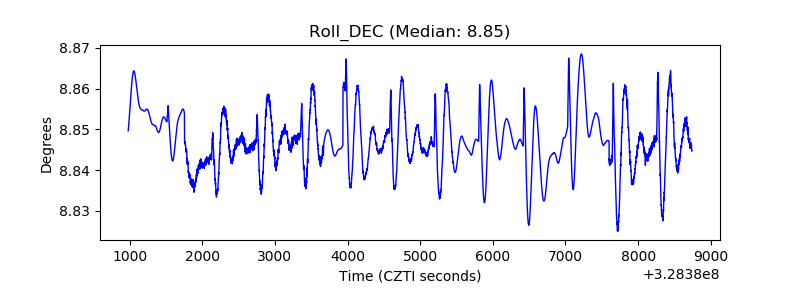 |
| _Roll_RA | 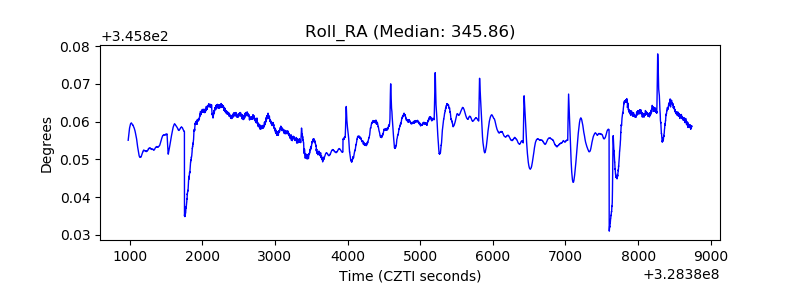 |
| Veto Counter | 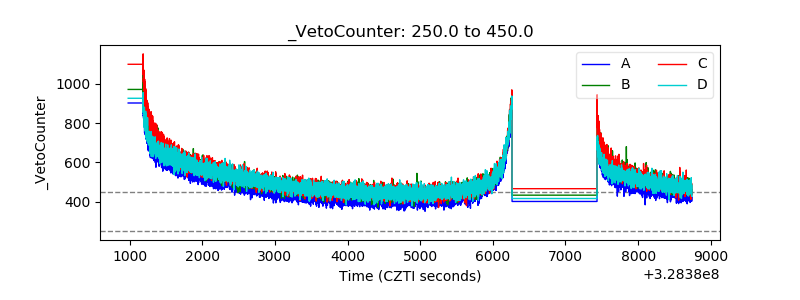 |