| Param | Original file | Final file |
|---|---|---|
| Filename | modeM0/AS1A07_097T01_9000003692_25232cztM0_level2.evt | modeM0/AS1A07_097T01_9000003692_25232cztM0_level2_quad_clean.evt |
| Size (bytes) | 496,391,040 | 83,833,920 |
| Size | 473.4 MB | 80.0 MB |
| Events in quadrant A | 3,322,065 | 528,414 |
| Events in quadrant B | 3,389,136 | 534,870 |
| Events in quadrant C | 3,413,209 | 511,580 |
| Events in quadrant D | 4,462,488 | 505,191 |
| Mode M0 | |||
|---|---|---|---|
| Quadrant | BADHDUFLAG | Total packets | Discarded packets |
| A | 0 | 13825 | 0 |
| B | 0 | 13999 | 0 |
| C | 0 | 13971 | 0 |
| D | 0 | 17777 | 0 |
| Mode M9 | |||
|---|---|---|---|
| Quadrant | BADHDUFLAG | Total packets | Discarded packets |
| A | 0 | 17 | 0 |
| B | 0 | 18 | 0 |
| C | 0 | 18 | 0 |
| D | 0 | 18 | 0 |
| Quadrant | Total seconds | Saturated seconds | Saturation percentage |
|---|---|---|---|
| A | 6576 | 27 | 0.410584% |
| B | 6576 | 48 | 0.729927% |
| C | 6576 | 89 | 1.353406% |
| D | 6576 | 242 | 3.680049% |
Noise dominated data is calculated using 1-second bins in cleaned event files. If a bin has >2000 counts, and if more than 50% of those come from <1% of pixels, then it is considered to be noise-dominated and hence unusable.
| Quadrant | # 1 sec bins | Bins with >0 counts | Bins with >2000 counts | High rate bins dominated by noise | Noise dominated (total time) | Noise dominated (detector-on time) | Marked lightcurve |
|---|---|---|---|---|---|---|---|
| A | 7501 | 6577 | 0 | 0 | 0.00% | 0.00% | 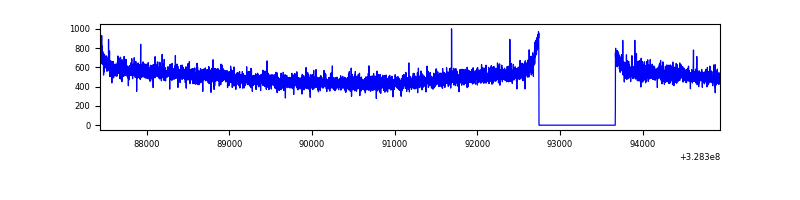 |
| B | 7501 | 6577 | 1 | 1 | 0.01% | 0.02% | 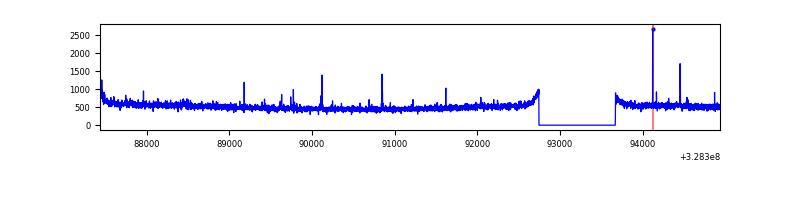 |
| C | 7501 | 6577 | 0 | 0 | 0.00% | 0.00% | 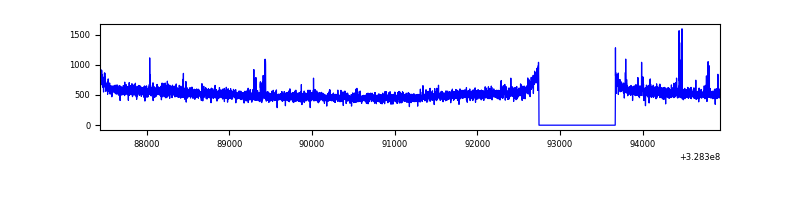 |
| D | 7501 | 6577 | 140 | 140 | 1.87% | 2.13% | 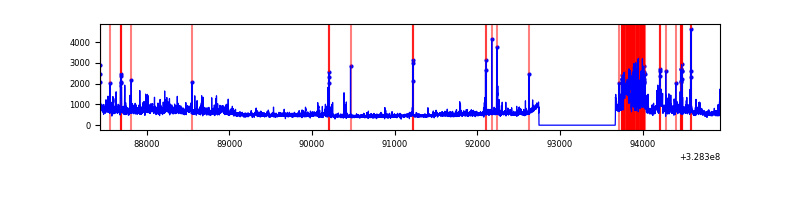 |
Top three noisy pixels from each quadrant. If the there are fewer than three noisy pixels in the level2.evt file, extra rows are filled as -1
| Pixel properties | Quadrant properties | ||||||
|---|---|---|---|---|---|---|---|
| Quadrant | DetID | PixID | Counts | Sigma | Mean | Median | Sigma |
| A | 13 | 254 | 10965 | 58.58 | 859 | 844 | 172.8 |
| A | 3 | 137 | 7719 | 39.79 | 859 | 844 | 172.8 |
| A | 0 | 226 | 7186 | 36.71 | 859 | 844 | 172.8 |
| B | 12 | 111 | 19300 | 113.33 | 853 | 832 | 163.0 |
| B | 11 | 111 | 17456 | 102.01 | 853 | 832 | 163.0 |
| B | 14 | 111 | 14879 | 86.2 | 853 | 832 | 163.0 |
| C | 14 | 238 | 132269 | 678.63 | 824 | 831 | 193.7 |
| C | 2 | 16 | 34324 | 172.93 | 824 | 831 | 193.7 |
| C | 3 | 233 | 24121 | 120.25 | 824 | 831 | 193.7 |
| D | 8 | 195 | 399945 | 1985.09 | 828 | 805 | 201.1 |
| D | 12 | 235 | 388129 | 1926.32 | 828 | 805 | 201.1 |
| D | 10 | 70 | 270188 | 1339.75 | 828 | 805 | 201.1 |
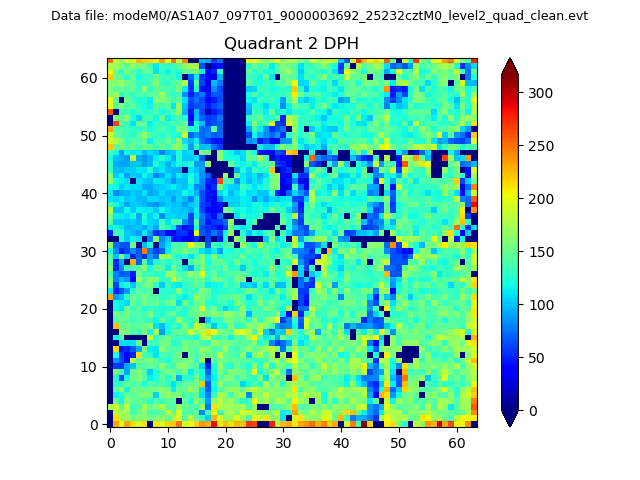
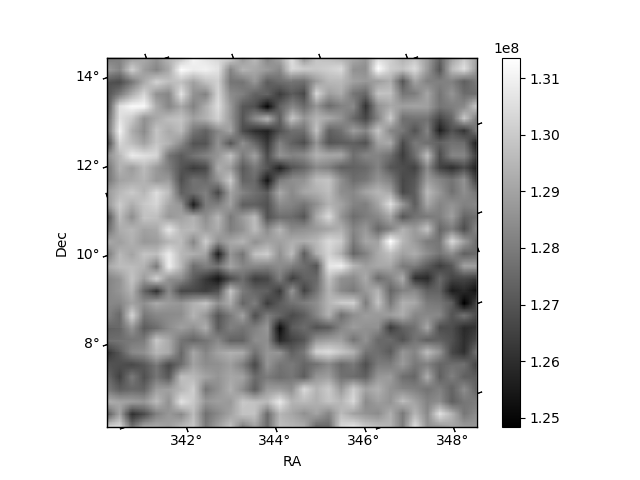
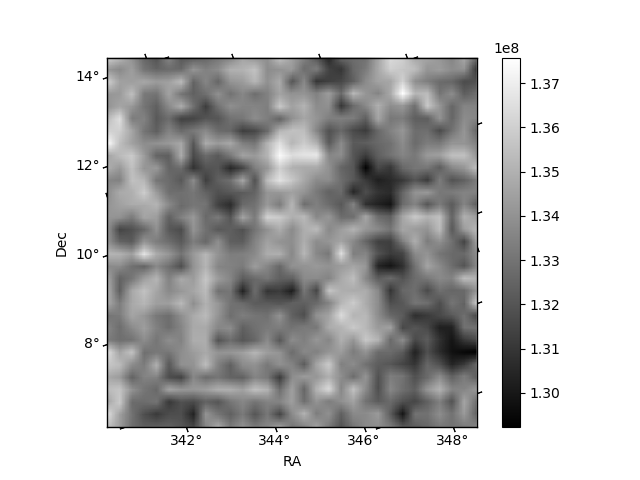
Histogram calculated using DETX and DETY for each event in the final _common_clean file
| Quadrant A | 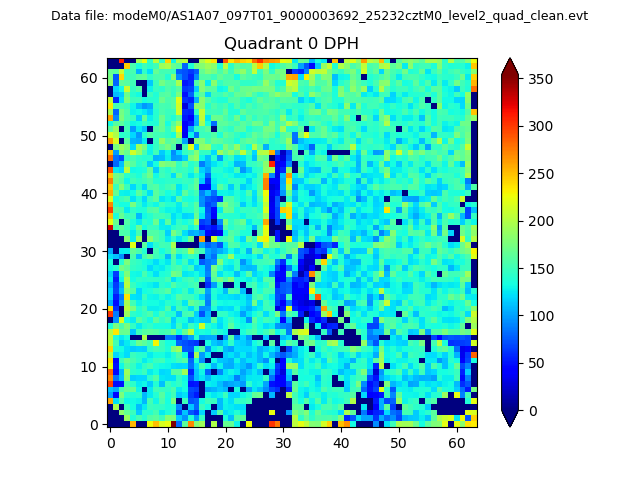 |
 |
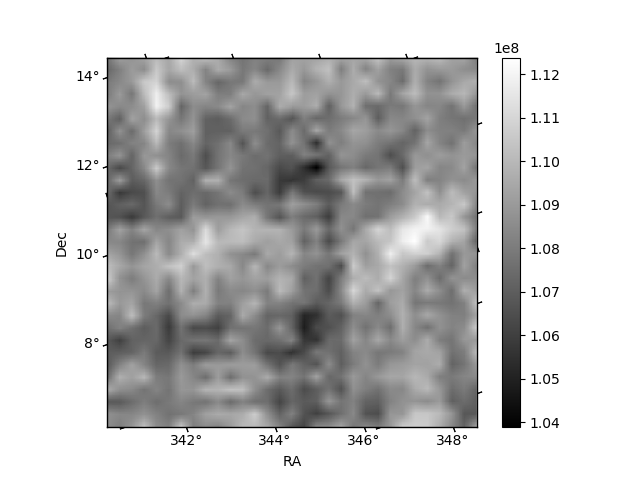
Quadrant B |
|---|---|---|---|
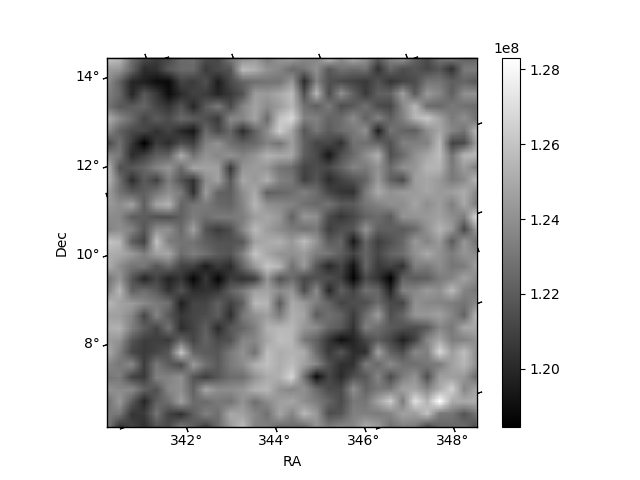
| Quadrant D |  |
 |
Quadrant C |
| Plot type | Count rate plots | Images |
|---|---|---|
| Comparison with Poisson distribution Blue bars denote a histogram of data divided into 1 sec bins. Red curve is a Poisson curve with rate = median count rate of data. |
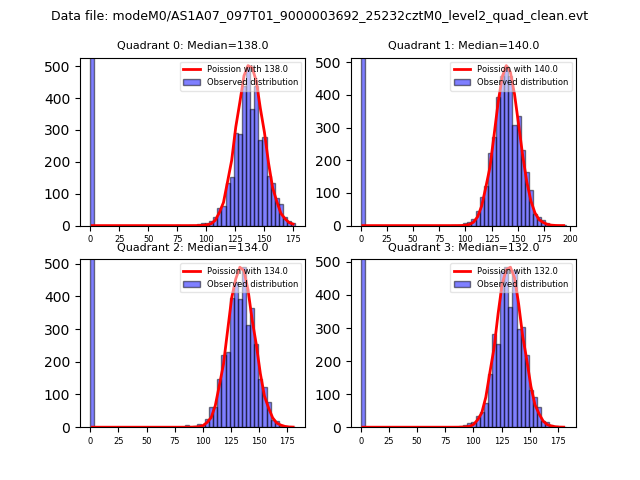 |
 |
| Quadrant-wise count rates Data is divided into 100 sec bins |
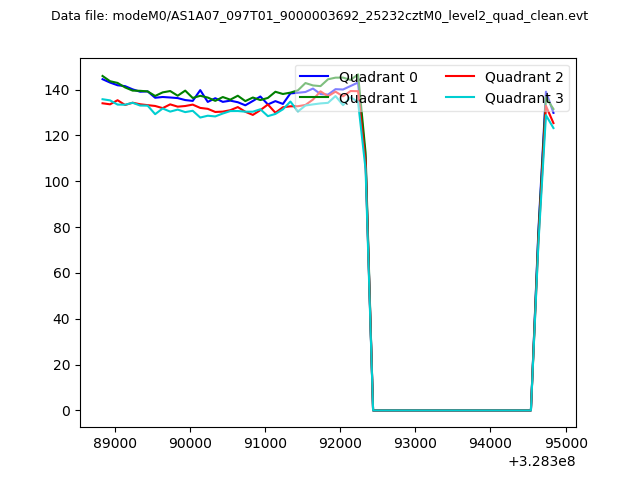 |
|
| Module-wise count rates for Quadrant A Data is divided into 100 sec bins |
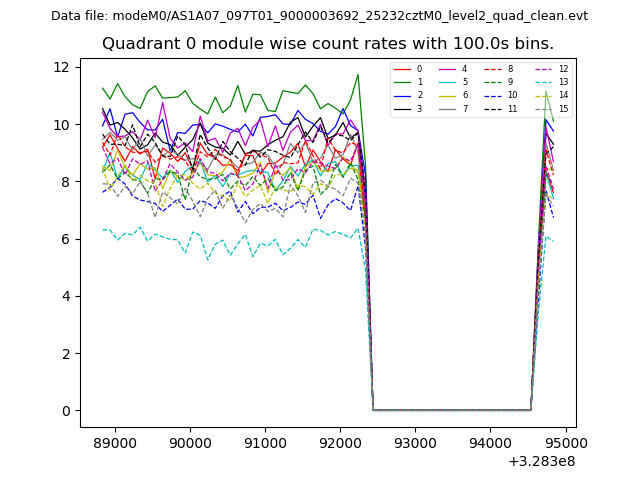 |
 |
| Module-wise count rates for Quadrant B Data is divided into 100 sec bins |
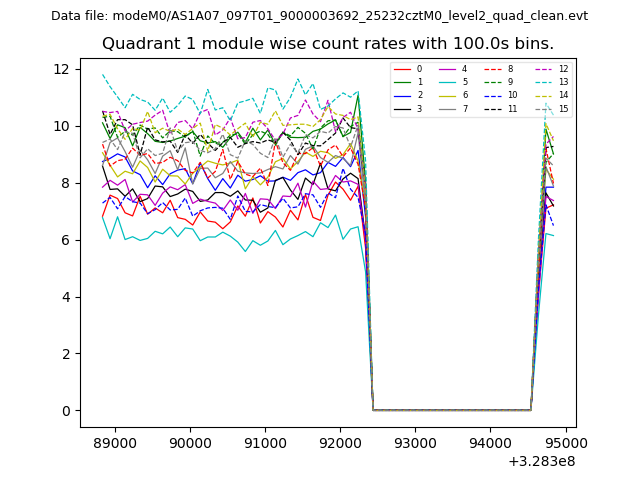 |
 |
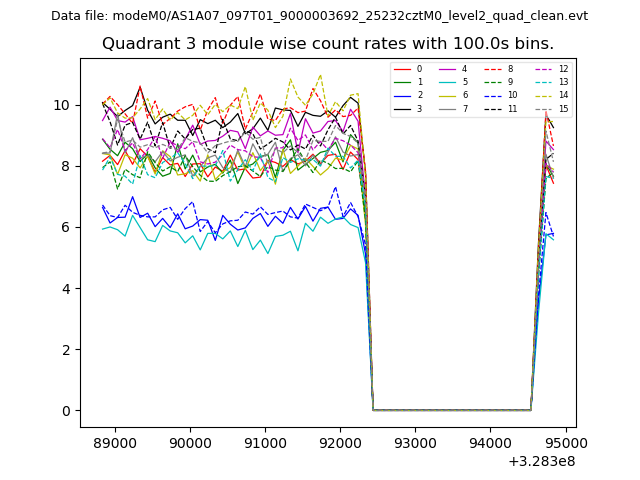
| Module-wise count rates for Quadrant C Data is divided into 100 sec bins |
 |
 |
| Module-wise count rates for Quadrant D Data is divided into 100 sec bins |
 |
 |
| Parameter | Plot |
|---|---|
| CZT HV Monitor | 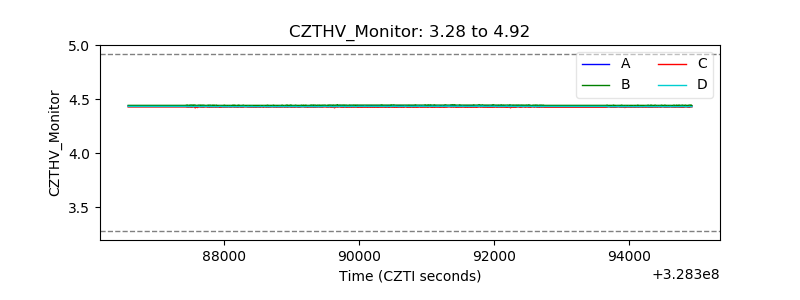 |
| D_VDD | 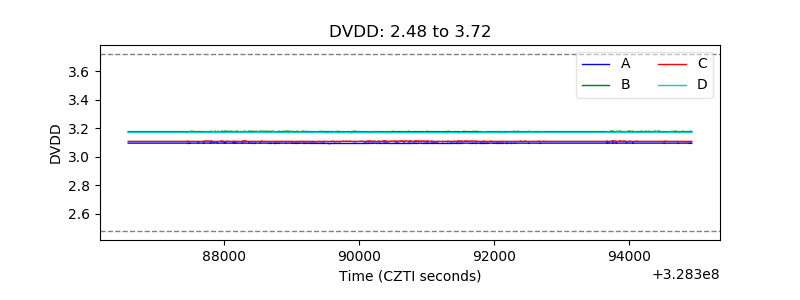 |
| Temperature 1 | 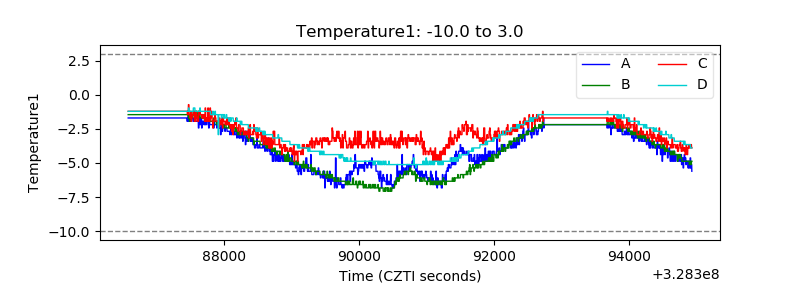 |
| Veto HV Monitor | 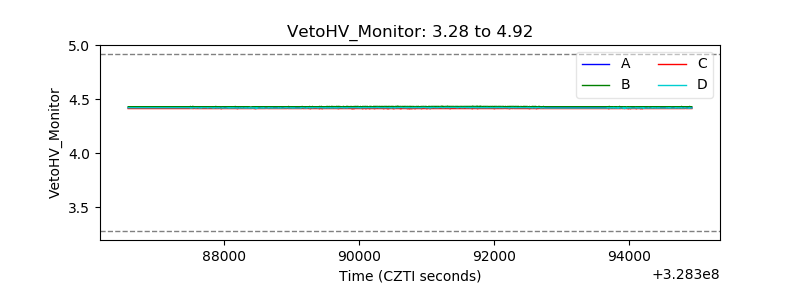 |
| Veto LLD | 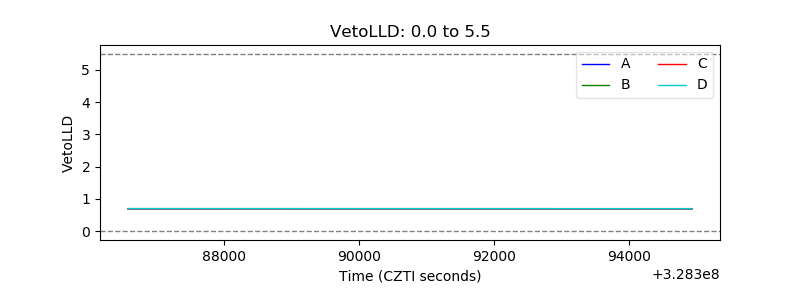 |
| Alpha Counter | 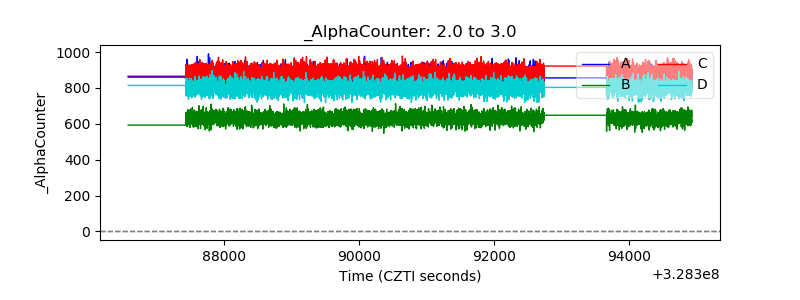 |
| _CPM_Rate | 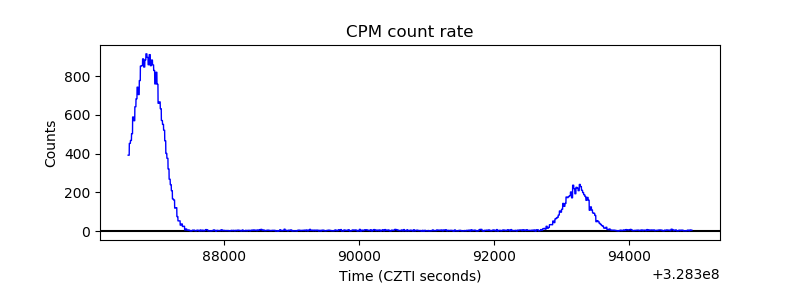 |
| CZT Counter | 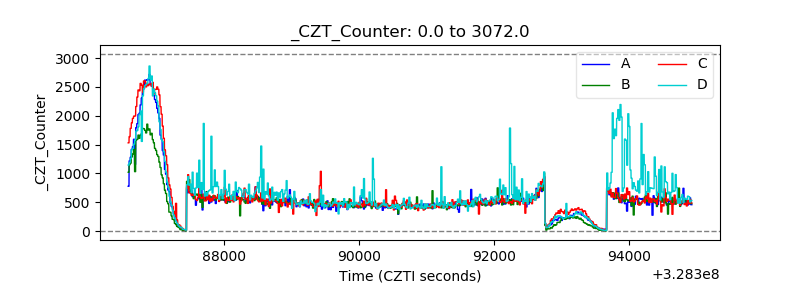 |
| +2.5 Volts monitor |  |
| +5 Volts monitor |  |
| _ROLL_ROT | 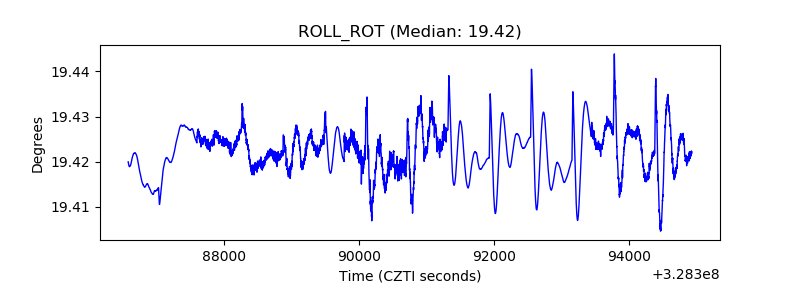 |
| _Roll_DEC | 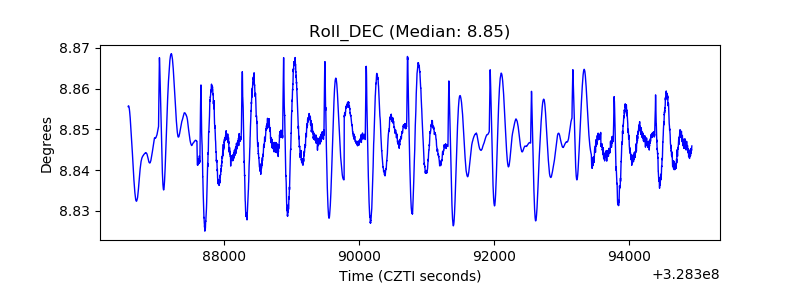 |
| _Roll_RA | 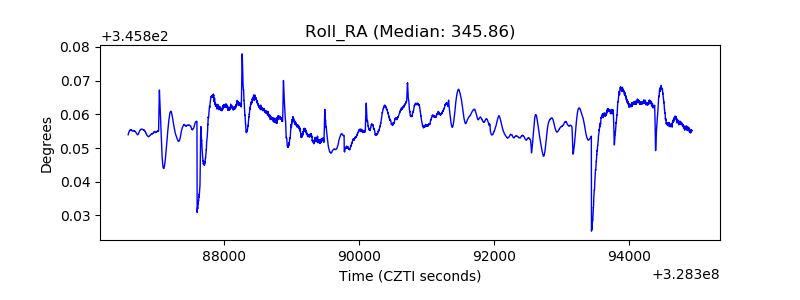 |
| Veto Counter |  |