| Param | Original file | Final file |
|---|---|---|
| Filename | modeM0/AS1A07_097T01_9000003692_25234cztM0_level2.evt | modeM0/AS1A07_097T01_9000003692_25234cztM0_level2_quad_clean.evt |
| Size (bytes) | 600,552,000 | 97,528,320 |
| Size | 572.7 MB | 93.0 MB |
| Events in quadrant A | 3,811,145 | 622,141 |
| Events in quadrant B | 3,803,881 | 627,814 |
| Events in quadrant C | 3,805,184 | 600,818 |
| Events in quadrant D | 6,260,100 | 581,734 |
| Mode M0 | |||
|---|---|---|---|
| Quadrant | BADHDUFLAG | Total packets | Discarded packets |
| A | 0 | 16197 | 0 |
| B | 0 | 16068 | 0 |
| C | 0 | 15925 | 0 |
| D | 0 | 23780 | 0 |
| Mode M9 | |||
|---|---|---|---|
| Quadrant | BADHDUFLAG | Total packets | Discarded packets |
| A | 0 | 3 | 0 |
| B | 0 | 4 | 0 |
| C | 0 | 4 | 0 |
| D | 0 | 4 | 0 |
| Quadrant | Total seconds | Saturated seconds | Saturation percentage |
|---|---|---|---|
| A | 7495 | 78 | 1.040694% |
| B | 7495 | 116 | 1.547698% |
| C | 7495 | 159 | 2.121414% |
| D | 7494 | 333 | 4.443555% |
Noise dominated data is calculated using 1-second bins in cleaned event files. If a bin has >2000 counts, and if more than 50% of those come from <1% of pixels, then it is considered to be noise-dominated and hence unusable.
| Quadrant | # 1 sec bins | Bins with >0 counts | Bins with >2000 counts | High rate bins dominated by noise | Noise dominated (total time) | Noise dominated (detector-on time) | Marked lightcurve |
|---|---|---|---|---|---|---|---|
| A | 7755 | 7496 | 0 | 0 | 0.00% | 0.00% | 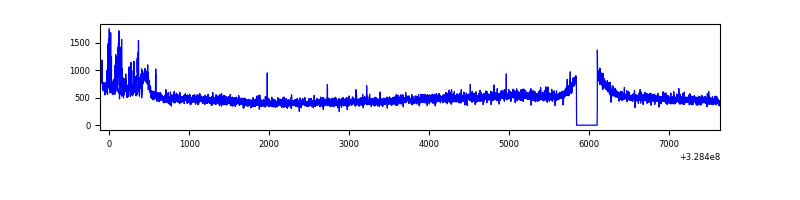 |
| B | 7755 | 7496 | 3 | 3 | 0.04% | 0.04% | 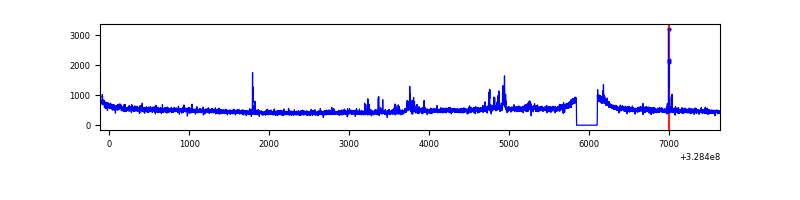 |
| C | 7755 | 7496 | 8 | 8 | 0.10% | 0.11% | 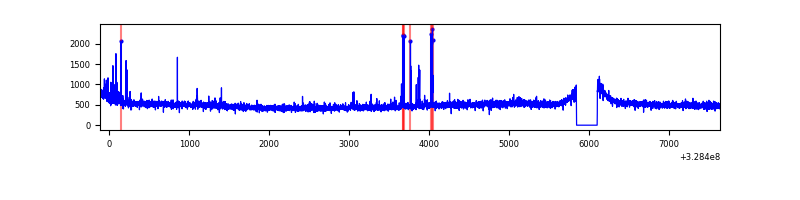 |
| D | 7754 | 7495 | 131 | 131 | 1.69% | 1.75% | 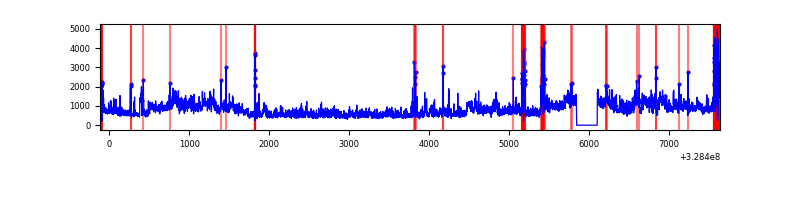 |
Top three noisy pixels from each quadrant. If the there are fewer than three noisy pixels in the level2.evt file, extra rows are filled as -1
| Pixel properties | Quadrant properties | ||||||
|---|---|---|---|---|---|---|---|
| Quadrant | DetID | PixID | Counts | Sigma | Mean | Median | Sigma |
| A | 6 | 16 | 159391 | 824.22 | 945 | 922 | 192.3 |
| A | 13 | 254 | 12670 | 61.1 | 945 | 922 | 192.3 |
| A | 3 | 137 | 8812 | 41.04 | 945 | 922 | 192.3 |
| B | 0 | 190 | 45700 | 245.52 | 940 | 917 | 182.4 |
| B | 3 | 64 | 30432 | 161.82 | 940 | 917 | 182.4 |
| B | 12 | 111 | 22382 | 117.68 | 940 | 917 | 182.4 |
| C | 14 | 238 | 142772 | 662.63 | 906 | 912 | 214.1 |
| C | 2 | 16 | 91619 | 423.69 | 906 | 912 | 214.1 |
| C | 3 | 233 | 27703 | 125.14 | 906 | 912 | 214.1 |
| D | 1 | 52 | 1596711 | 7211.31 | 904 | 879 | 221.3 |
| D | 8 | 195 | 522892 | 2358.89 | 904 | 879 | 221.3 |
| D | 10 | 70 | 230308 | 1036.75 | 904 | 879 | 221.3 |
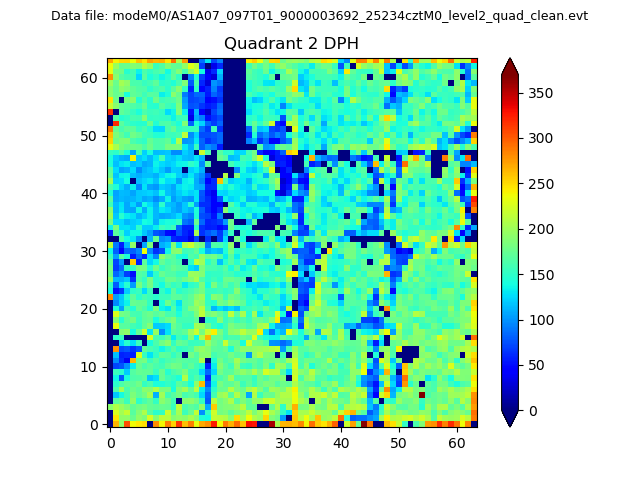
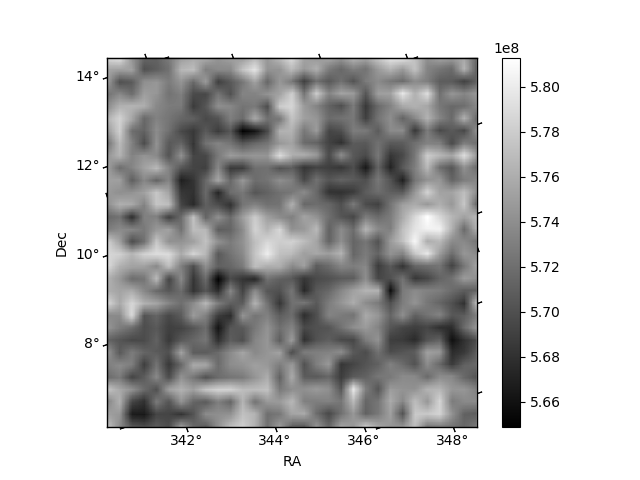
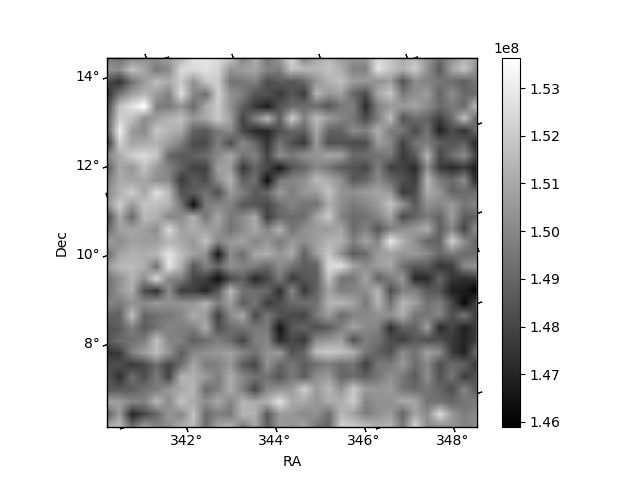
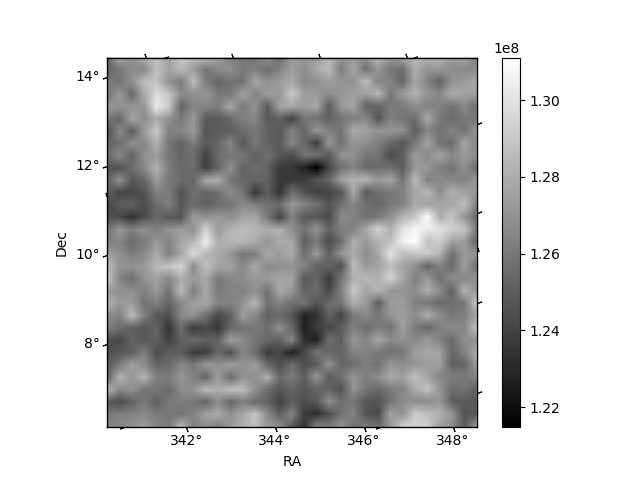
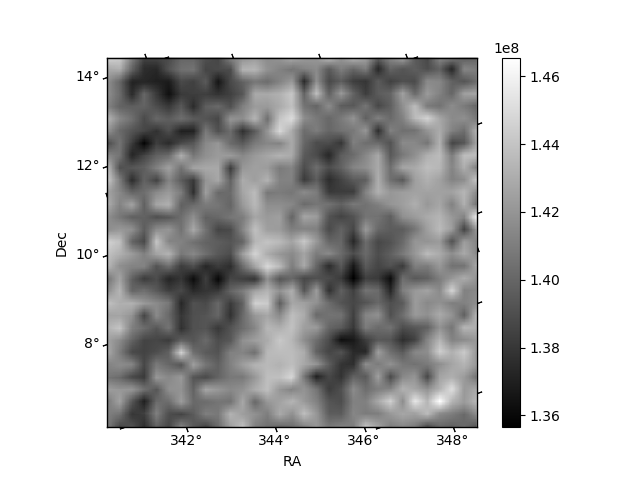
Histogram calculated using DETX and DETY for each event in the final _common_clean file
| Quadrant A | 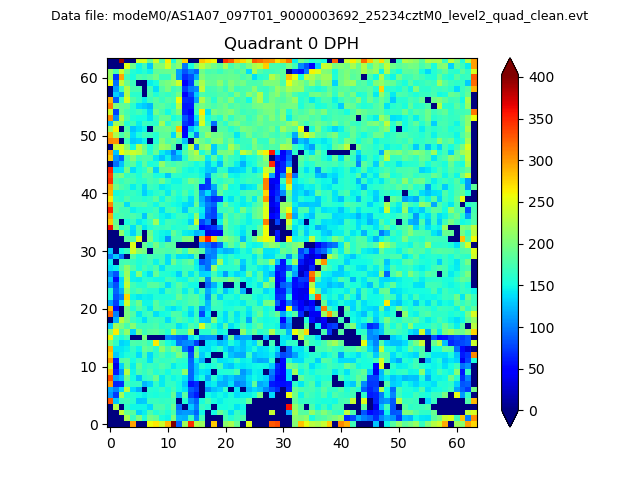 |
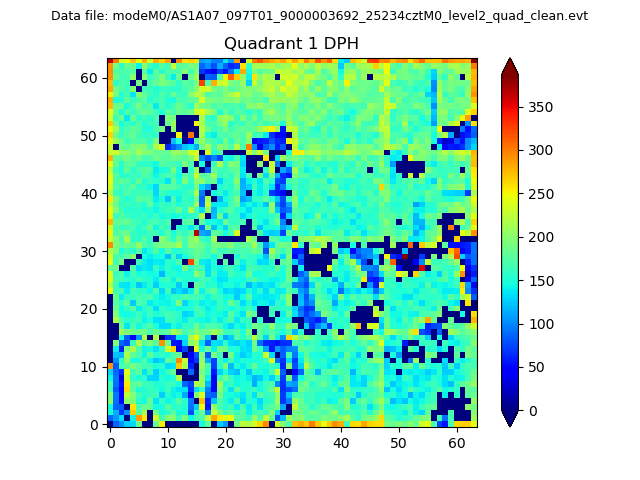 |
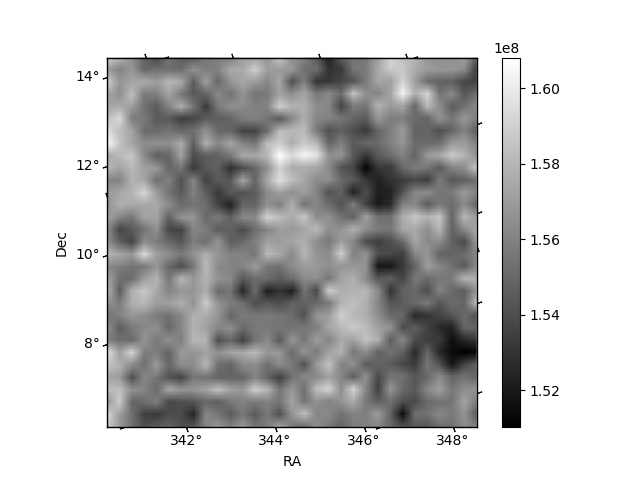
Quadrant B |
|---|---|---|---|
| Quadrant D | 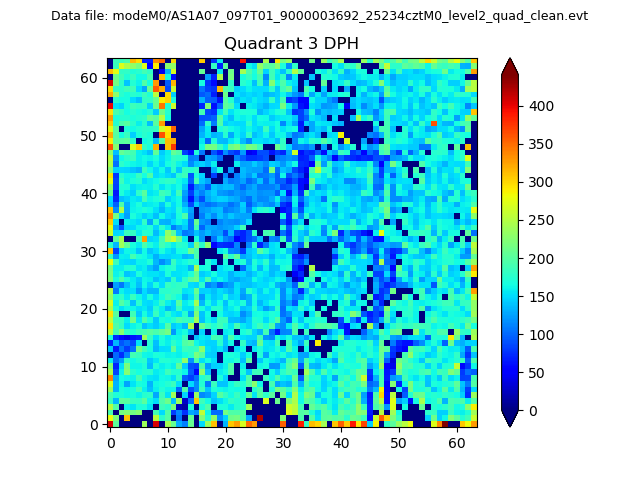 |
 |
Quadrant C |
| Plot type | Count rate plots | Images |
|---|---|---|
| Comparison with Poisson distribution Blue bars denote a histogram of data divided into 1 sec bins. Red curve is a Poisson curve with rate = median count rate of data. |
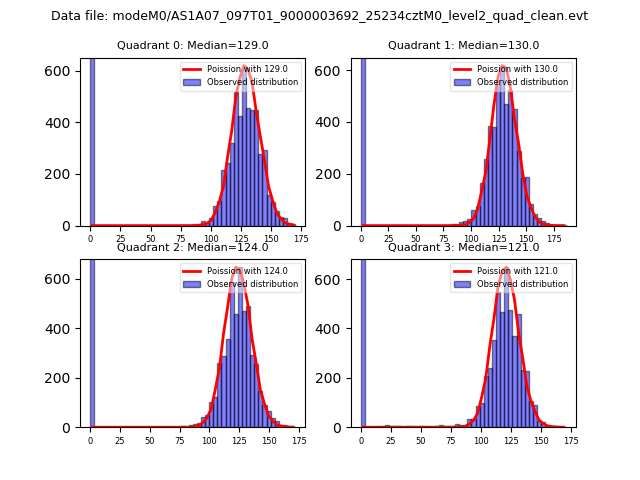 |
 |
| Quadrant-wise count rates Data is divided into 100 sec bins |
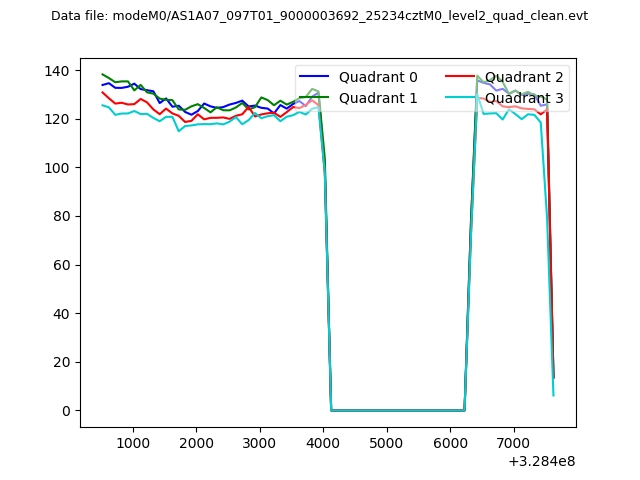 |
|
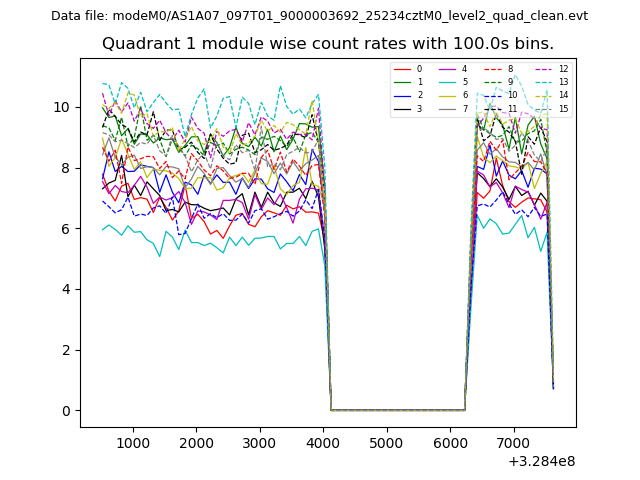
| Module-wise count rates for Quadrant A Data is divided into 100 sec bins |
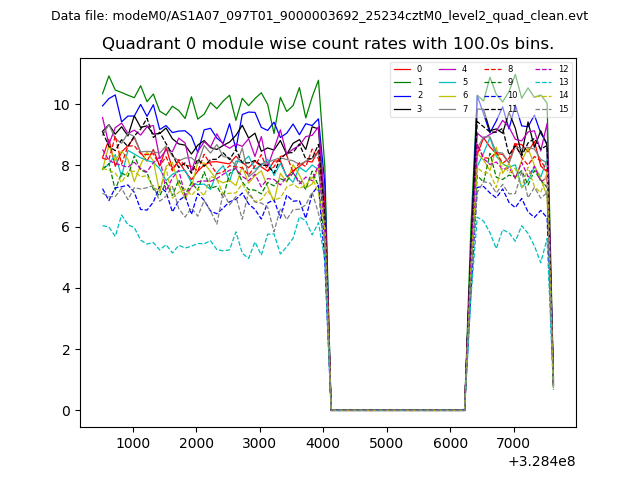 |
 |
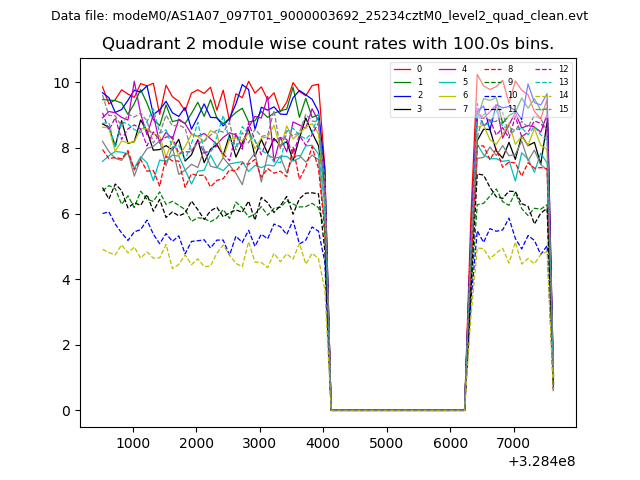
| Module-wise count rates for Quadrant B Data is divided into 100 sec bins |
 |
 |
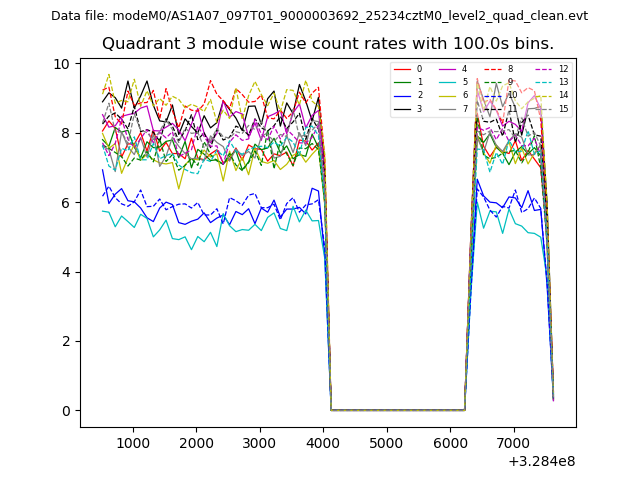
| Module-wise count rates for Quadrant C Data is divided into 100 sec bins |
 |
 |
| Module-wise count rates for Quadrant D Data is divided into 100 sec bins |
 |
 |
| Parameter | Plot |
|---|---|
| CZT HV Monitor | 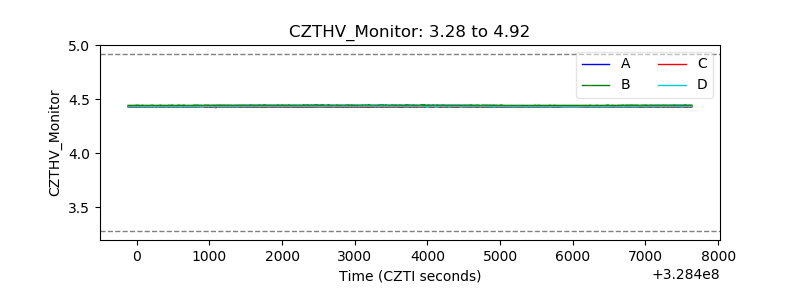 |
| D_VDD | 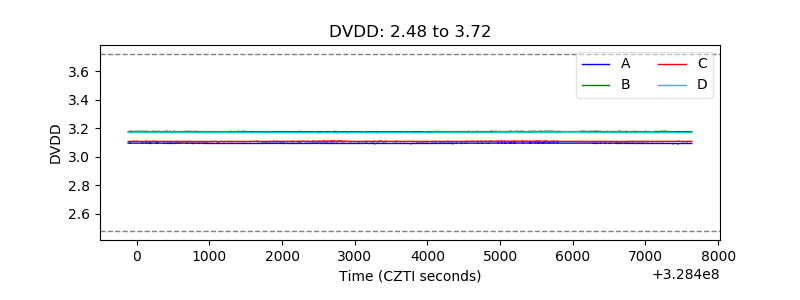 |
| Temperature 1 | 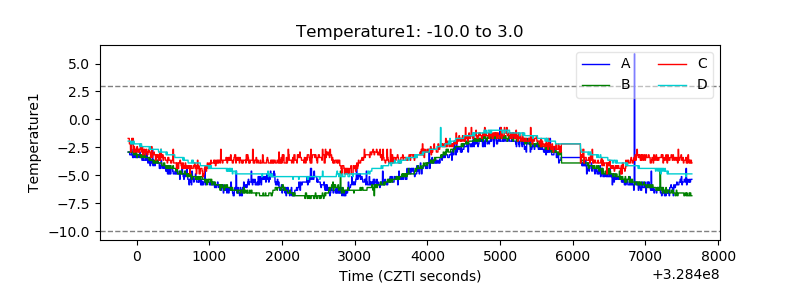 |
| Veto HV Monitor | 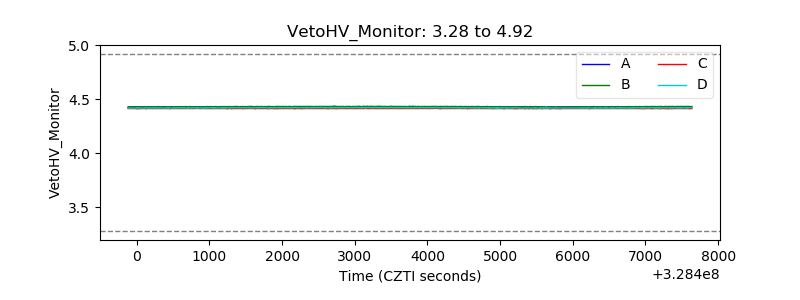 |
| Veto LLD | 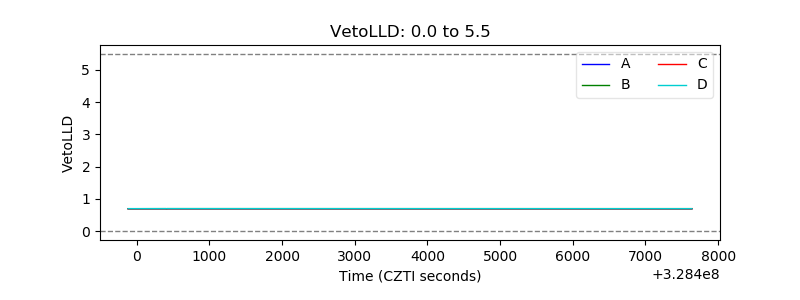 |
| Alpha Counter | 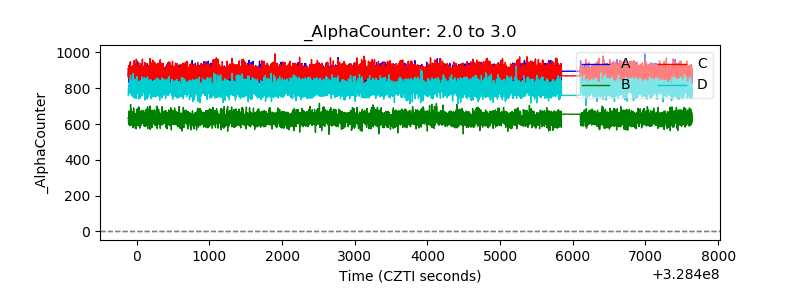 |
| _CPM_Rate | 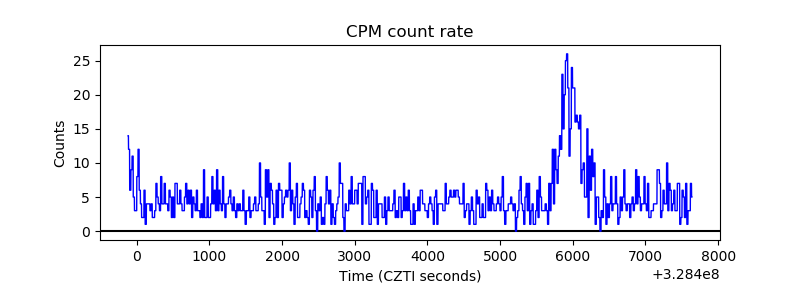 |
| CZT Counter | 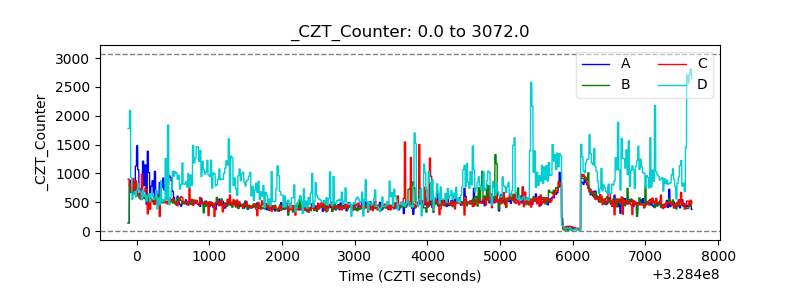 |
| +2.5 Volts monitor |  |
| +5 Volts monitor |  |
| _ROLL_ROT | 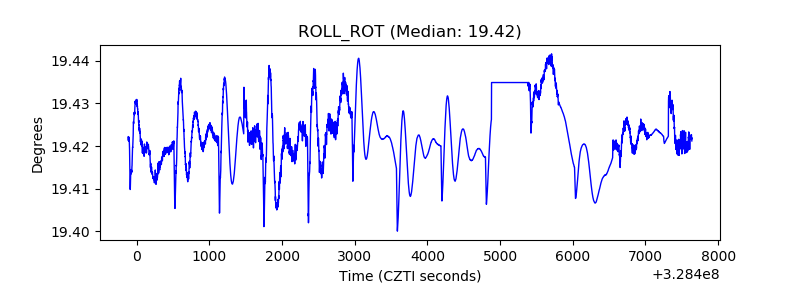 |
| _Roll_DEC | 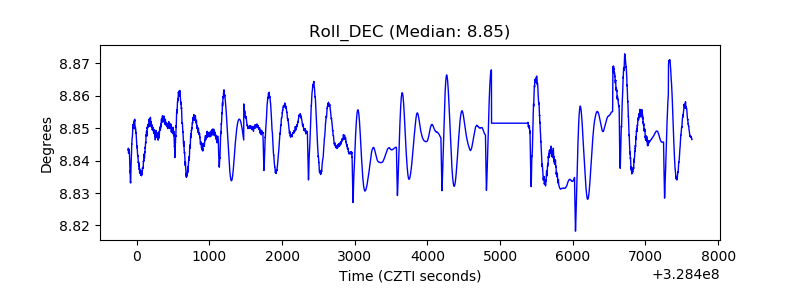 |
| _Roll_RA | 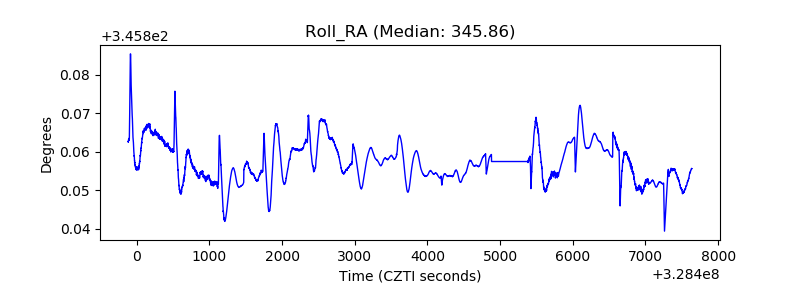 |
| Veto Counter | 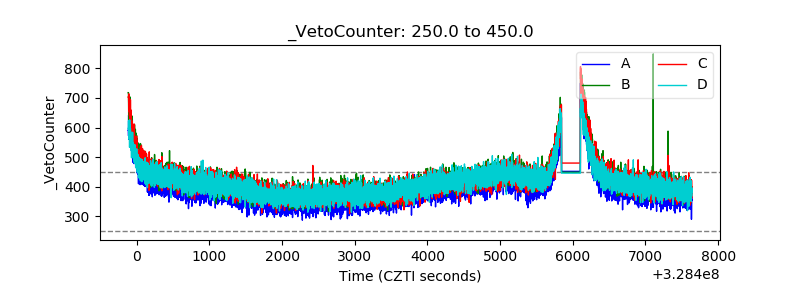 |