| Param | Original file | Final file |
|---|---|---|
| Filename | modeM0/AS1A07_097T01_9000003692_25235cztM0_level2.evt | modeM0/AS1A07_097T01_9000003692_25235cztM0_level2_quad_clean.evt |
| Size (bytes) | 666,636,480 | 103,775,040 |
| Size | 635.8 MB | 99.0 MB |
| Events in quadrant A | 3,970,409 | 660,006 |
| Events in quadrant B | 4,032,073 | 668,906 |
| Events in quadrant C | 4,076,515 | 639,011 |
| Events in quadrant D | 7,564,892 | 614,953 |
| Mode M0 | |||
|---|---|---|---|
| Quadrant | BADHDUFLAG | Total packets | Discarded packets |
| A | 0 | 17031 | 0 |
| B | 0 | 17167 | 0 |
| C | 0 | 17219 | 0 |
| D | 0 | 28184 | 0 |
| Mode M9 | |||
|---|---|---|---|
| Quadrant | BADHDUFLAG | Total packets | Discarded packets |
| A | 0 | 6 | 0 |
| B | 0 | 6 | 0 |
| C | 0 | 6 | 0 |
| D | 0 | 6 | 0 |
| Quadrant | Total seconds | Saturated seconds | Saturation percentage |
|---|---|---|---|
| A | 8057 | 109 | 1.352861% |
| B | 8058 | 148 | 1.836684% |
| C | 8058 | 216 | 2.680566% |
| D | 8058 | 582 | 7.222636% |
Noise dominated data is calculated using 1-second bins in cleaned event files. If a bin has >2000 counts, and if more than 50% of those come from <1% of pixels, then it is considered to be noise-dominated and hence unusable.
| Quadrant | # 1 sec bins | Bins with >0 counts | Bins with >2000 counts | High rate bins dominated by noise | Noise dominated (total time) | Noise dominated (detector-on time) | Marked lightcurve |
|---|---|---|---|---|---|---|---|
| A | 8697 | 8059 | 6 | 6 | 0.07% | 0.07% | 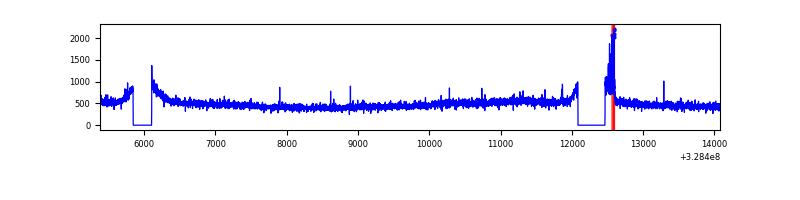 |
| B | 8698 | 8060 | 4 | 4 | 0.05% | 0.05% | 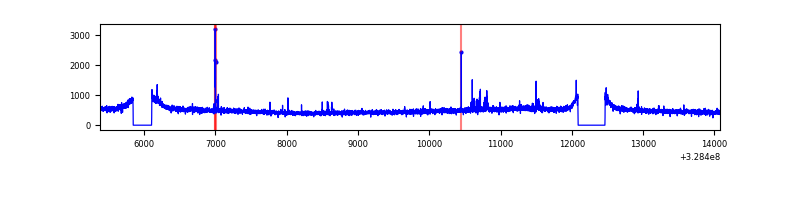 |
| C | 8698 | 8060 | 28 | 28 | 0.32% | 0.35% | 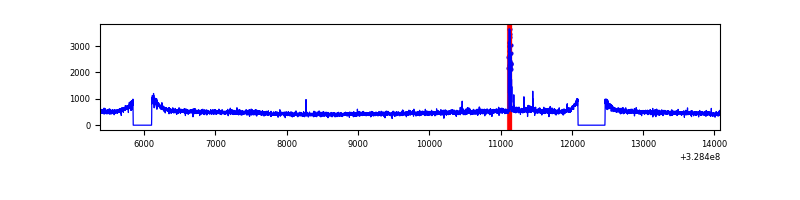 |
| D | 8698 | 8060 | 249 | 249 | 2.86% | 3.09% | 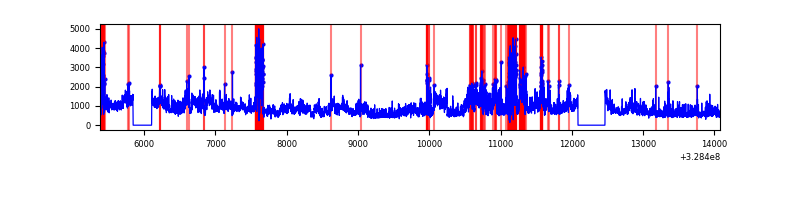 |
Top three noisy pixels from each quadrant. If the there are fewer than three noisy pixels in the level2.evt file, extra rows are filled as -1
| Pixel properties | Quadrant properties | ||||||
|---|---|---|---|---|---|---|---|
| Quadrant | DetID | PixID | Counts | Sigma | Mean | Median | Sigma |
| A | 6 | 16 | 57569 | 275.19 | 1014 | 989 | 205.6 |
| A | 13 | 254 | 13390 | 60.31 | 1014 | 989 | 205.6 |
| A | 3 | 137 | 9557 | 41.67 | 1014 | 989 | 205.6 |
| B | 0 | 190 | 32519 | 161.4 | 1009 | 983 | 195.4 |
| B | 12 | 111 | 24331 | 119.49 | 1009 | 983 | 195.4 |
| B | 10 | 251 | 23044 | 112.9 | 1009 | 983 | 195.4 |
| C | 14 | 238 | 153219 | 660.36 | 971 | 972 | 230.6 |
| C | 2 | 16 | 102041 | 438.38 | 971 | 972 | 230.6 |
| C | 3 | 233 | 30913 | 129.87 | 971 | 972 | 230.6 |
| D | 1 | 52 | 1815840 | 7726.03 | 962 | 933 | 234.9 |
| D | 8 | 195 | 712297 | 3028.26 | 962 | 933 | 234.9 |
| D | 10 | 70 | 506210 | 2150.95 | 962 | 933 | 234.9 |
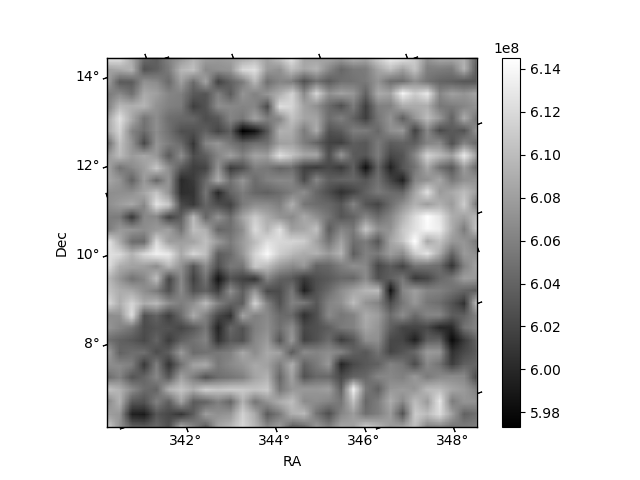
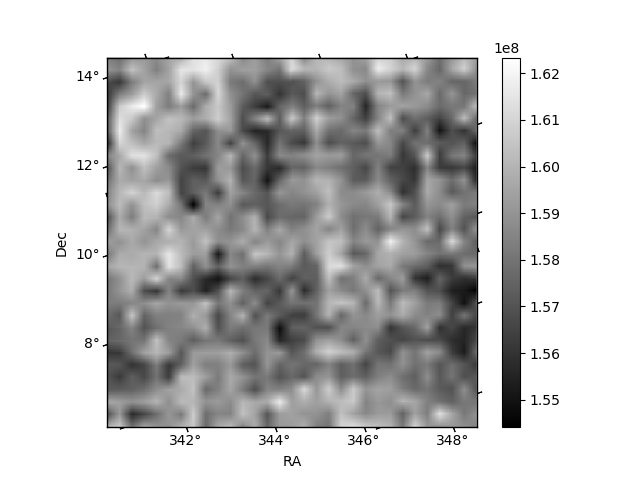
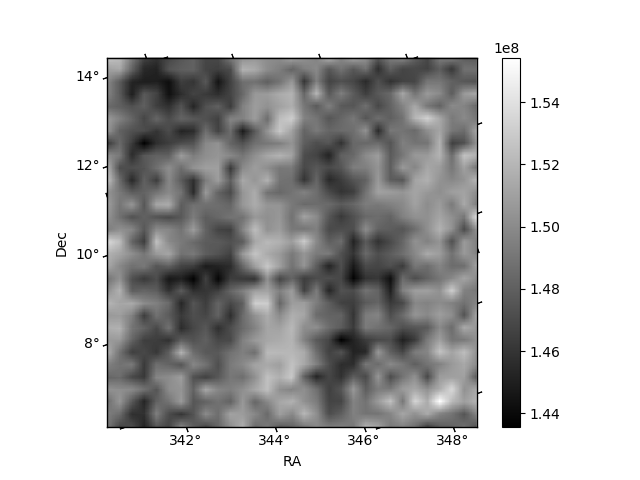
Histogram calculated using DETX and DETY for each event in the final _common_clean file
| Quadrant A | 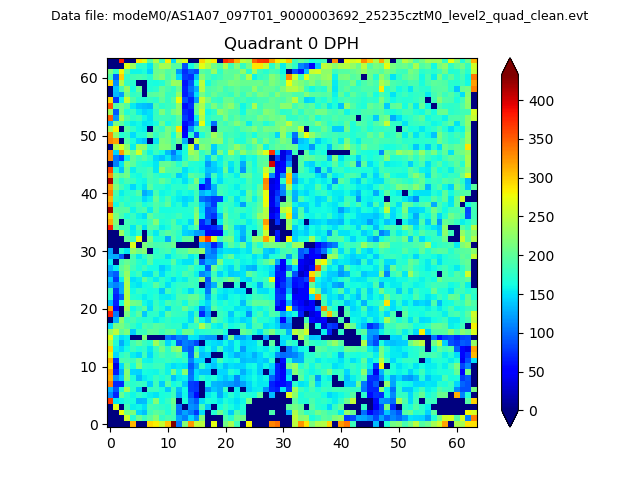 |
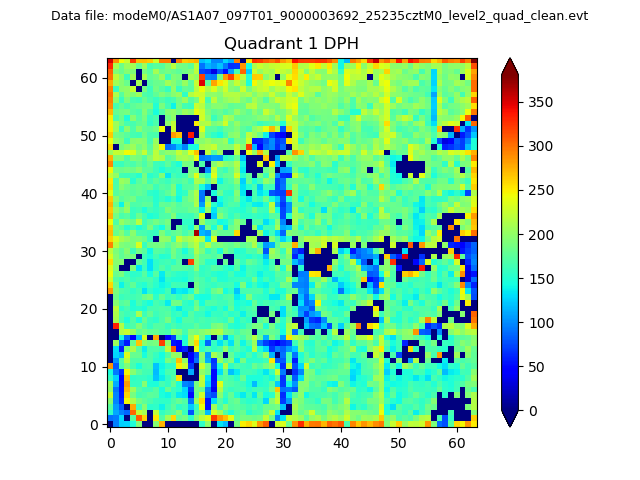 |
Quadrant B |
|---|---|---|---|
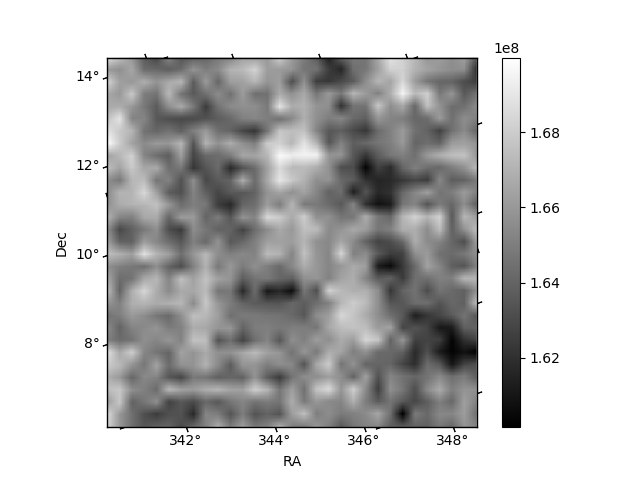
| Quadrant D | 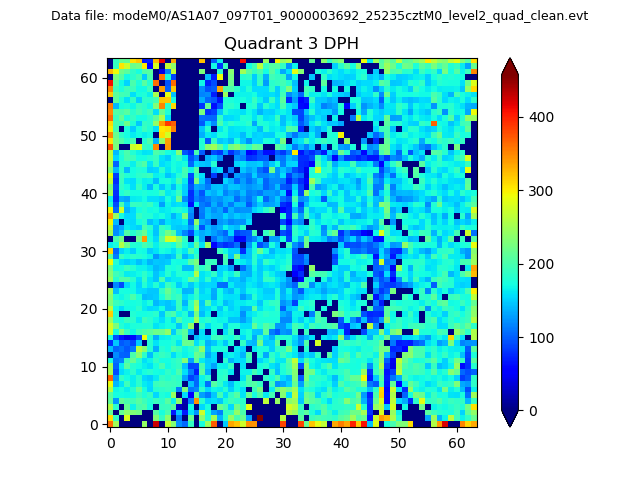 |
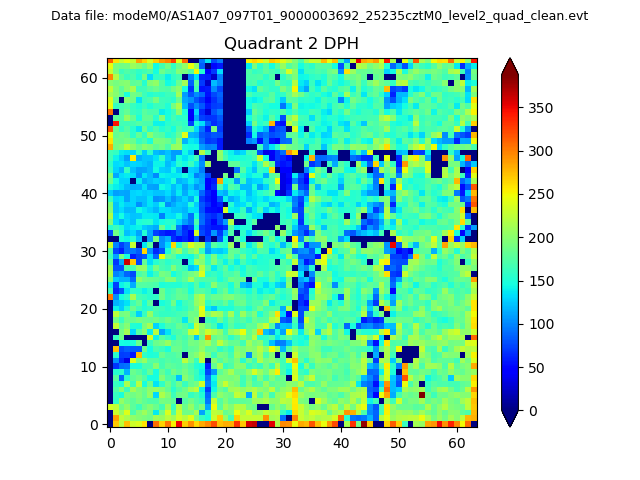 |
Quadrant C |
| Plot type | Count rate plots | Images |
|---|---|---|
| Comparison with Poisson distribution Blue bars denote a histogram of data divided into 1 sec bins. Red curve is a Poisson curve with rate = median count rate of data. |
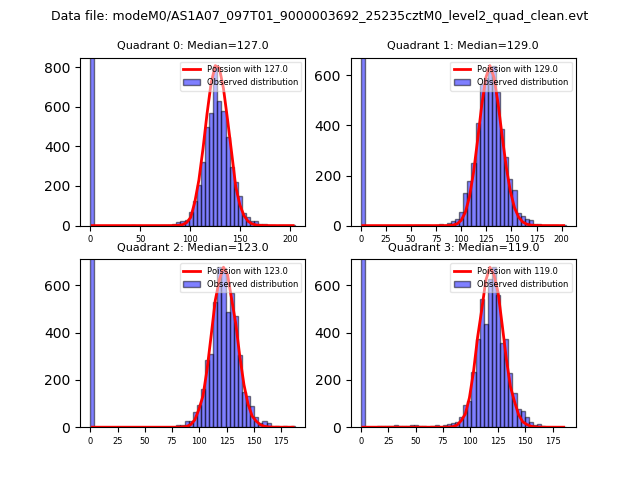 |
 |
| Quadrant-wise count rates Data is divided into 100 sec bins |
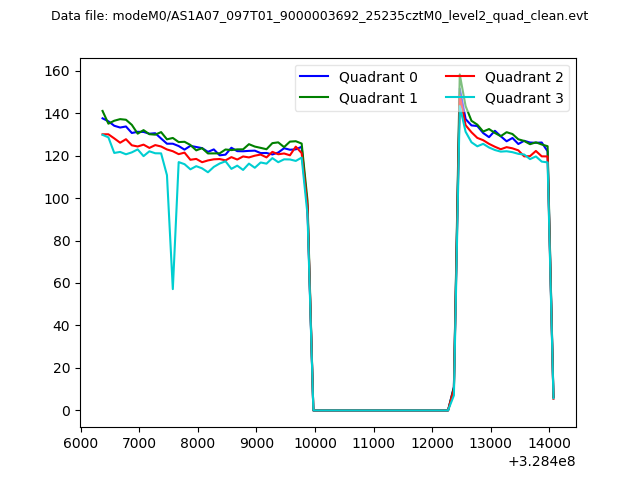 |
|
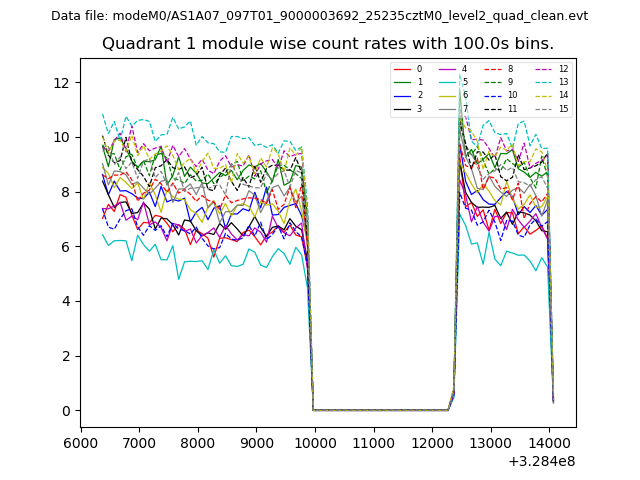
| Module-wise count rates for Quadrant A Data is divided into 100 sec bins |
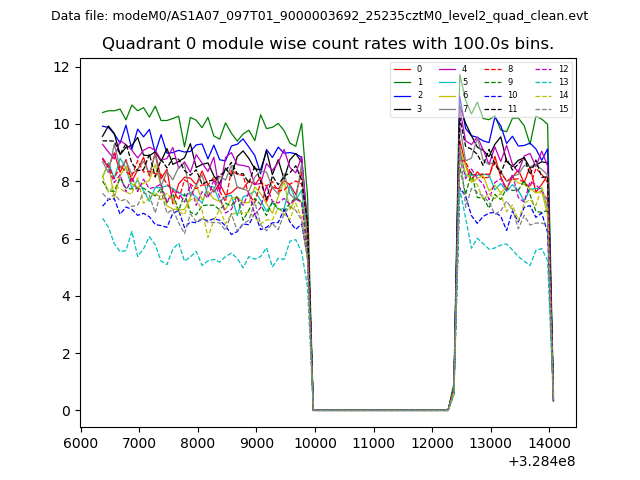 |
 |
| Module-wise count rates for Quadrant B Data is divided into 100 sec bins |
 |
 |
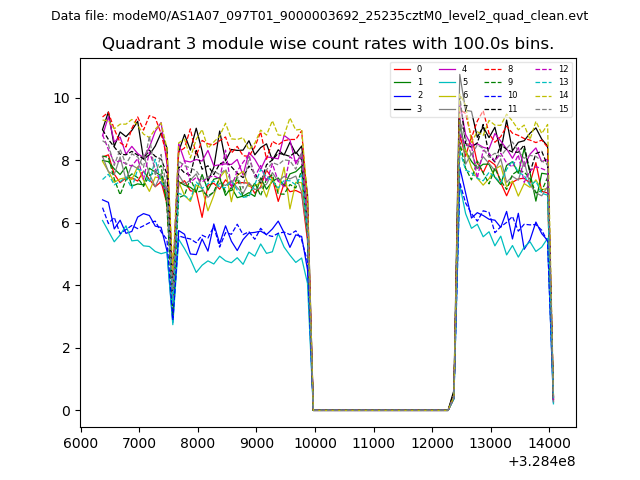
| Module-wise count rates for Quadrant C Data is divided into 100 sec bins |
 |
 |
| Module-wise count rates for Quadrant D Data is divided into 100 sec bins |
 |
 |
| Parameter | Plot |
|---|---|
| CZT HV Monitor | 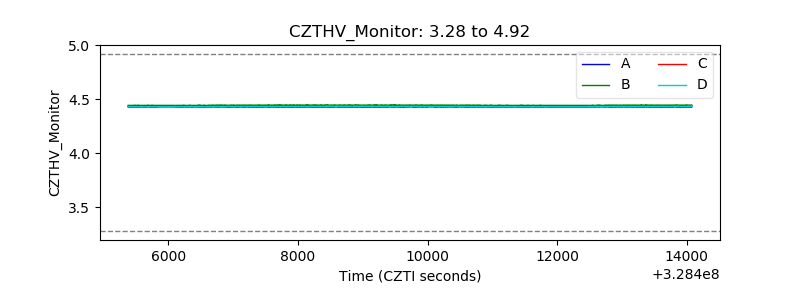 |
| D_VDD | 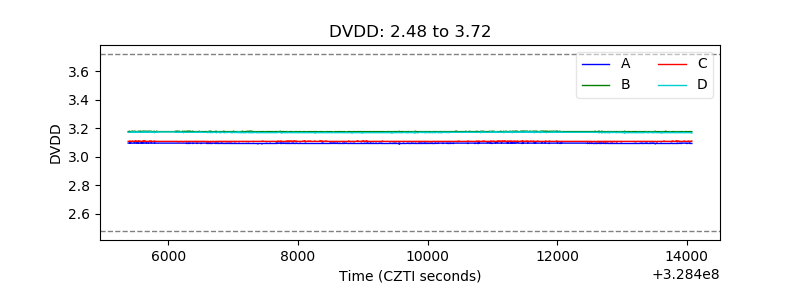 |
| Temperature 1 |  |
| Veto HV Monitor | 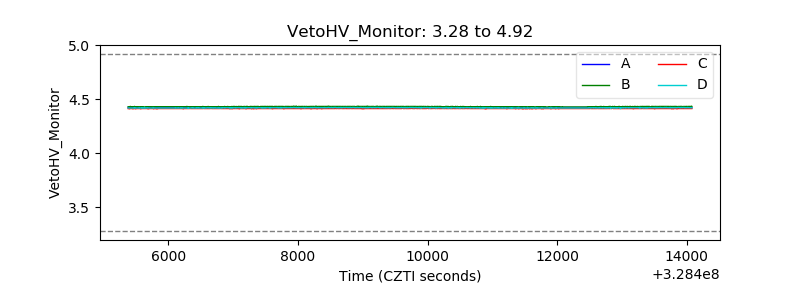 |
| Veto LLD | 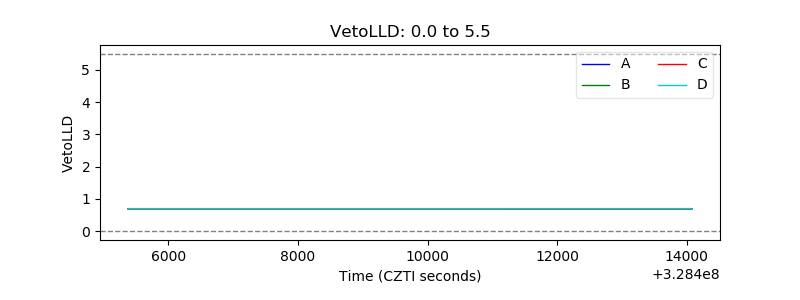 |
| Alpha Counter | 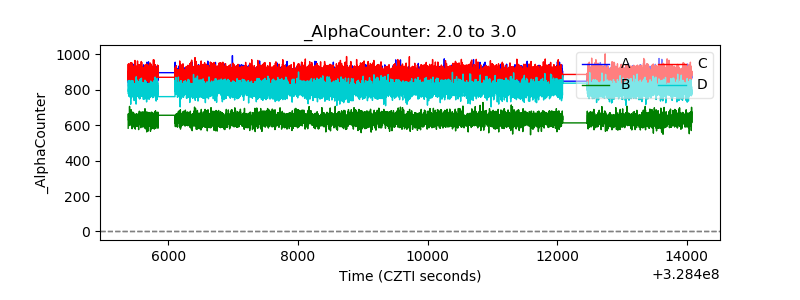 |
| _CPM_Rate | 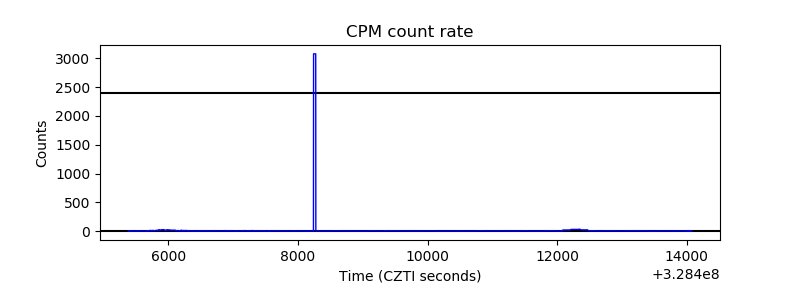 |
| CZT Counter | 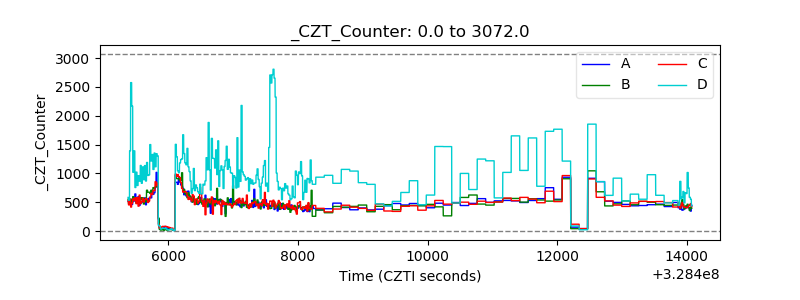 |
| +2.5 Volts monitor |  |
| +5 Volts monitor | 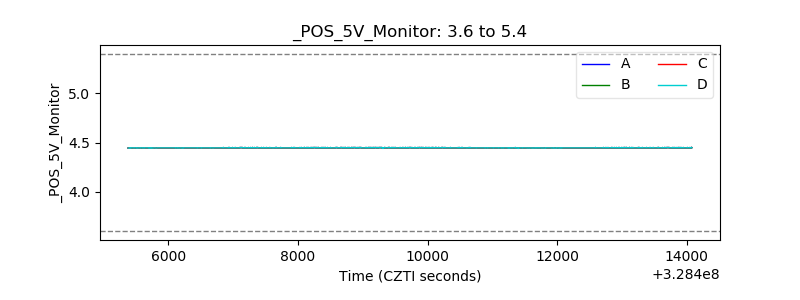 |
| _ROLL_ROT | 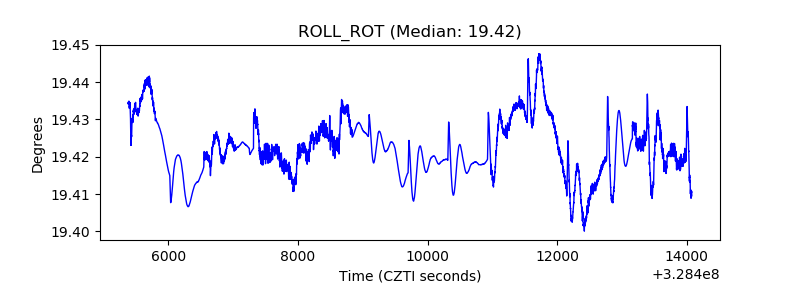 |
| _Roll_DEC | 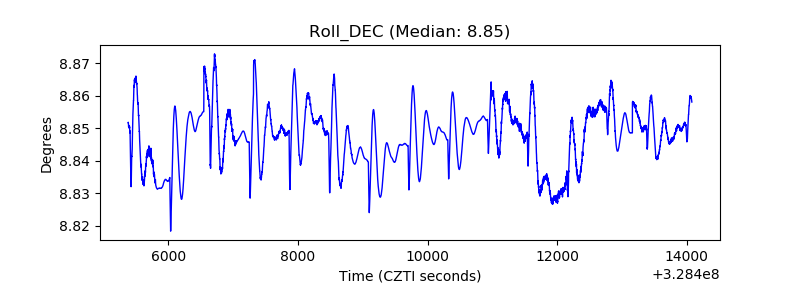 |
| _Roll_RA | 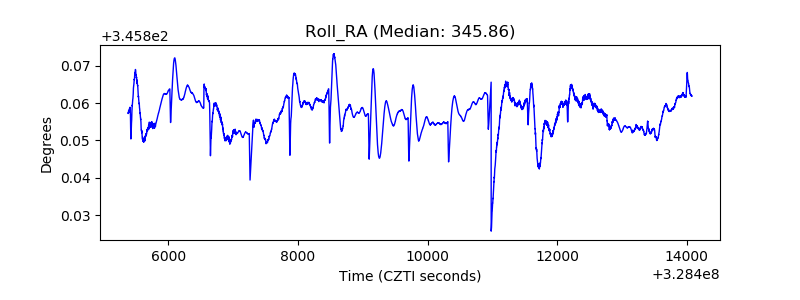 |
| Veto Counter | 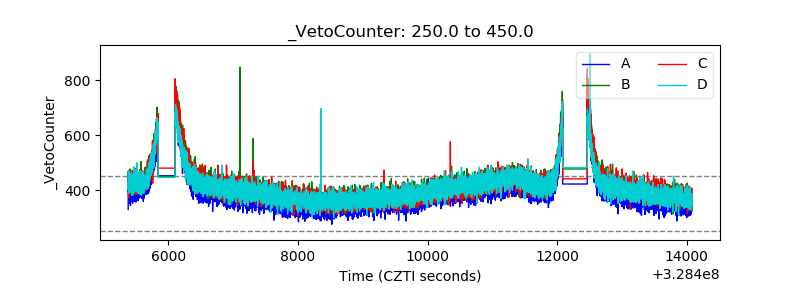 |