| Param | Original file | Final file |
|---|---|---|
| Filename | modeM0/AS1A07_097T01_9000003692_25239cztM0_level2.evt | modeM0/AS1A07_097T01_9000003692_25239cztM0_level2_quad_clean.evt |
| Size (bytes) | 1,730,226,240 | 277,842,240 |
| Size | 1.6 GB | 265.0 MB |
| Events in quadrant A | 10,786,029 | 1,748,806 |
| Events in quadrant B | 10,890,776 | 1,775,564 |
| Events in quadrant C | 14,441,590 | 1,674,257 |
| Events in quadrant D | 14,753,742 | 1,657,675 |
| Mode M0 | |||
|---|---|---|---|
| Quadrant | BADHDUFLAG | Total packets | Discarded packets |
| A | 0 | 46388 | 0 |
| B | 0 | 46698 | 0 |
| C | 0 | 57929 | 0 |
| D | 0 | 59217 | 0 |
| Mode M9 | |||
|---|---|---|---|
| Quadrant | BADHDUFLAG | Total packets | Discarded packets |
| A | 0 | 30 | 0 |
| B | 0 | 30 | 0 |
| C | 0 | 30 | 0 |
| D | 0 | 30 | 0 |
| Quadrant | Total seconds | Saturated seconds | Saturation percentage |
|---|---|---|---|
| A | 22650 | 144 | 0.635762% |
| B | 22650 | 182 | 0.803532% |
| C | 22650 | 828 | 3.655629% |
| D | 22650 | 515 | 2.273731% |
Noise dominated data is calculated using 1-second bins in cleaned event files. If a bin has >2000 counts, and if more than 50% of those come from <1% of pixels, then it is considered to be noise-dominated and hence unusable.
| Quadrant | # 1 sec bins | Bins with >0 counts | Bins with >2000 counts | High rate bins dominated by noise | Noise dominated (total time) | Noise dominated (detector-on time) | Marked lightcurve |
|---|---|---|---|---|---|---|---|
| A | 25790 | 22654 | 0 | 0 | 0.00% | 0.00% | 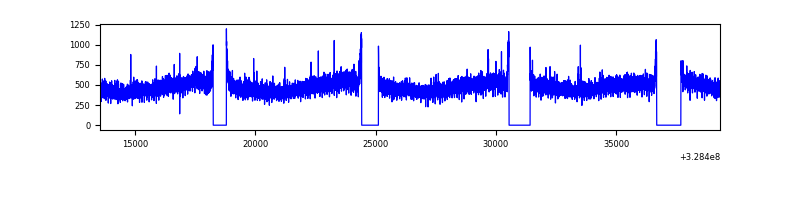 |
| B | 25790 | 22654 | 2 | 2 | 0.01% | 0.01% | 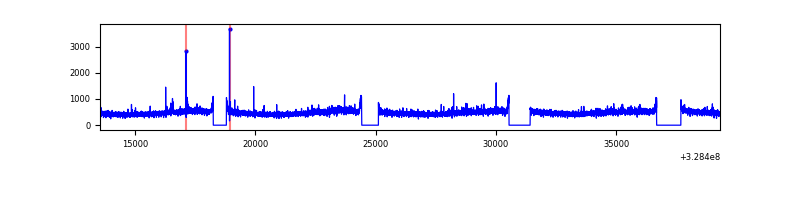 |
| C | 25790 | 22654 | 345 | 345 | 1.34% | 1.52% | 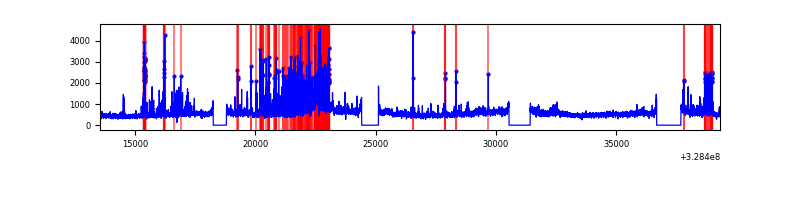 |
| D | 25790 | 22654 | 266 | 266 | 1.03% | 1.17% | 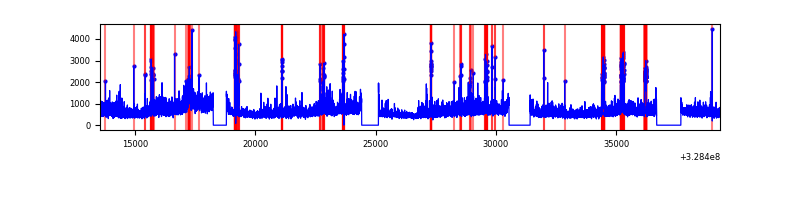 |
Top three noisy pixels from each quadrant. If the there are fewer than three noisy pixels in the level2.evt file, extra rows are filled as -1
| Pixel properties | Quadrant properties | ||||||
|---|---|---|---|---|---|---|---|
| Quadrant | DetID | PixID | Counts | Sigma | Mean | Median | Sigma |
| A | 3 | 1 | 35400 | 58.82 | 2784 | 2726 | 555.5 |
| A | 13 | 254 | 34261 | 56.77 | 2784 | 2726 | 555.5 |
| A | 3 | 137 | 25502 | 41.0 | 2784 | 2726 | 555.5 |
| B | 12 | 111 | 65501 | 119.04 | 2758 | 2686 | 527.7 |
| B | 11 | 111 | 58758 | 106.26 | 2758 | 2686 | 527.7 |
| B | 14 | 111 | 51895 | 93.25 | 2758 | 2686 | 527.7 |
| C | 0 | 239 | 2459158 | 3993.42 | 2628 | 2643 | 615.1 |
| C | 7 | 247 | 858976 | 1392.09 | 2628 | 2643 | 615.1 |
| C | 14 | 238 | 417939 | 675.12 | 2628 | 2643 | 615.1 |
| D | 8 | 195 | 2157456 | 3314.09 | 2684 | 2606 | 650.2 |
| D | 1 | 52 | 1175097 | 1803.25 | 2684 | 2606 | 650.2 |
| D | 10 | 70 | 738569 | 1131.89 | 2684 | 2606 | 650.2 |
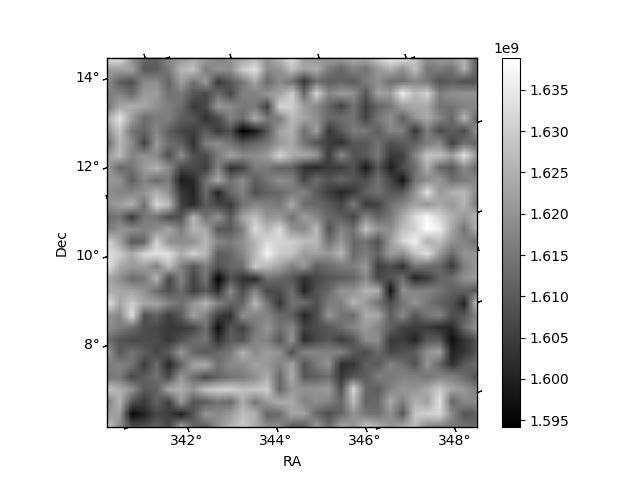
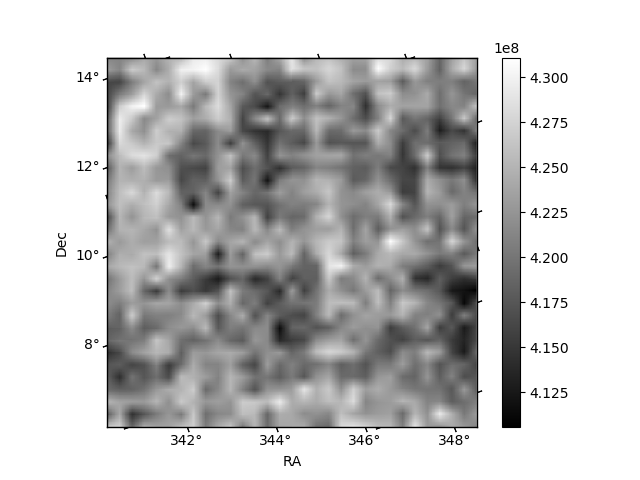
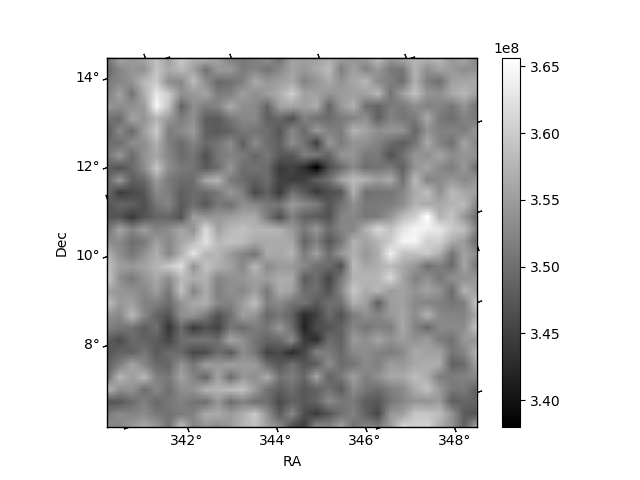
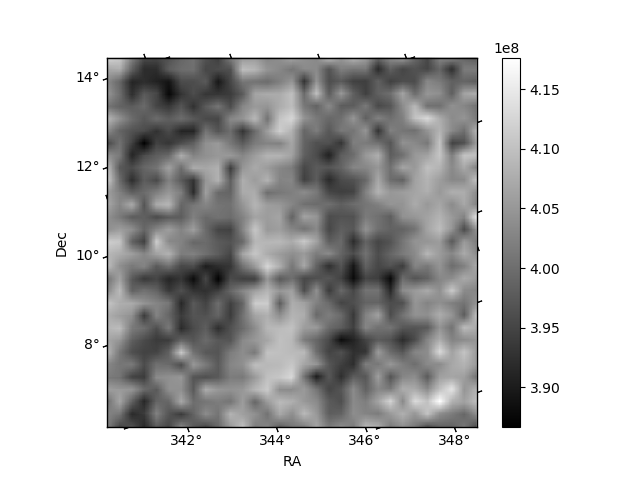
Histogram calculated using DETX and DETY for each event in the final _common_clean file
| Quadrant A | 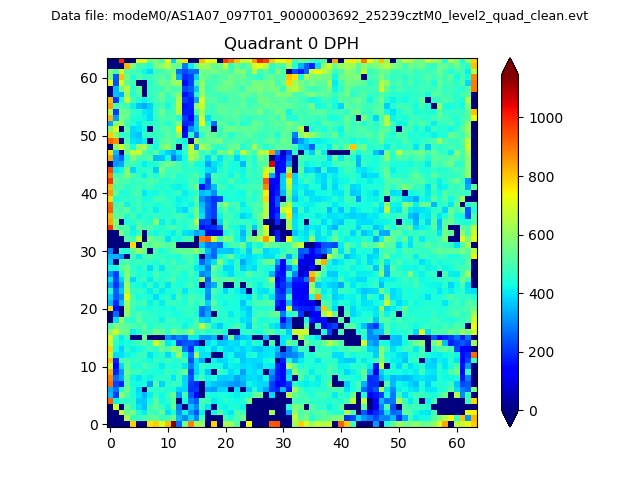 |
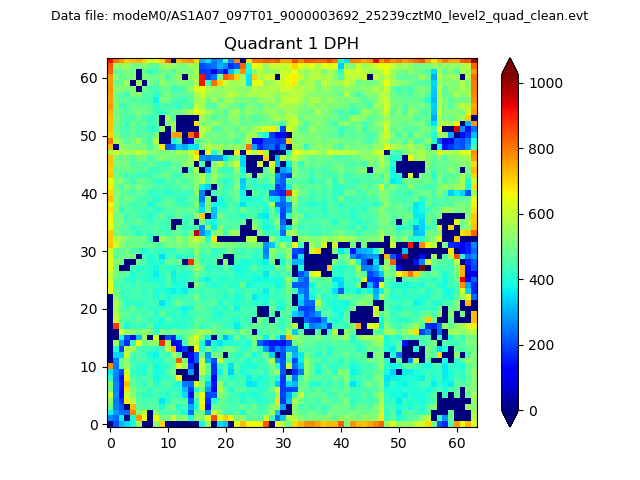 |
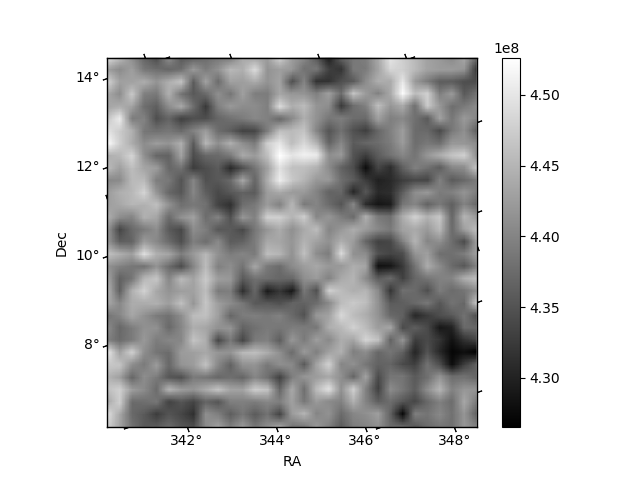
Quadrant B |
|---|---|---|---|
| Quadrant D | 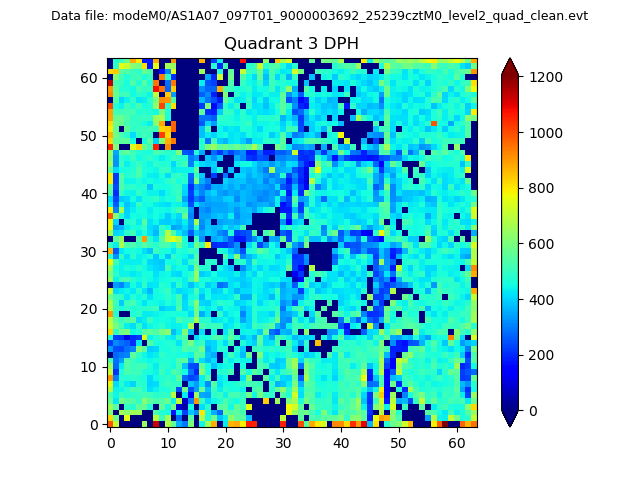 |
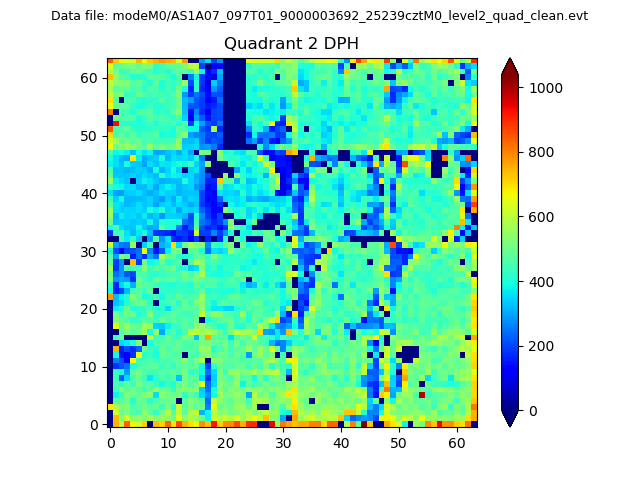 |
Quadrant C |
| Plot type | Count rate plots | Images |
|---|---|---|
| Comparison with Poisson distribution Blue bars denote a histogram of data divided into 1 sec bins. Red curve is a Poisson curve with rate = median count rate of data. |
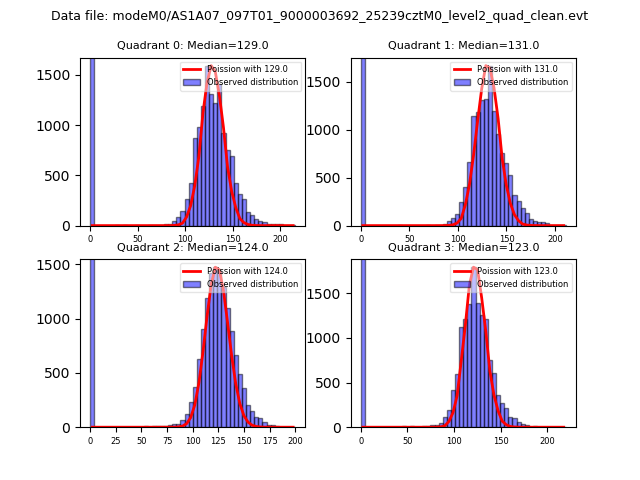 |
 |
| Quadrant-wise count rates Data is divided into 100 sec bins |
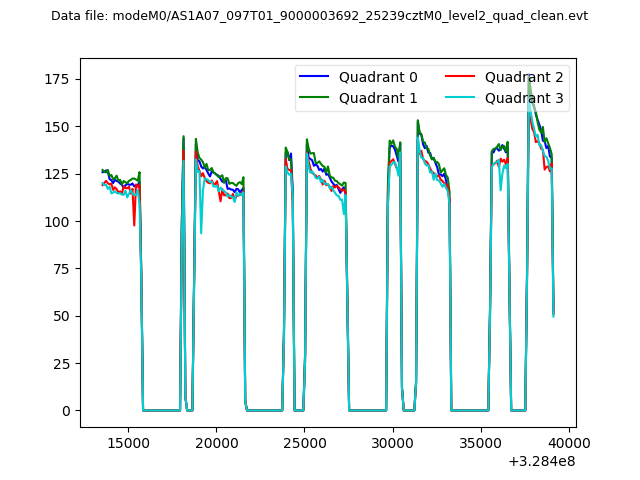 |
|
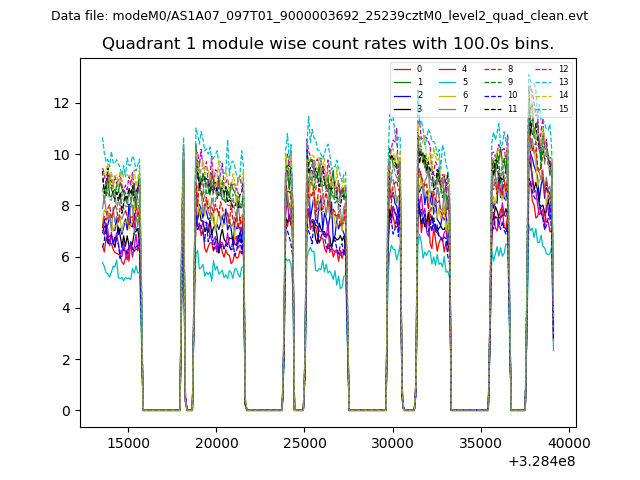
| Module-wise count rates for Quadrant A Data is divided into 100 sec bins |
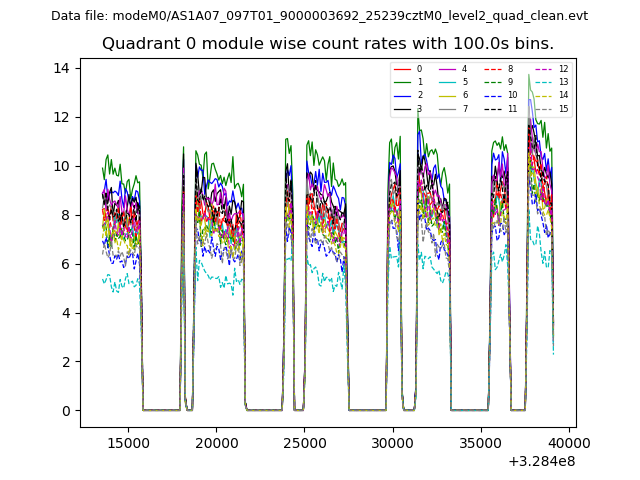 |
 |
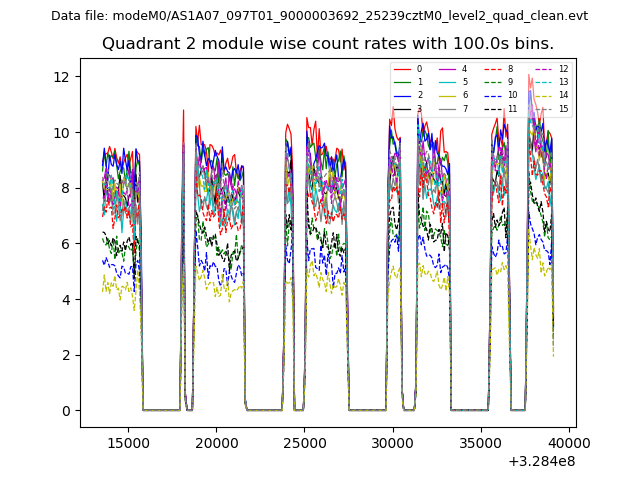
| Module-wise count rates for Quadrant B Data is divided into 100 sec bins |
 |
 |
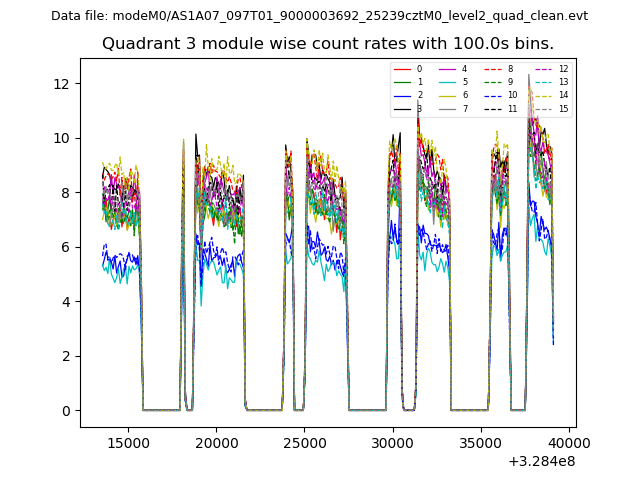
| Module-wise count rates for Quadrant C Data is divided into 100 sec bins |
 |
 |
| Module-wise count rates for Quadrant D Data is divided into 100 sec bins |
 |
 |
| Parameter | Plot |
|---|---|
| CZT HV Monitor | 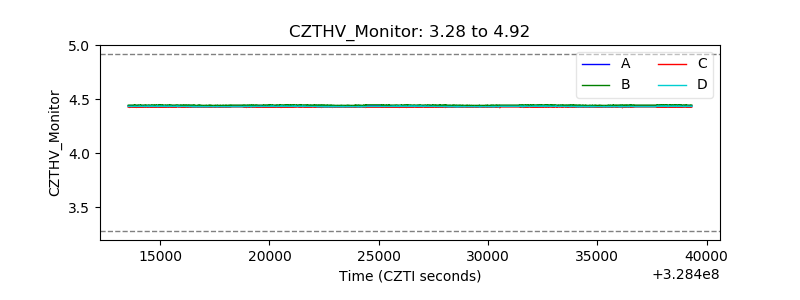 |
| D_VDD | 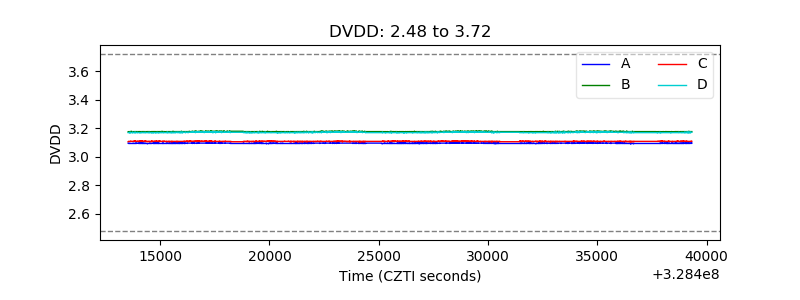 |
| Temperature 1 | 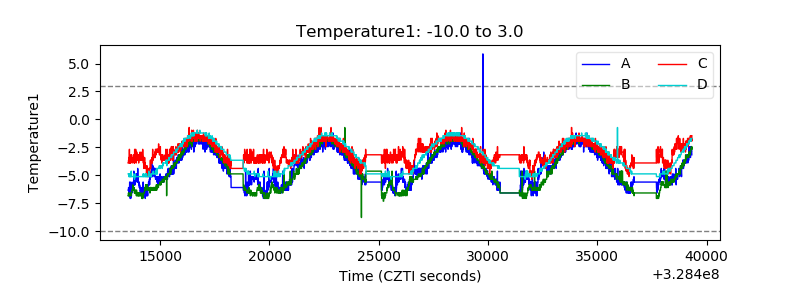 |
| Veto HV Monitor | 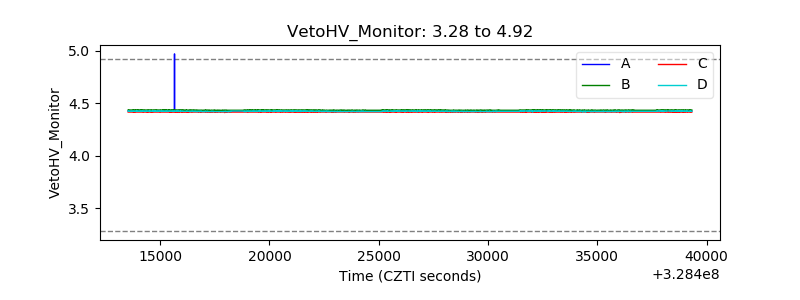 |
| Veto LLD | 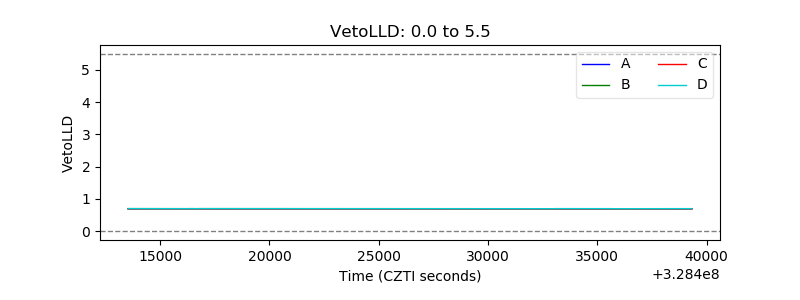 |
| Alpha Counter | 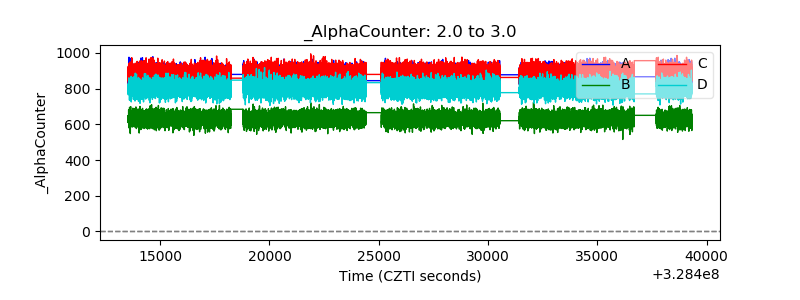 |
| _CPM_Rate | 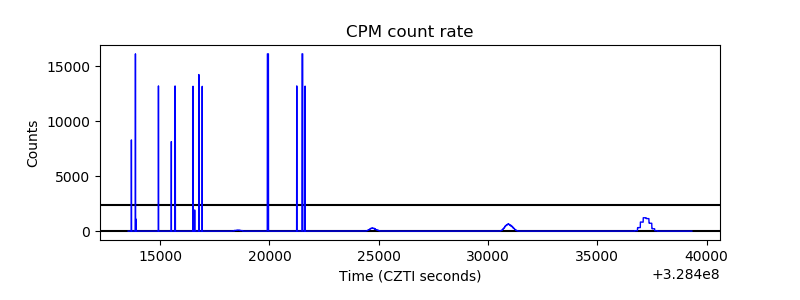 |
| CZT Counter |  |
| +2.5 Volts monitor |  |
| +5 Volts monitor |  |
| _ROLL_ROT | 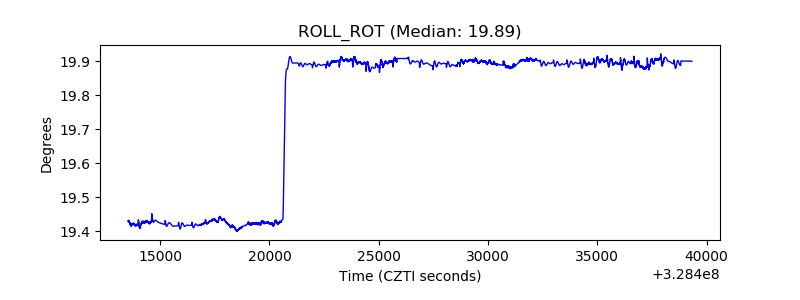 |
| _Roll_DEC | 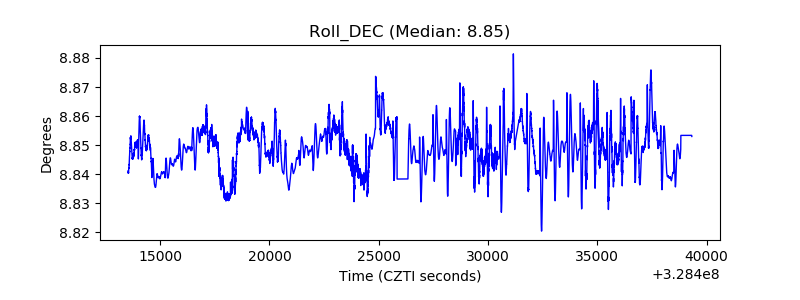 |
| _Roll_RA | 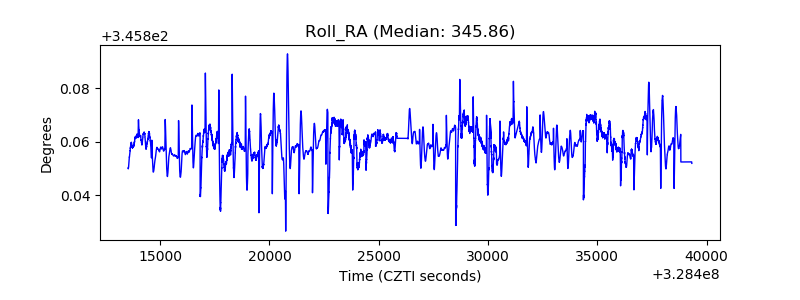 |
| Veto Counter | 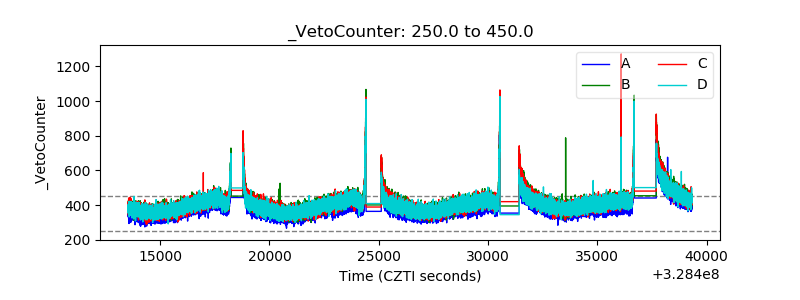 |