| Param | Original file | Final file |
|---|---|---|
| Filename | modeM0/AS1A07_097T01_9000003692_25241cztM0_level2.evt | modeM0/AS1A07_097T01_9000003692_25241cztM0_level2_quad_clean.evt |
| Size (bytes) | 549,118,080 | 85,201,920 |
| Size | 523.7 MB | 81.3 MB |
| Events in quadrant A | 3,252,732 | 555,856 |
| Events in quadrant B | 3,267,387 | 555,966 |
| Events in quadrant C | 5,643,696 | 504,130 |
| Events in quadrant D | 4,036,532 | 521,512 |
| Mode M0 | |||
|---|---|---|---|
| Quadrant | BADHDUFLAG | Total packets | Discarded packets |
| A | 0 | 13361 | 0 |
| B | 0 | 13363 | 0 |
| C | 0 | 20866 | 0 |
| D | 0 | 16158 | 0 |
| Mode M9 | |||
|---|---|---|---|
| Quadrant | BADHDUFLAG | Total packets | Discarded packets |
| A | 0 | 11 | 0 |
| B | 0 | 11 | 0 |
| C | 0 | 11 | 0 |
| D | 0 | 11 | 0 |
| Quadrant | Total seconds | Saturated seconds | Saturation percentage |
|---|---|---|---|
| A | 6343 | 59 | 0.930159% |
| B | 6344 | 69 | 1.087642% |
| C | 6344 | 804 | 12.673392% |
| D | 6344 | 128 | 2.017654% |
Noise dominated data is calculated using 1-second bins in cleaned event files. If a bin has >2000 counts, and if more than 50% of those come from <1% of pixels, then it is considered to be noise-dominated and hence unusable.
| Quadrant | # 1 sec bins | Bins with >0 counts | Bins with >2000 counts | High rate bins dominated by noise | Noise dominated (total time) | Noise dominated (detector-on time) | Marked lightcurve |
|---|---|---|---|---|---|---|---|
| A | 7463 | 6344 | 0 | 0 | 0.00% | 0.00% | 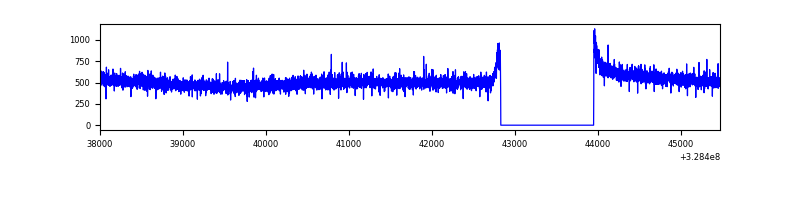 |
| B | 7464 | 6345 | 0 | 0 | 0.00% | 0.00% |  |
| C | 7464 | 6345 | 477 | 477 | 6.39% | 7.52% | 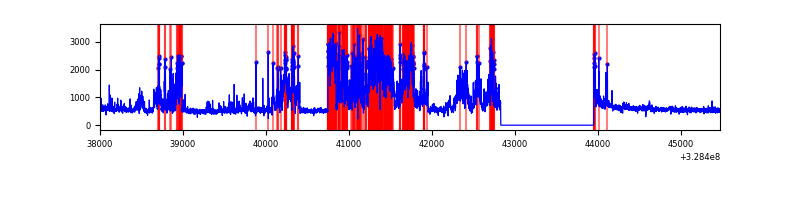 |
| D | 7464 | 6345 | 59 | 59 | 0.79% | 0.93% | 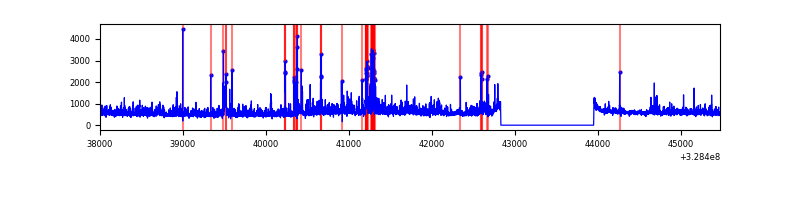 |
Top three noisy pixels from each quadrant. If the there are fewer than three noisy pixels in the level2.evt file, extra rows are filled as -1
| Pixel properties | Quadrant properties | ||||||
|---|---|---|---|---|---|---|---|
| Quadrant | DetID | PixID | Counts | Sigma | Mean | Median | Sigma |
| A | 3 | 1 | 12963 | 72.56 | 841 | 826 | 167.3 |
| A | 13 | 254 | 8757 | 47.42 | 841 | 826 | 167.3 |
| A | 0 | 226 | 7272 | 38.54 | 841 | 826 | 167.3 |
| B | 0 | 190 | 22158 | 136.83 | 822 | 805 | 156.1 |
| B | 12 | 111 | 18795 | 115.28 | 822 | 805 | 156.1 |
| B | 10 | 251 | 17250 | 105.38 | 822 | 805 | 156.1 |
| C | 0 | 239 | 2269384 | 12845.21 | 756 | 763 | 176.6 |
| C | 7 | 247 | 192713 | 1086.84 | 756 | 763 | 176.6 |
| C | 14 | 238 | 123329 | 693.98 | 756 | 763 | 176.6 |
| D | 8 | 195 | 432468 | 2216.77 | 808 | 785 | 194.7 |
| D | 10 | 70 | 258406 | 1322.93 | 808 | 785 | 194.7 |
| D | 2 | 244 | 143407 | 732.39 | 808 | 785 | 194.7 |
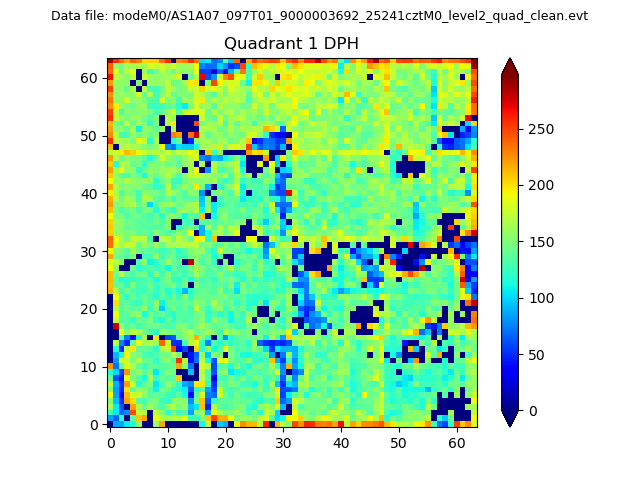
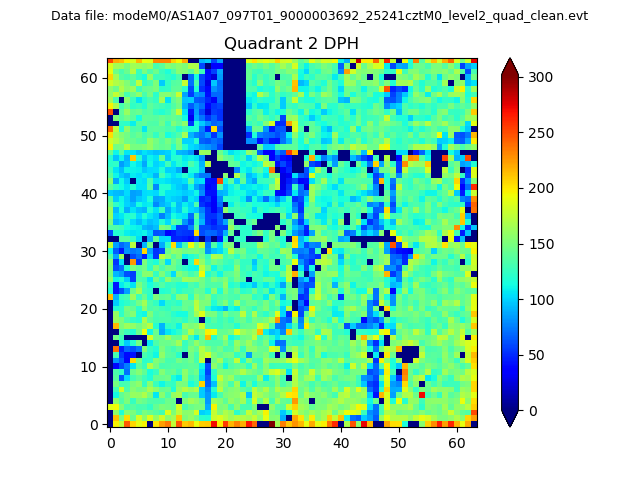
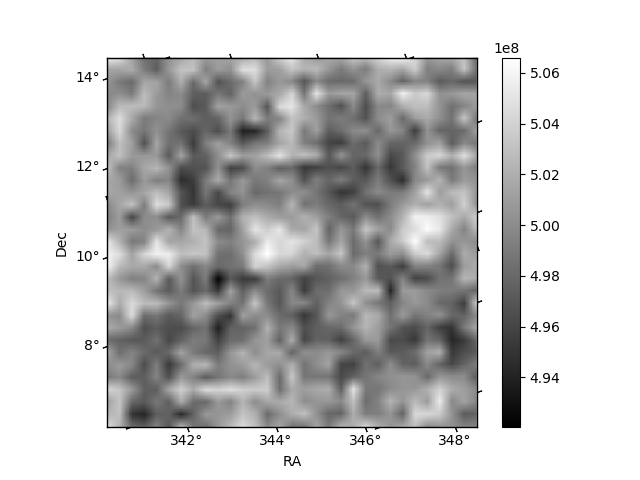
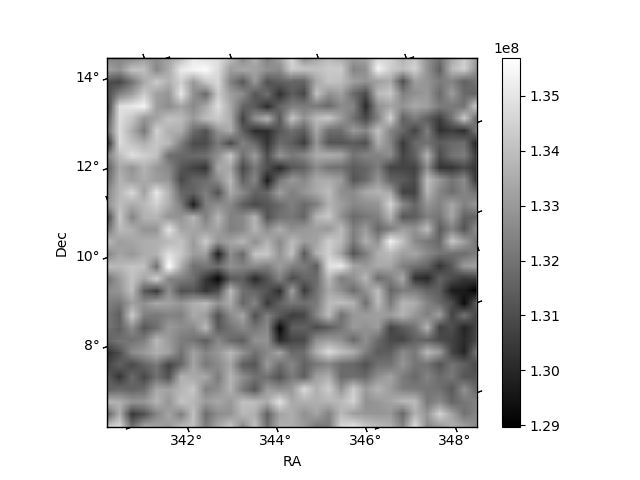
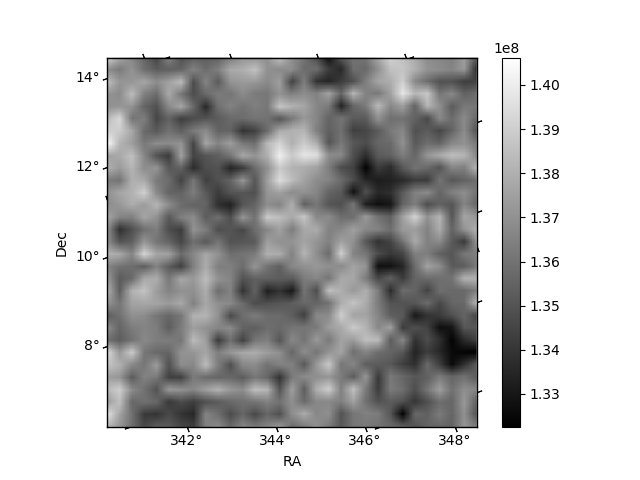
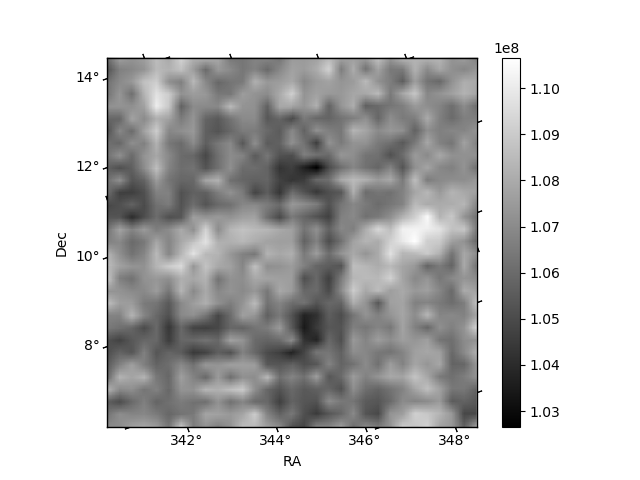
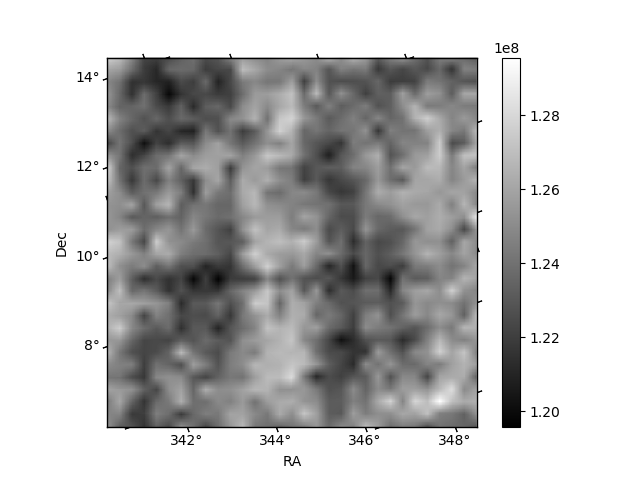
Histogram calculated using DETX and DETY for each event in the final _common_clean file
| Quadrant A | 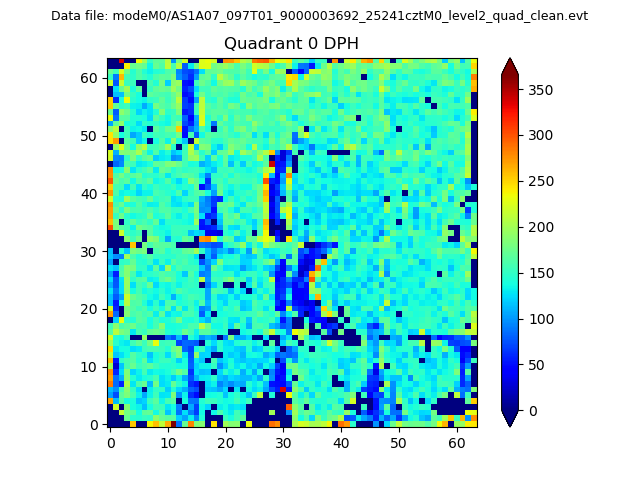 |
 |
Quadrant B |
|---|---|---|---|
| Quadrant D | 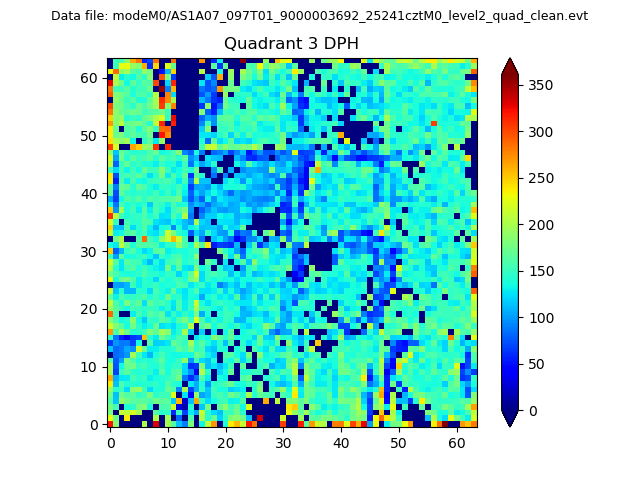 |
 |
Quadrant C |
| Plot type | Count rate plots | Images |
|---|---|---|
| Comparison with Poisson distribution Blue bars denote a histogram of data divided into 1 sec bins. Red curve is a Poisson curve with rate = median count rate of data. |
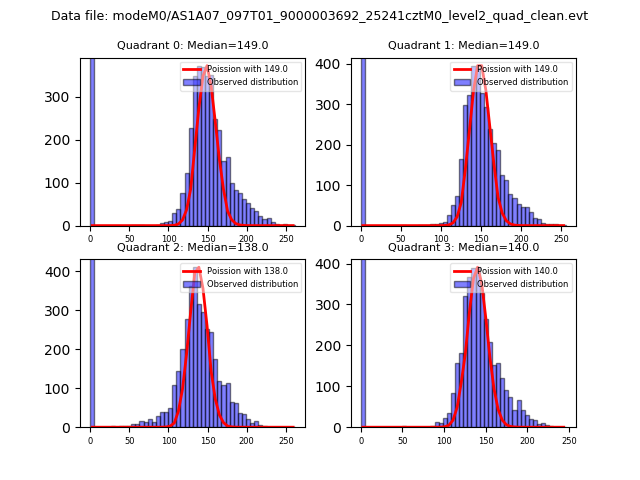 |
 |
| Quadrant-wise count rates Data is divided into 100 sec bins |
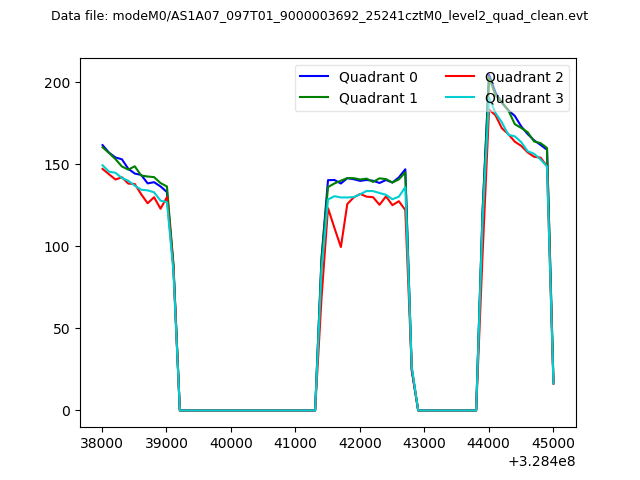 |
|
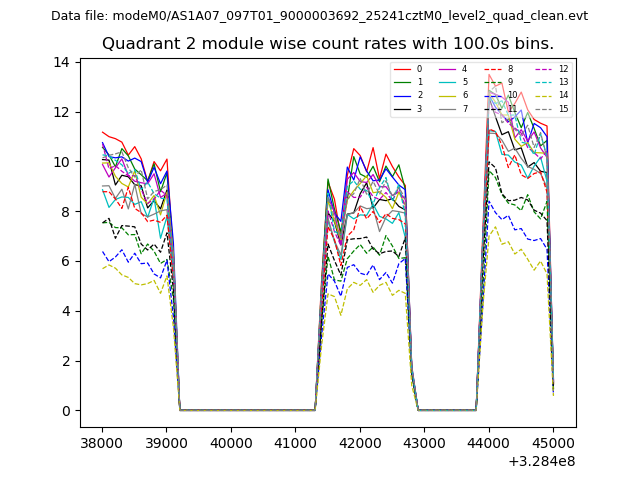
| Module-wise count rates for Quadrant A Data is divided into 100 sec bins |
 |
 |
| Module-wise count rates for Quadrant B Data is divided into 100 sec bins |
 |
 |
| Module-wise count rates for Quadrant C Data is divided into 100 sec bins |
 |
 |
| Module-wise count rates for Quadrant D Data is divided into 100 sec bins |
 |
 |
| Parameter | Plot |
|---|---|
| CZT HV Monitor | 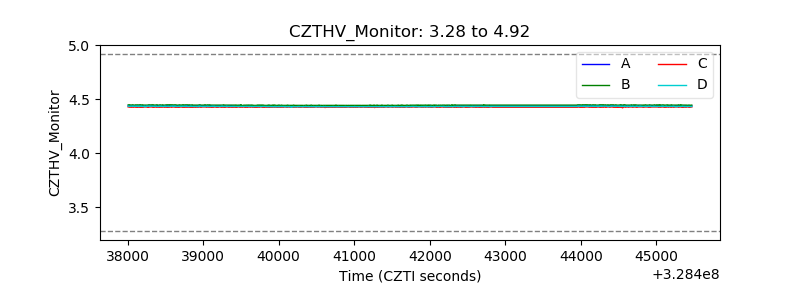 |
| D_VDD |  |
| Temperature 1 |  |
| Veto HV Monitor | 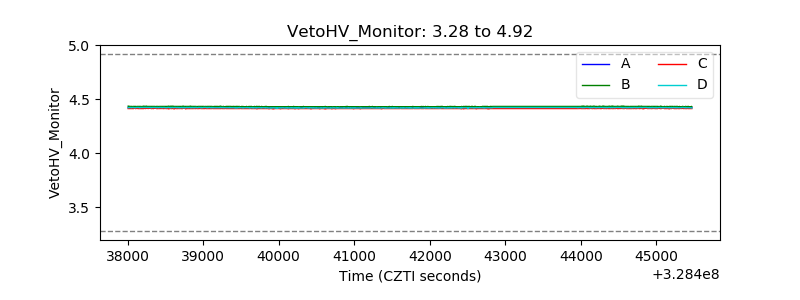 |
| Veto LLD |  |
| Alpha Counter | 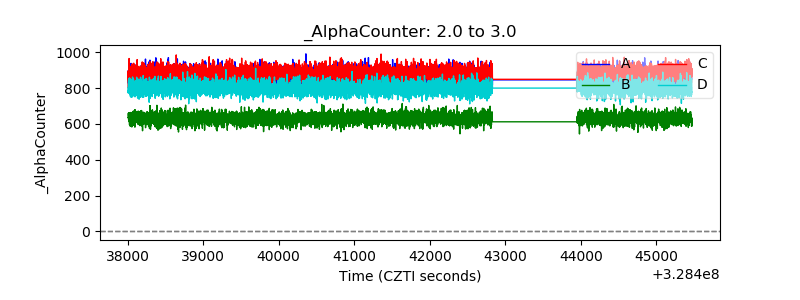 |
| _CPM_Rate | 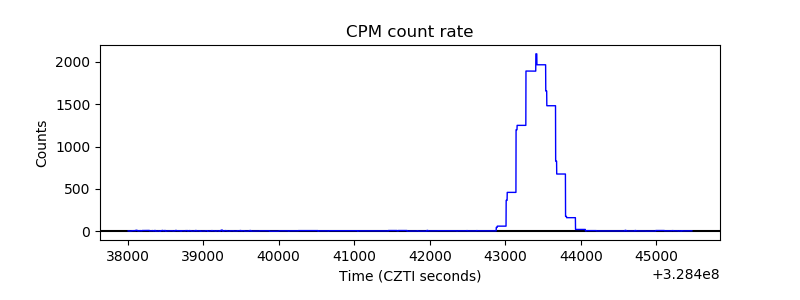 |
| CZT Counter | 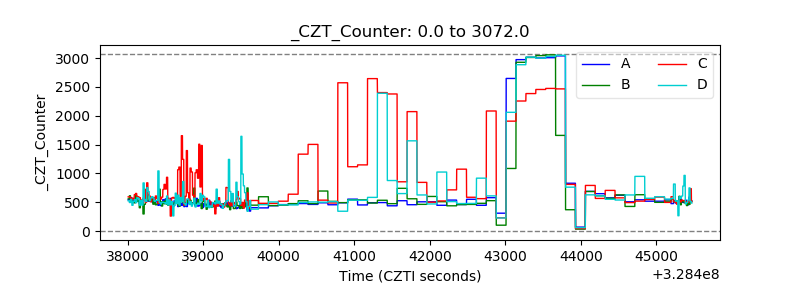 |
| +2.5 Volts monitor |  |
| +5 Volts monitor |  |
| _ROLL_ROT | 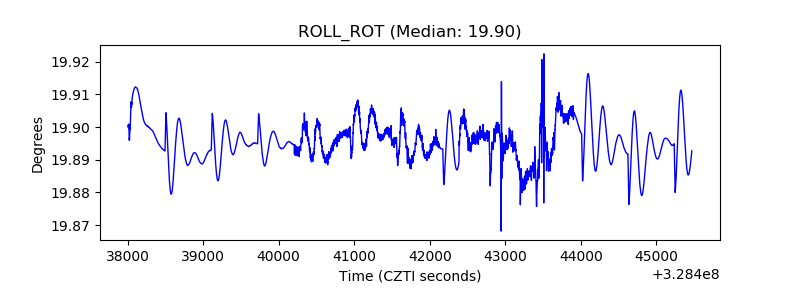 |
| _Roll_DEC | 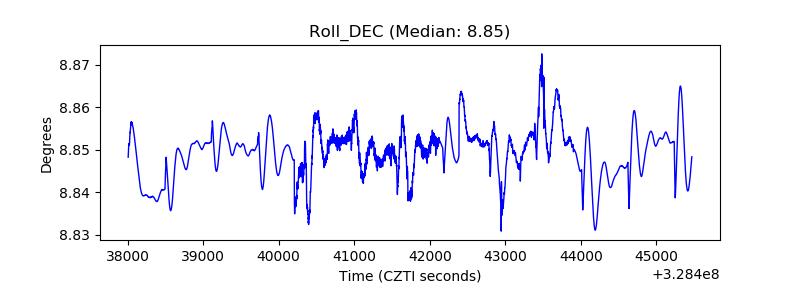 |
| _Roll_RA | 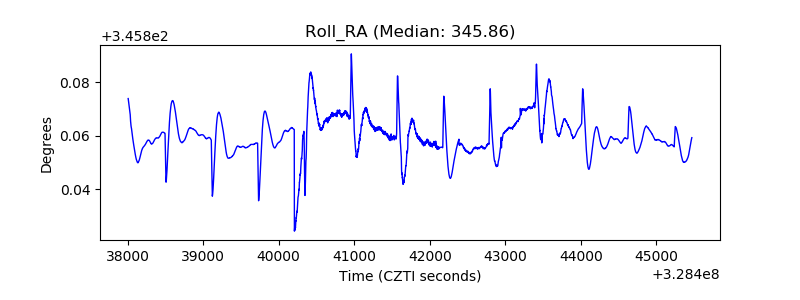 |
| Veto Counter | 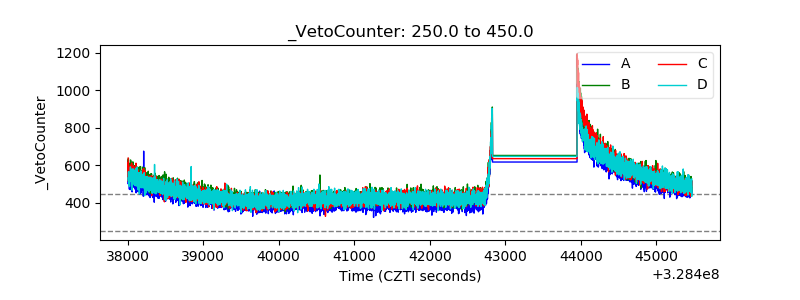 |