| Param | Original file | Final file |
|---|---|---|
| Filename | modeM0/AS1A07_097T01_9000003692_25242cztM0_level2.evt | modeM0/AS1A07_097T01_9000003692_25242cztM0_level2_quad_clean.evt |
| Size (bytes) | 432,728,640 | 50,497,920 |
| Size | 412.7 MB | 48.2 MB |
| Events in quadrant A | 2,420,816 | 322,085 |
| Events in quadrant B | 2,422,954 | 326,433 |
| Events in quadrant C | 4,830,725 | 260,545 |
| Events in quadrant D | 3,121,439 | 299,587 |
| Mode M0 | |||
|---|---|---|---|
| Quadrant | BADHDUFLAG | Total packets | Discarded packets |
| A | 0 | 9715 | 0 |
| B | 0 | 9696 | 0 |
| C | 0 | 17193 | 0 |
| D | 0 | 12381 | 0 |
| Mode M9 | |||
|---|---|---|---|
| Quadrant | BADHDUFLAG | Total packets | Discarded packets |
| A | 0 | 10 | 4 |
| B | 0 | 8 | 3 |
| C | 0 | 10 | 5 |
| D | 0 | 8 | 3 |
| Quadrant | Total seconds | Saturated seconds | Saturation percentage |
|---|---|---|---|
| A | 4529 | 51 | 1.126076% |
| B | 4546 | 56 | 1.231852% |
| C | 4520 | 1177 | 26.039823% |
| D | 4522 | 96 | 2.122954% |
Noise dominated data is calculated using 1-second bins in cleaned event files. If a bin has >2000 counts, and if more than 50% of those come from <1% of pixels, then it is considered to be noise-dominated and hence unusable.
| Quadrant | # 1 sec bins | Bins with >0 counts | Bins with >2000 counts | High rate bins dominated by noise | Noise dominated (total time) | Noise dominated (detector-on time) | Marked lightcurve |
|---|---|---|---|---|---|---|---|
| A | 7093 | 4562 | 0 | 0 | 0.00% | 0.00% | 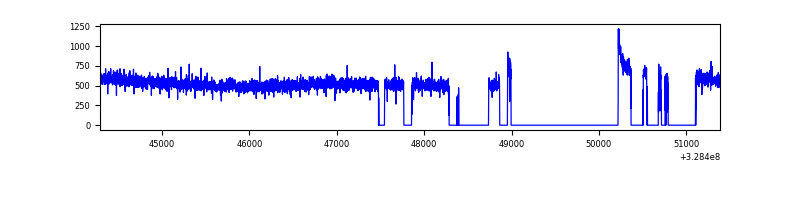 |
| B | 7095 | 4575 | 0 | 0 | 0.00% | 0.00% | 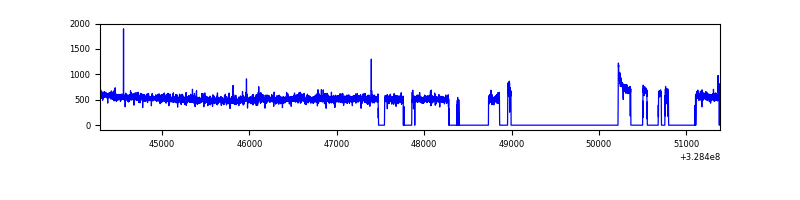 |
| C | 7092 | 4545 | 826 | 826 | 11.65% | 18.17% | 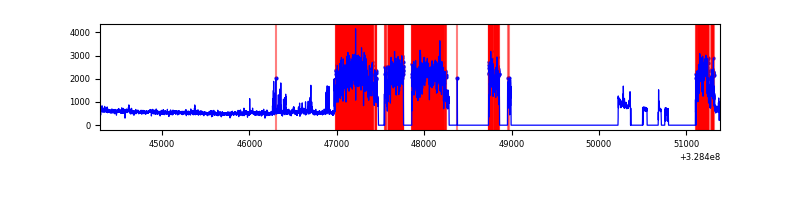 |
| D | 7094 | 4550 | 41 | 41 | 0.58% | 0.90% | 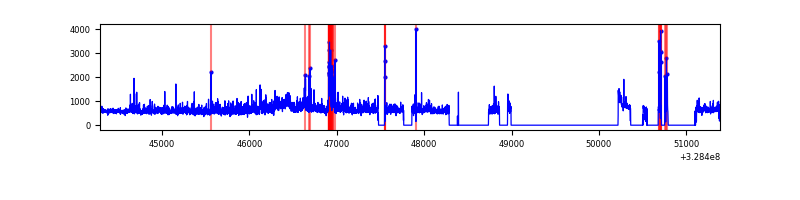 |
Top three noisy pixels from each quadrant. If the there are fewer than three noisy pixels in the level2.evt file, extra rows are filled as -1
| Pixel properties | Quadrant properties | ||||||
|---|---|---|---|---|---|---|---|
| Quadrant | DetID | PixID | Counts | Sigma | Mean | Median | Sigma |
| A | 3 | 1 | 13772 | 105.41 | 624 | 615 | 124.8 |
| A | 13 | 254 | 7472 | 54.94 | 624 | 615 | 124.8 |
| A | 0 | 226 | 5460 | 38.82 | 624 | 615 | 124.8 |
| B | 0 | 229 | 15234 | 127.2 | 610 | 597 | 115.1 |
| B | 0 | 190 | 14732 | 122.83 | 610 | 597 | 115.1 |
| B | 12 | 111 | 13694 | 113.81 | 610 | 597 | 115.1 |
| C | 0 | 239 | 2369982 | 19180.19 | 531 | 535 | 123.5 |
| C | 2 | 16 | 155788 | 1256.74 | 531 | 535 | 123.5 |
| C | 7 | 247 | 135724 | 1094.33 | 531 | 535 | 123.5 |
| D | 8 | 195 | 361001 | 2463.03 | 599 | 584 | 146.3 |
| D | 10 | 70 | 151288 | 1029.88 | 599 | 584 | 146.3 |
| D | 1 | 239 | 94118 | 639.2 | 599 | 584 | 146.3 |
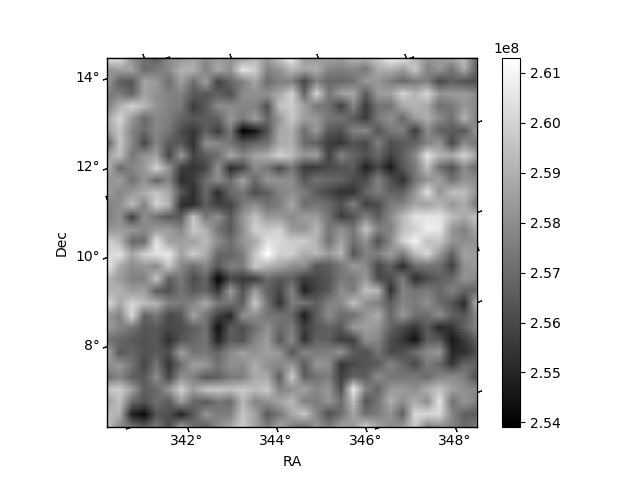
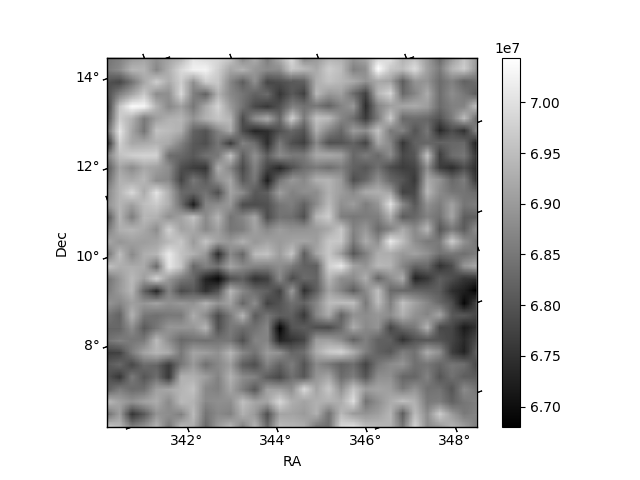
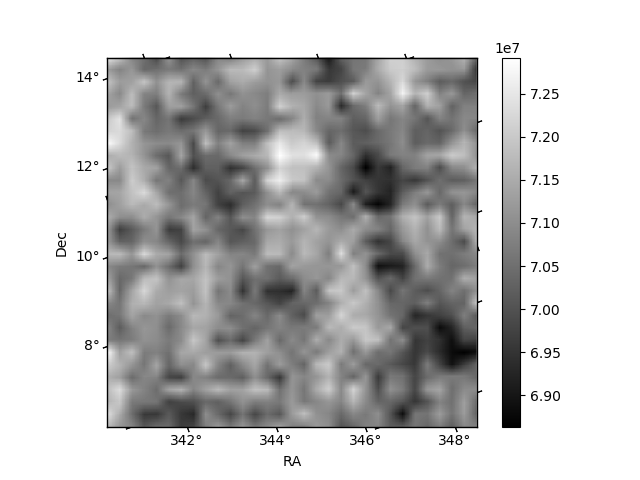
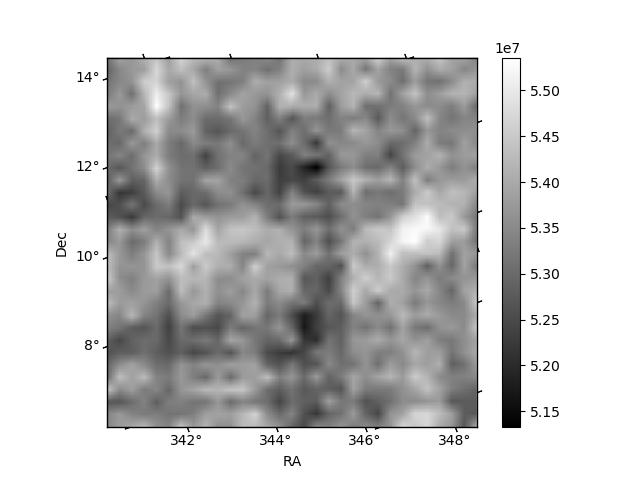
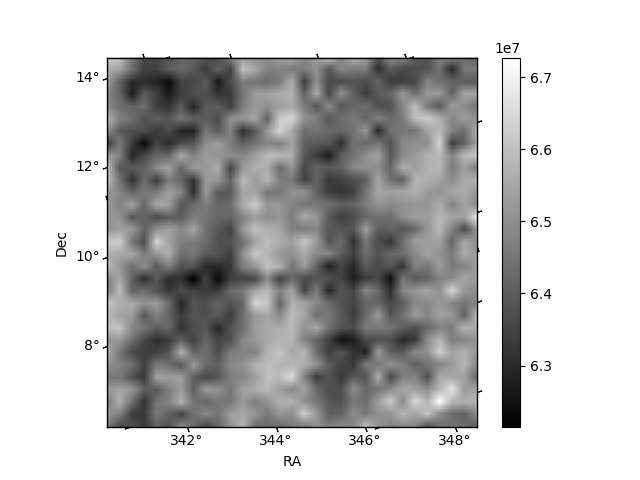
Histogram calculated using DETX and DETY for each event in the final _common_clean file
| Quadrant A | 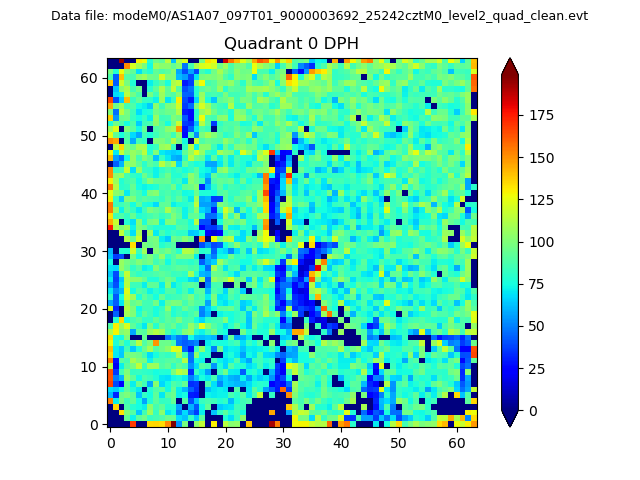 |
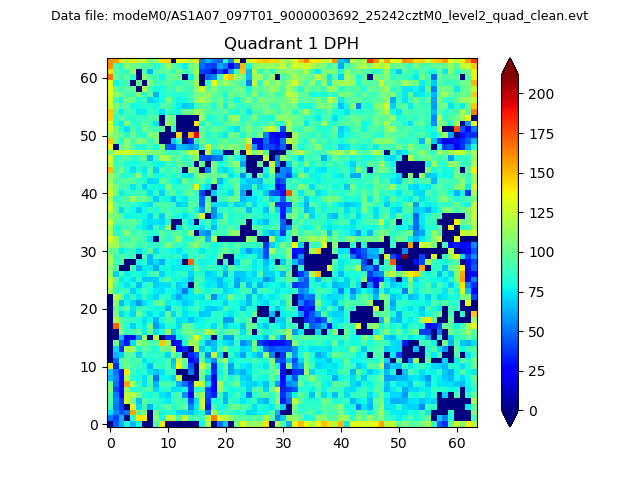 |
Quadrant B |
|---|---|---|---|
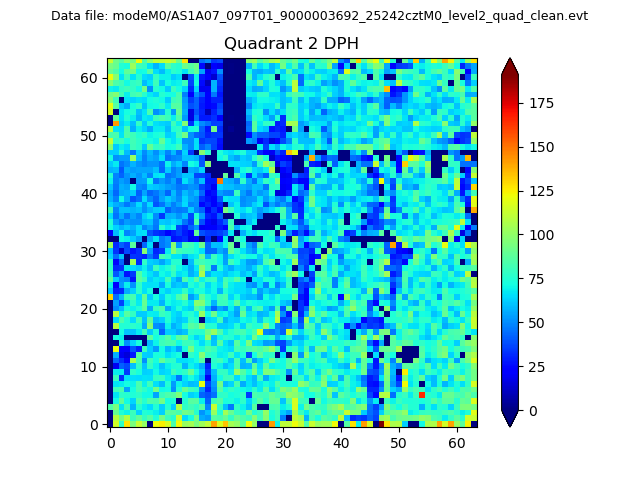
| Quadrant D | 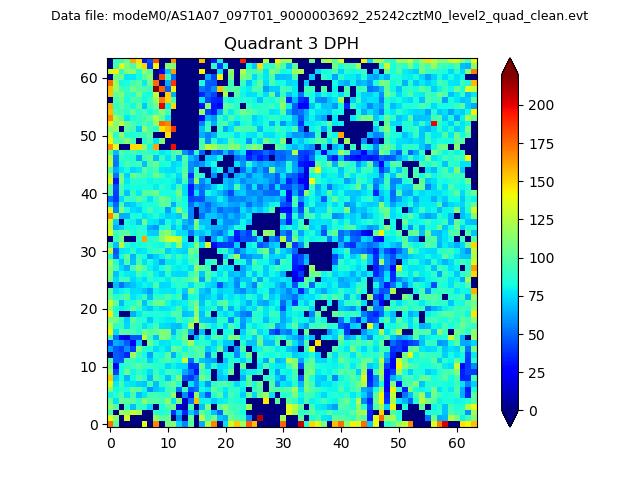 |
 |
Quadrant C |
| Plot type | Count rate plots | Images |
|---|---|---|
| Comparison with Poisson distribution Blue bars denote a histogram of data divided into 1 sec bins. Red curve is a Poisson curve with rate = median count rate of data. |
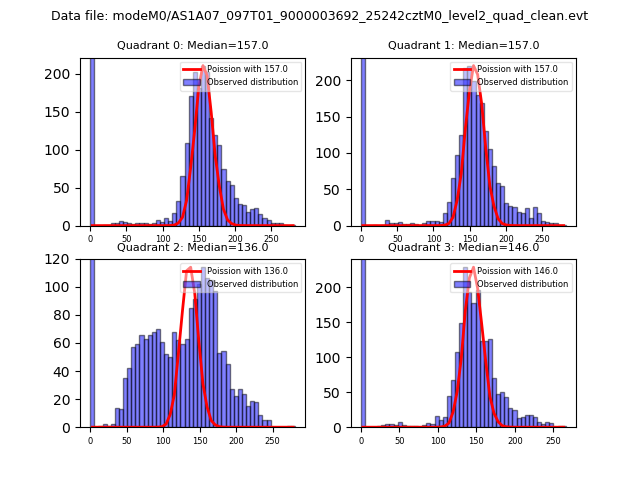 |
 |
| Quadrant-wise count rates Data is divided into 100 sec bins |
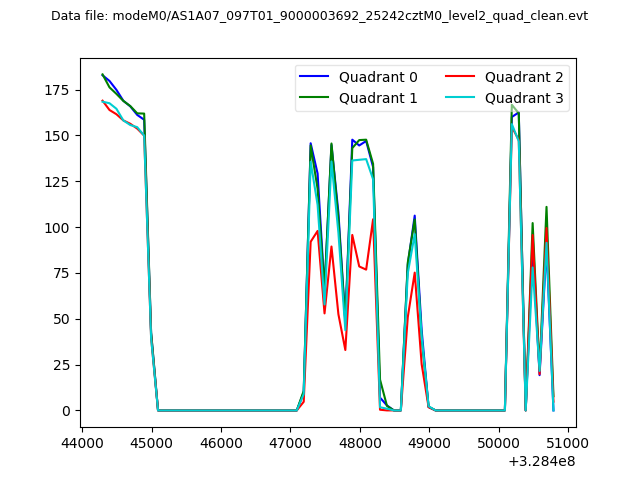 |
|
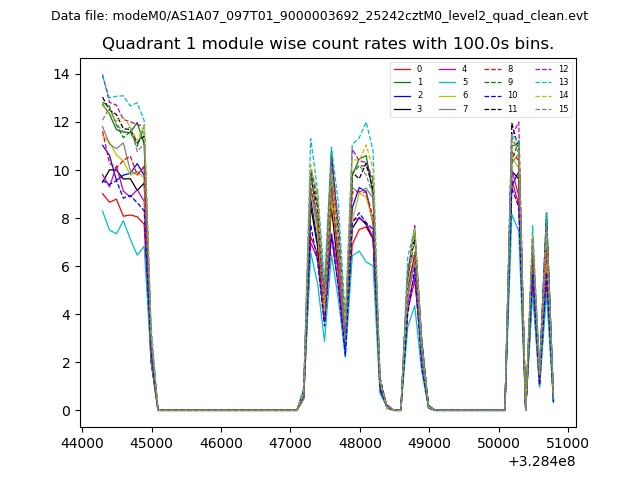
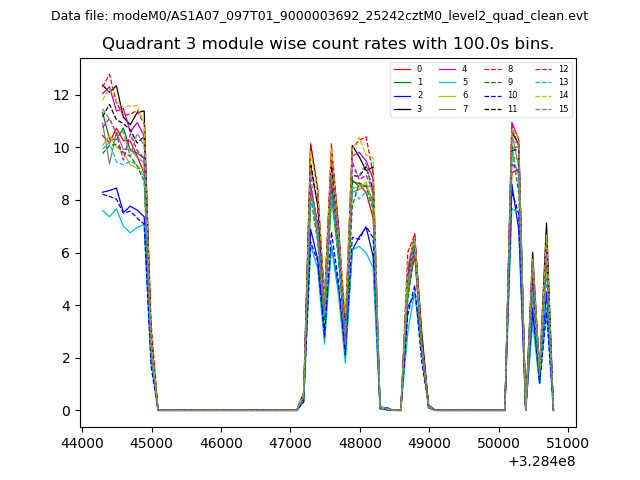
| Module-wise count rates for Quadrant A Data is divided into 100 sec bins |
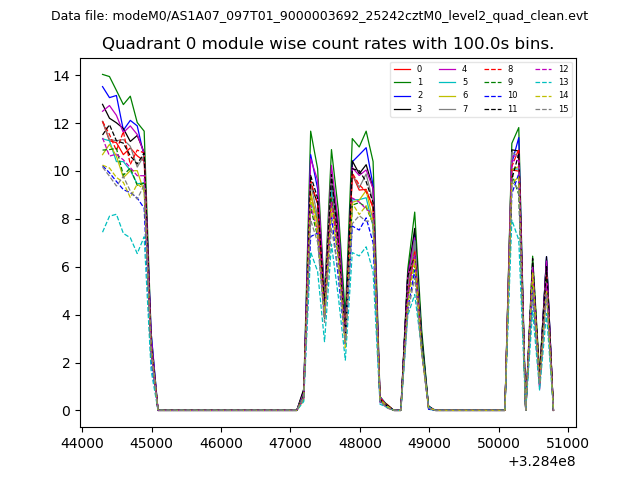 |
 |
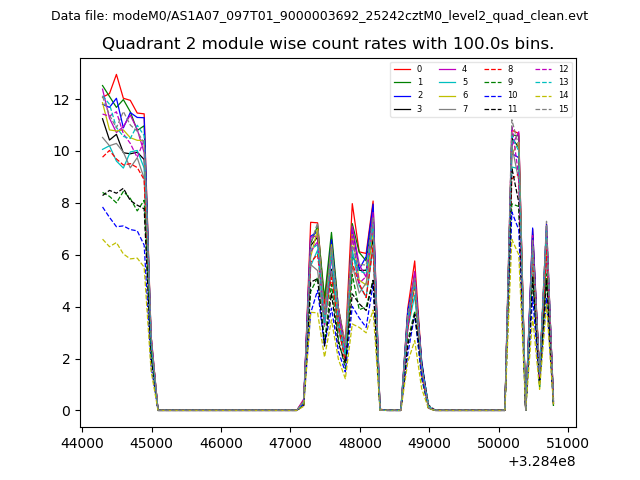
| Module-wise count rates for Quadrant B Data is divided into 100 sec bins |
 |
 |
| Module-wise count rates for Quadrant C Data is divided into 100 sec bins |
 |
 |
| Module-wise count rates for Quadrant D Data is divided into 100 sec bins |
 |
 |
| Parameter | Plot |
|---|---|
| CZT HV Monitor | 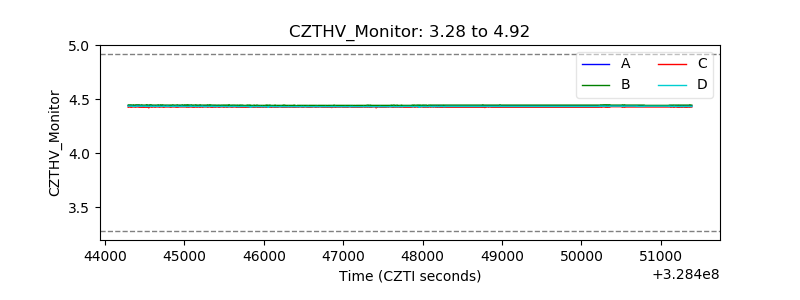 |
| D_VDD | 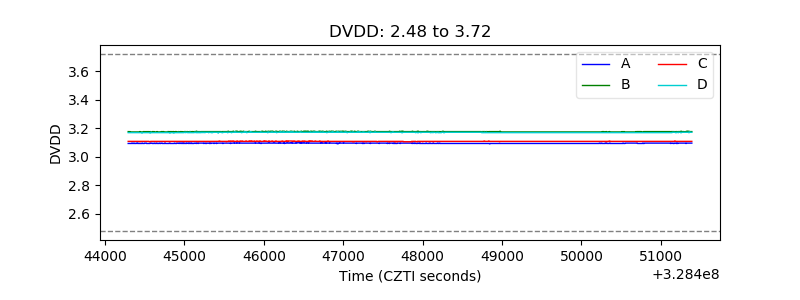 |
| Temperature 1 | 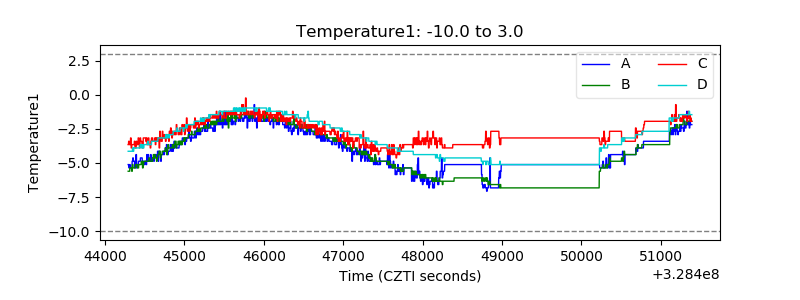 |
| Veto HV Monitor | 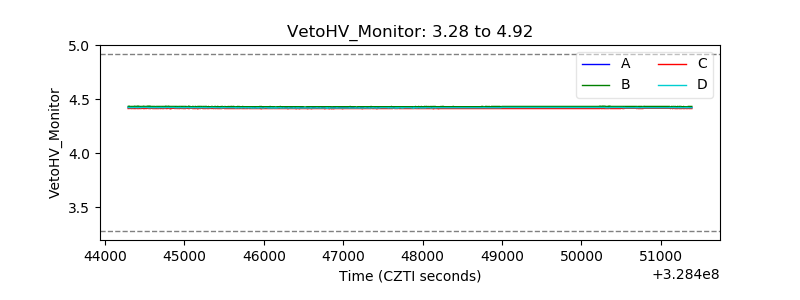 |
| Veto LLD | 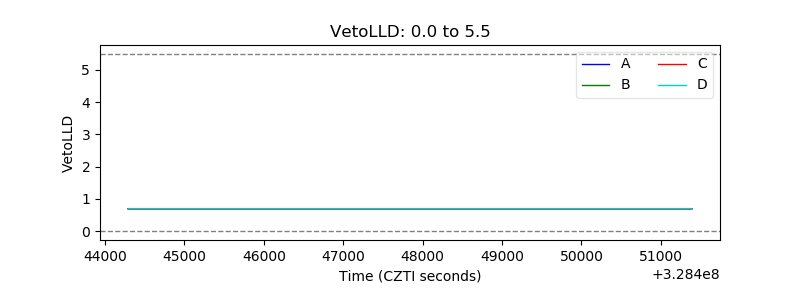 |
| Alpha Counter | 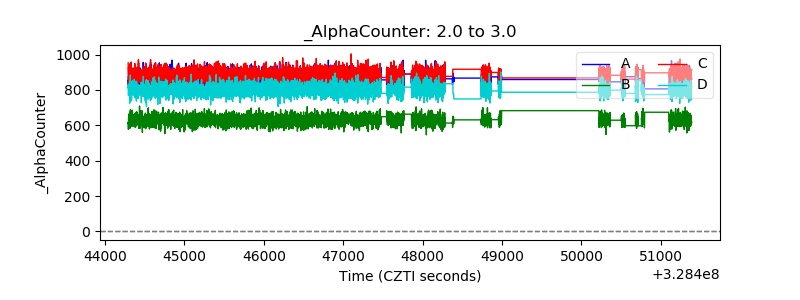 |
| _CPM_Rate | 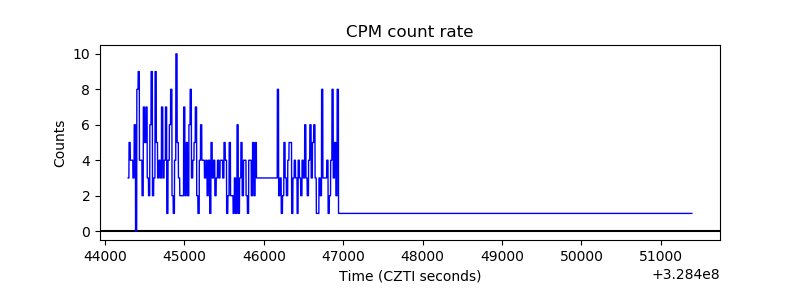 |
| CZT Counter | 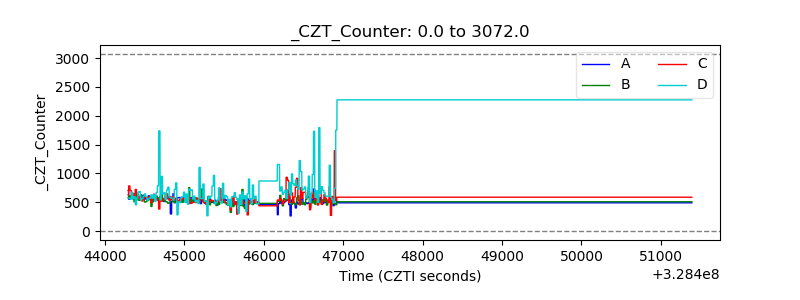 |
| +2.5 Volts monitor |  |
| +5 Volts monitor |  |
| _ROLL_ROT | 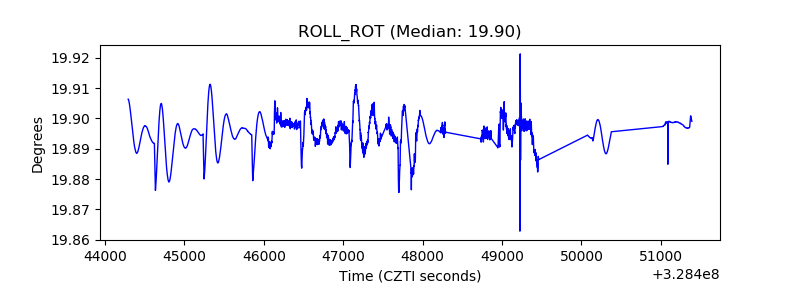 |
| _Roll_DEC | 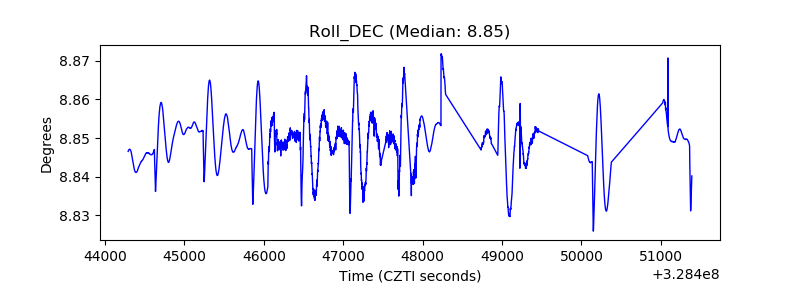 |
| _Roll_RA | 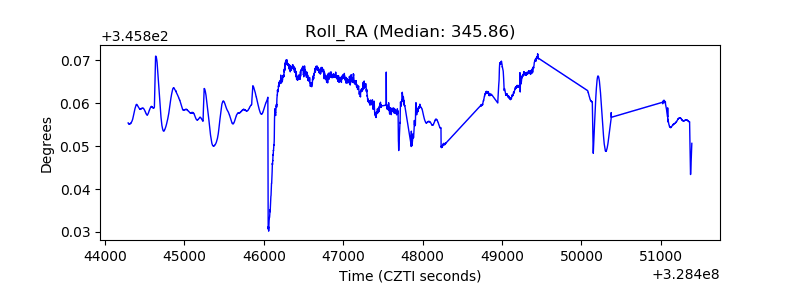 |
| Veto Counter | 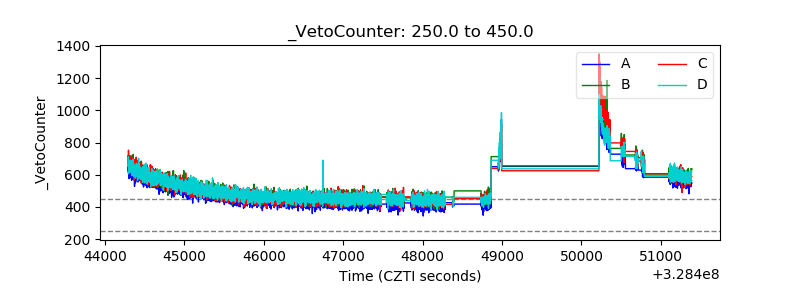 |