| Param | Original file | Final file |
|---|---|---|
| Filename | modeM0/AS1A07_097T01_9000003692_25243cztM0_level2.evt | modeM0/AS1A07_097T01_9000003692_25243cztM0_level2_quad_clean.evt |
| Size (bytes) | 553,717,440 | 64,895,040 |
| Size | 528.1 MB | 61.9 MB |
| Events in quadrant A | 3,421,543 | 399,692 |
| Events in quadrant B | 3,442,442 | 401,535 |
| Events in quadrant C | 4,376,940 | 376,014 |
| Events in quadrant D | 5,119,419 | 365,469 |
| Mode M0 | |||
|---|---|---|---|
| Quadrant | BADHDUFLAG | Total packets | Discarded packets |
| A | 0 | 13882 | 0 |
| B | 0 | 13830 | 0 |
| C | 0 | 17103 | 0 |
| D | 0 | 19611 | 0 |
| Mode M9 | |||
|---|---|---|---|
| Quadrant | BADHDUFLAG | Total packets | Discarded packets |
| A | 0 | 13 | 0 |
| B | 0 | 13 | 0 |
| C | 0 | 13 | 0 |
| D | 0 | 13 | 0 |
| Quadrant | Total seconds | Saturated seconds | Saturation percentage |
|---|---|---|---|
| A | 6039 | 62 | 1.026660% |
| B | 6039 | 72 | 1.192250% |
| C | 6039 | 339 | 5.613512% |
| D | 6040 | 296 | 4.900662% |
Noise dominated data is calculated using 1-second bins in cleaned event files. If a bin has >2000 counts, and if more than 50% of those come from <1% of pixels, then it is considered to be noise-dominated and hence unusable.
| Quadrant | # 1 sec bins | Bins with >0 counts | Bins with >2000 counts | High rate bins dominated by noise | Noise dominated (total time) | Noise dominated (detector-on time) | Marked lightcurve |
|---|---|---|---|---|---|---|---|
| A | 7354 | 6040 | 0 | 0 | 0.00% | 0.00% | 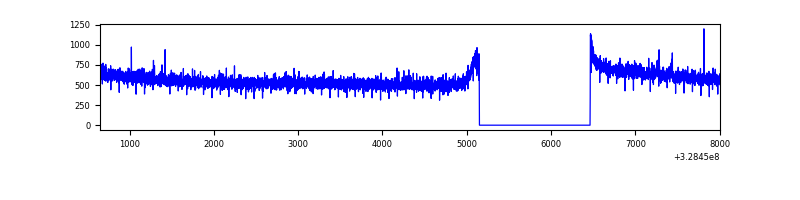 |
| B | 7354 | 6040 | 0 | 0 | 0.00% | 0.00% | 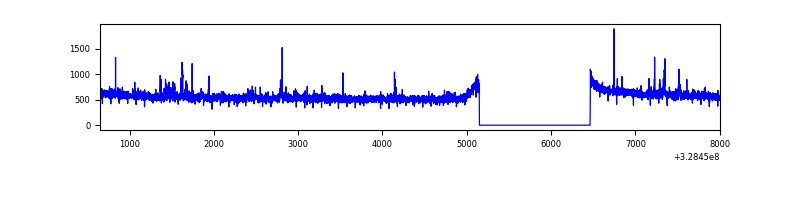 |
| C | 7354 | 6040 | 185 | 185 | 2.52% | 3.06% | 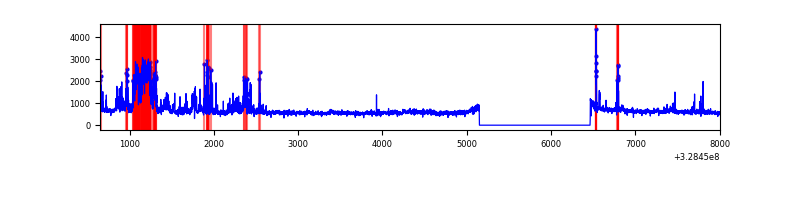 |
| D | 7355 | 6041 | 145 | 145 | 1.97% | 2.40% | 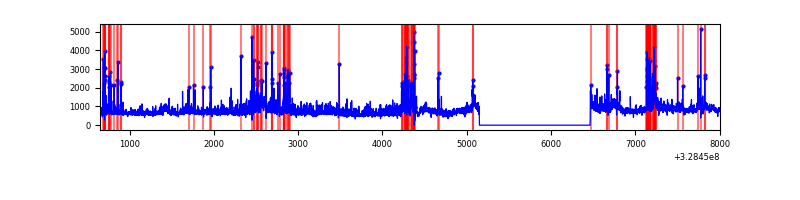 |
Top three noisy pixels from each quadrant. If the there are fewer than three noisy pixels in the level2.evt file, extra rows are filled as -1
| Pixel properties | Quadrant properties | ||||||
|---|---|---|---|---|---|---|---|
| Quadrant | DetID | PixID | Counts | Sigma | Mean | Median | Sigma |
| A | 6 | 16 | 21346 | 118.11 | 880 | 866 | 173.4 |
| A | 13 | 254 | 10086 | 53.17 | 880 | 866 | 173.4 |
| A | 0 | 226 | 7889 | 40.5 | 880 | 866 | 173.4 |
| B | 0 | 190 | 58998 | 360.32 | 859 | 842 | 161.4 |
| B | 12 | 111 | 18229 | 107.72 | 859 | 842 | 161.4 |
| B | 11 | 111 | 16431 | 96.59 | 859 | 842 | 161.4 |
| C | 0 | 239 | 568154 | 3022.67 | 814 | 820 | 187.7 |
| C | 2 | 16 | 301033 | 1599.49 | 814 | 820 | 187.7 |
| C | 7 | 247 | 190399 | 1010.05 | 814 | 820 | 187.7 |
| D | 8 | 195 | 756607 | 3759.23 | 838 | 814 | 201.0 |
| D | 10 | 70 | 480841 | 2387.6 | 838 | 814 | 201.0 |
| D | 1 | 52 | 282235 | 1399.76 | 838 | 814 | 201.0 |
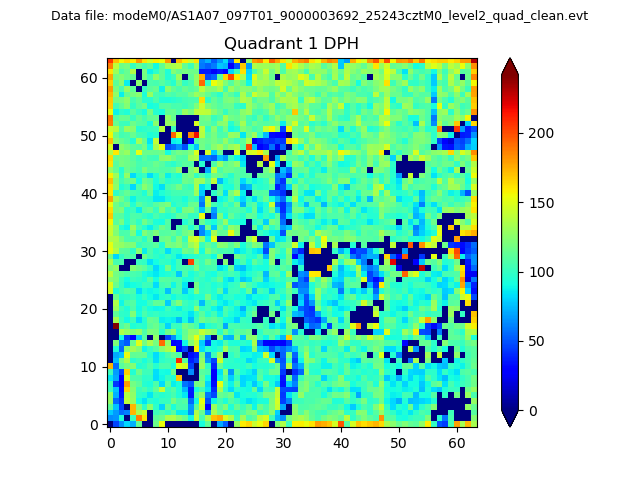
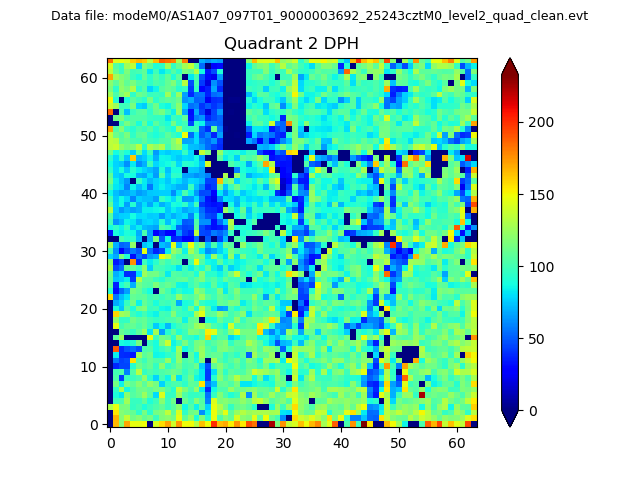
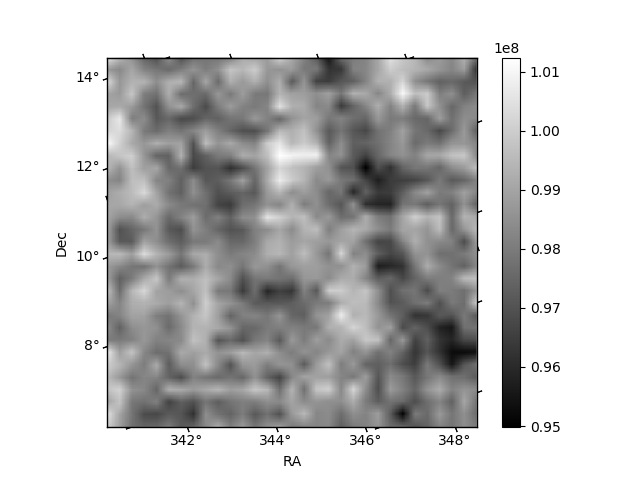
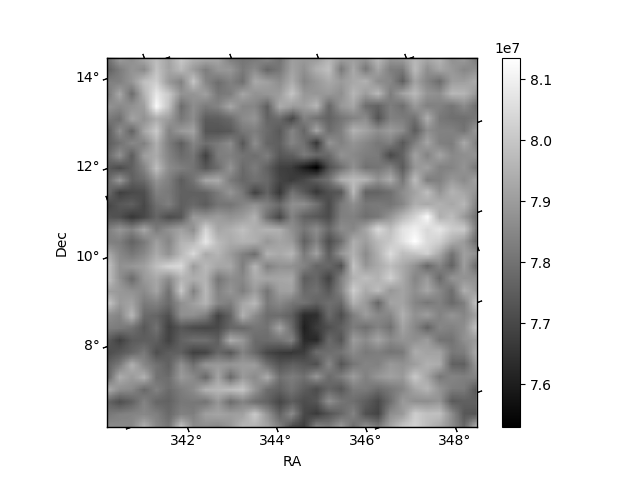
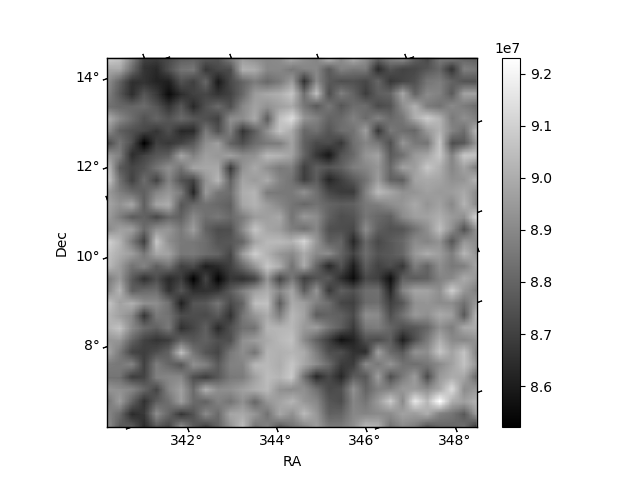
Histogram calculated using DETX and DETY for each event in the final _common_clean file
| Quadrant A |  |
 |
Quadrant B |
|---|---|---|---|
| Quadrant D |  |
 |
Quadrant C |
| Plot type | Count rate plots | Images |
|---|---|---|
| Comparison with Poisson distribution Blue bars denote a histogram of data divided into 1 sec bins. Red curve is a Poisson curve with rate = median count rate of data. |
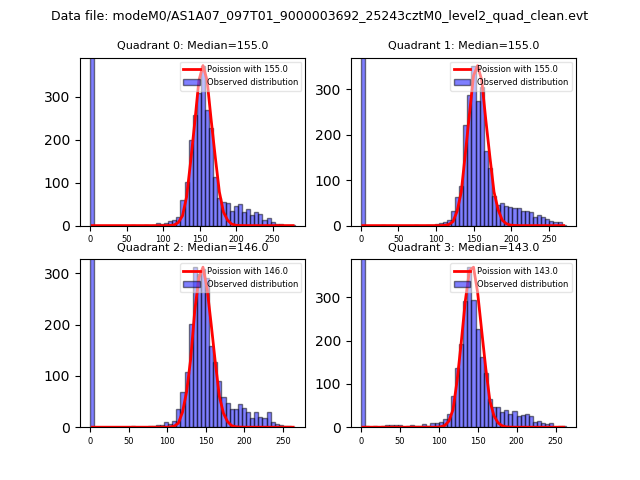 |
 |
| Quadrant-wise count rates Data is divided into 100 sec bins |
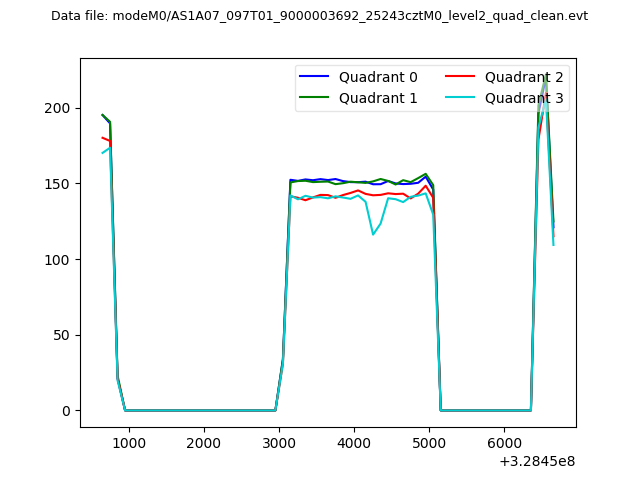 |
|
| Module-wise count rates for Quadrant A Data is divided into 100 sec bins |
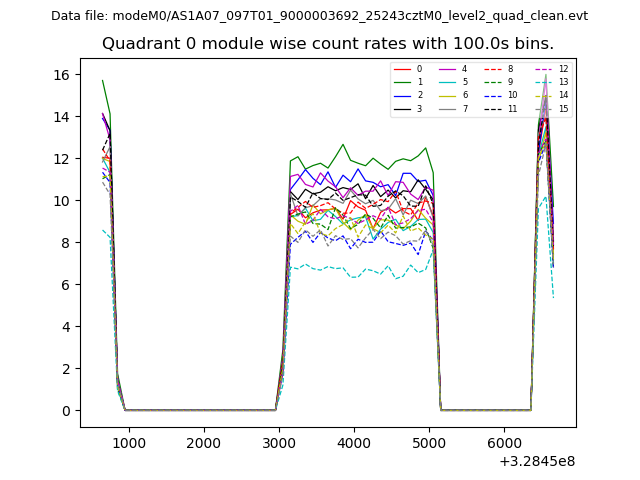 |
 |
| Module-wise count rates for Quadrant B Data is divided into 100 sec bins |
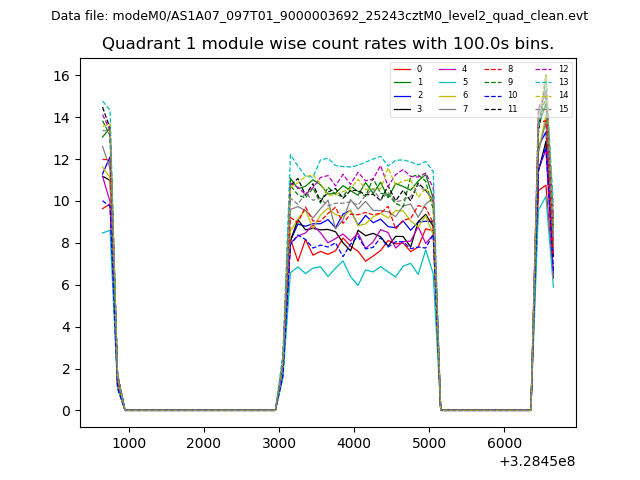 |
 |
| Module-wise count rates for Quadrant C Data is divided into 100 sec bins |
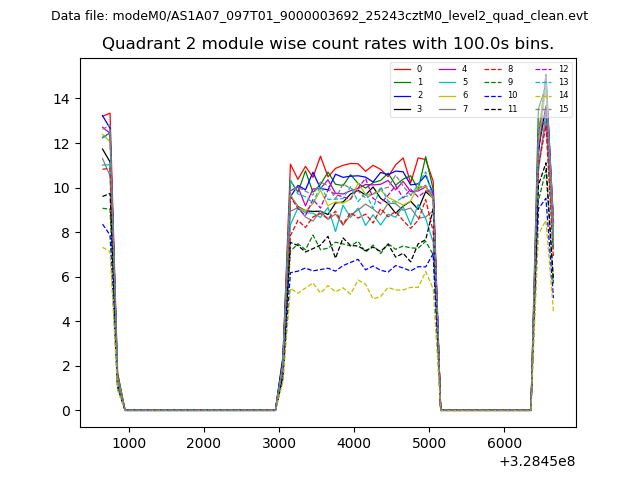 |
 |
| Module-wise count rates for Quadrant D Data is divided into 100 sec bins |
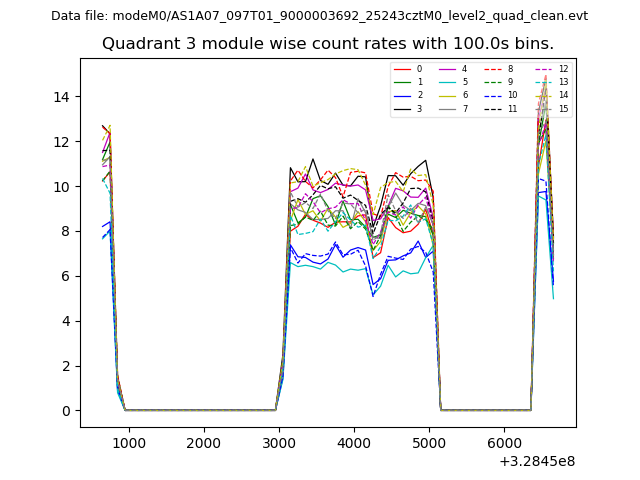 |
 |
| Parameter | Plot |
|---|---|
| CZT HV Monitor | 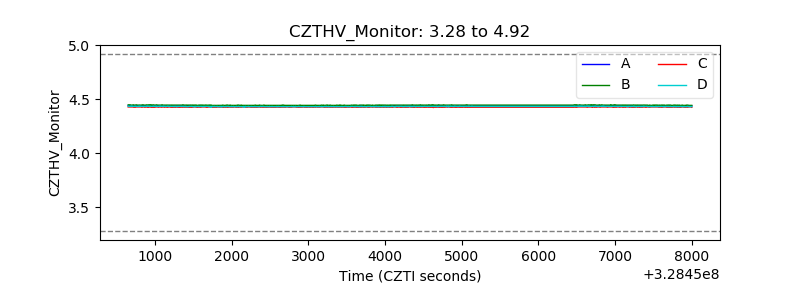 |
| D_VDD | 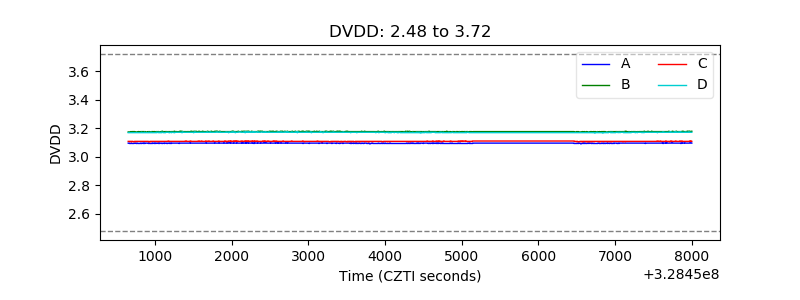 |
| Temperature 1 | 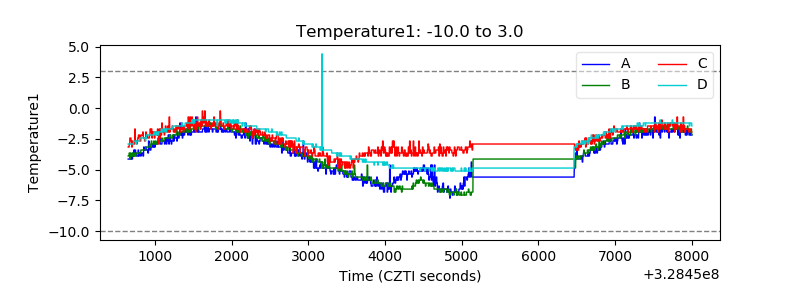 |
| Veto HV Monitor | 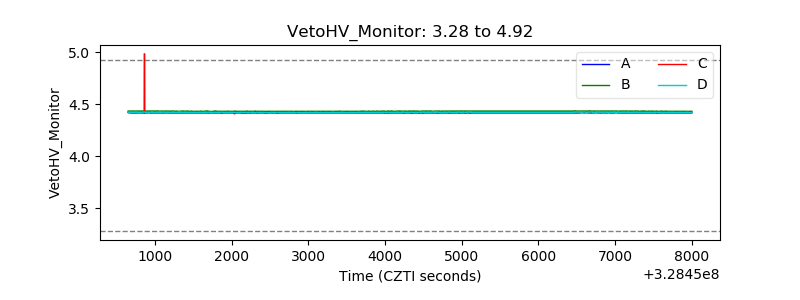 |
| Veto LLD | 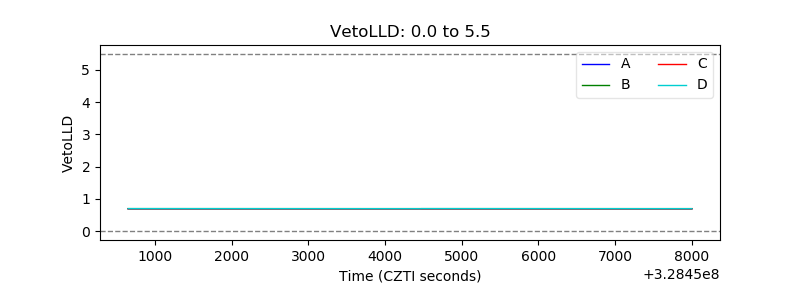 |
| Alpha Counter | 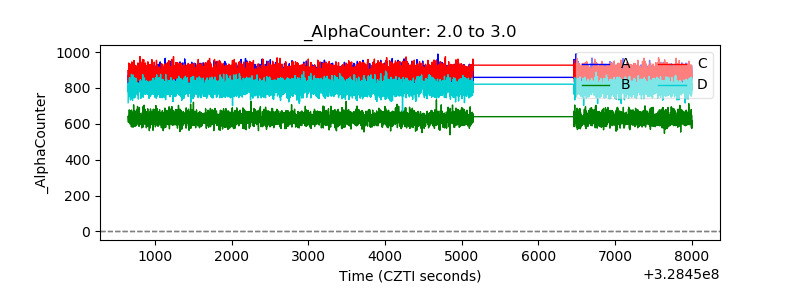 |
| _CPM_Rate | 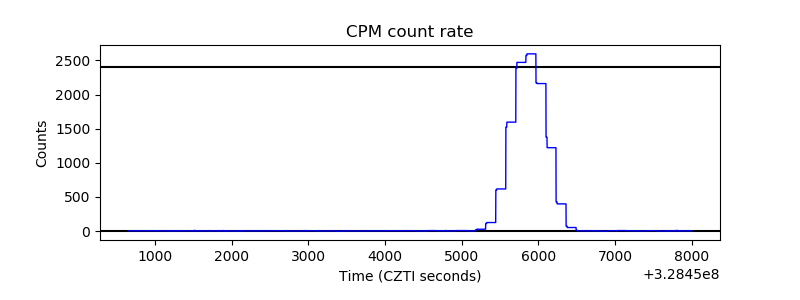 |
| CZT Counter |  |
| +2.5 Volts monitor |  |
| +5 Volts monitor | 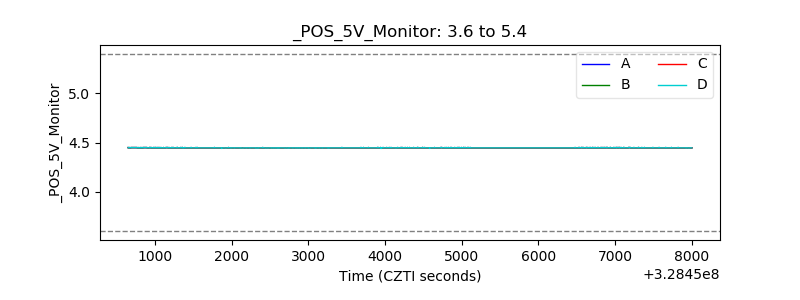 |
| _ROLL_ROT | 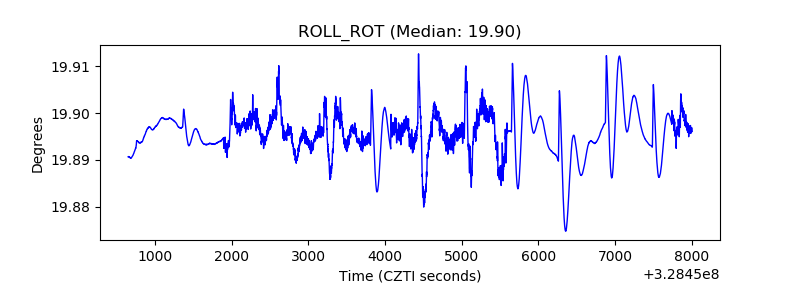 |
| _Roll_DEC | 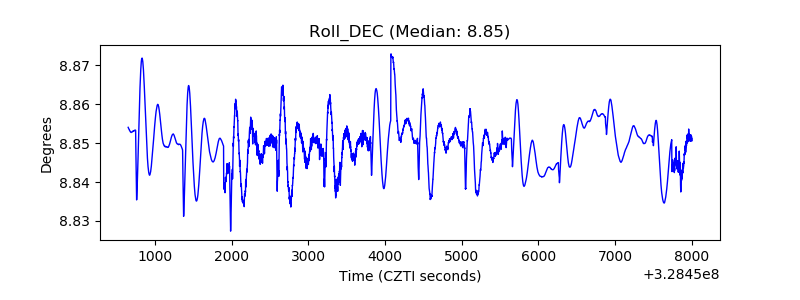 |
| _Roll_RA | 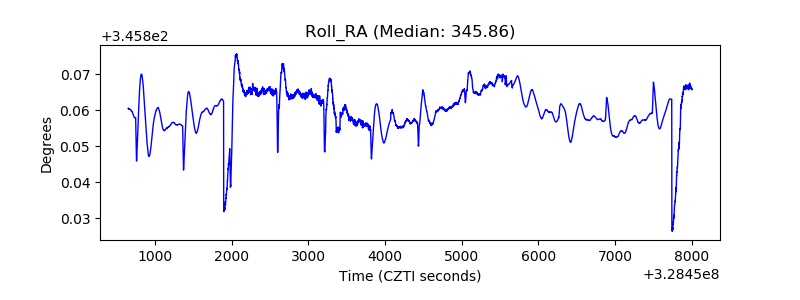 |
| Veto Counter | 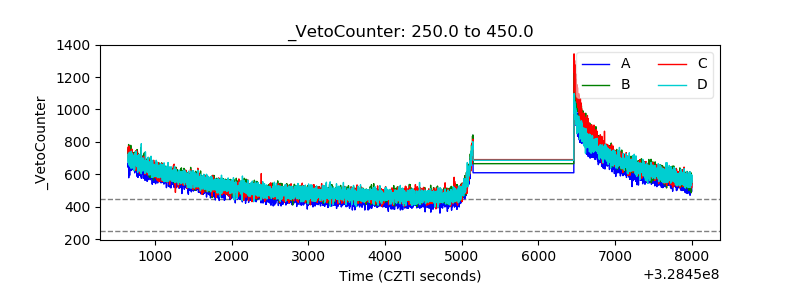 |