| Param | Original file | Final file |
|---|---|---|
| Filename | modeM0/AS1A07_097T01_9000003692_25244cztM0_level2.evt | modeM0/AS1A07_097T01_9000003692_25244cztM0_level2_quad_clean.evt |
| Size (bytes) | 591,134,400 | 65,632,320 |
| Size | 563.7 MB | 62.6 MB |
| Events in quadrant A | 3,622,722 | 399,108 |
| Events in quadrant B | 3,631,119 | 399,343 |
| Events in quadrant C | 4,848,000 | 379,544 |
| Events in quadrant D | 5,374,712 | 369,838 |
| Mode M0 | |||
|---|---|---|---|
| Quadrant | BADHDUFLAG | Total packets | Discarded packets |
| A | 0 | 14783 | 0 |
| B | 0 | 14718 | 0 |
| C | 0 | 18651 | 0 |
| D | 0 | 20589 | 0 |
| Mode M9 | |||
|---|---|---|---|
| Quadrant | BADHDUFLAG | Total packets | Discarded packets |
| A | 0 | 13 | 0 |
| B | 0 | 13 | 0 |
| C | 0 | 13 | 0 |
| D | 0 | 13 | 0 |
| Quadrant | Total seconds | Saturated seconds | Saturation percentage |
|---|---|---|---|
| A | 6286 | 99 | 1.574928% |
| B | 6287 | 121 | 1.924606% |
| C | 6287 | 686 | 10.911404% |
| D | 6287 | 271 | 4.310482% |
Noise dominated data is calculated using 1-second bins in cleaned event files. If a bin has >2000 counts, and if more than 50% of those come from <1% of pixels, then it is considered to be noise-dominated and hence unusable.
| Quadrant | # 1 sec bins | Bins with >0 counts | Bins with >2000 counts | High rate bins dominated by noise | Noise dominated (total time) | Noise dominated (detector-on time) | Marked lightcurve |
|---|---|---|---|---|---|---|---|
| A | 7611 | 6287 | 0 | 0 | 0.00% | 0.00% |  |
| B | 7612 | 6288 | 1 | 1 | 0.01% | 0.02% |  |
| C | 7612 | 6288 | 440 | 440 | 5.78% | 7.00% |  |
| D | 7612 | 6288 | 133 | 133 | 1.75% | 2.12% |  |
Top three noisy pixels from each quadrant. If the there are fewer than three noisy pixels in the level2.evt file, extra rows are filled as -1
| Pixel properties | Quadrant properties | ||||||
|---|---|---|---|---|---|---|---|
| Quadrant | DetID | PixID | Counts | Sigma | Mean | Median | Sigma |
| A | 6 | 16 | 21245 | 110.82 | 930 | 912 | 183.5 |
| A | 3 | 1 | 18266 | 94.58 | 930 | 912 | 183.5 |
| A | 13 | 254 | 9822 | 48.56 | 930 | 912 | 183.5 |
| B | 0 | 190 | 49643 | 284.95 | 912 | 894 | 171.1 |
| B | 12 | 111 | 19303 | 107.6 | 912 | 894 | 171.1 |
| B | 11 | 111 | 17557 | 97.4 | 912 | 894 | 171.1 |
| C | 0 | 239 | 1149508 | 5862.36 | 848 | 856 | 195.9 |
| C | 2 | 16 | 175101 | 889.29 | 848 | 856 | 195.9 |
| C | 14 | 238 | 138555 | 702.77 | 848 | 856 | 195.9 |
| D | 8 | 195 | 1144027 | 5373.84 | 894 | 872 | 212.7 |
| D | 10 | 70 | 406653 | 1907.53 | 894 | 872 | 212.7 |
| D | 2 | 244 | 145435 | 679.57 | 894 | 872 | 212.7 |
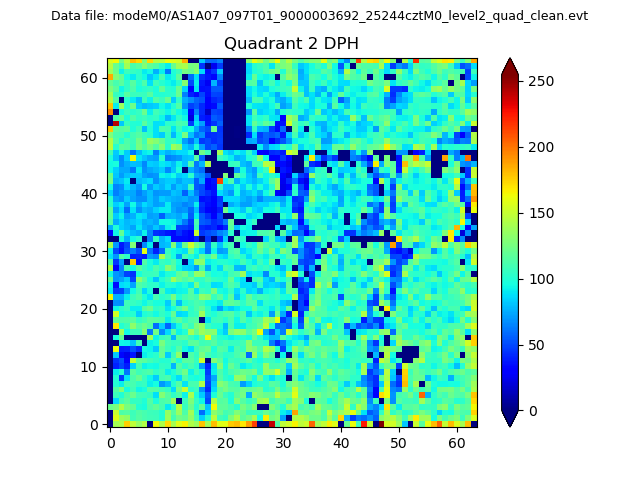
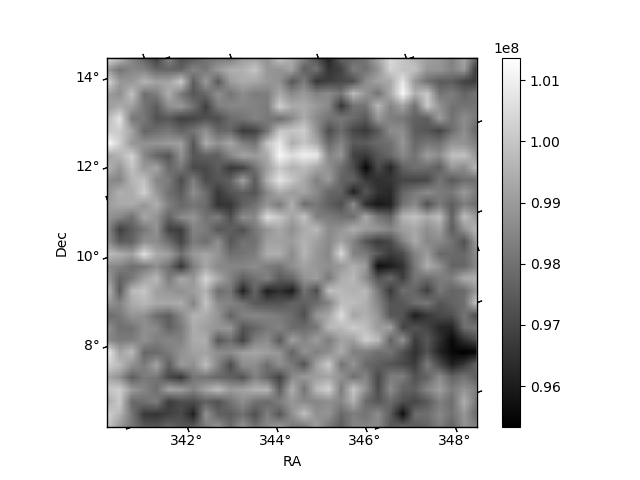
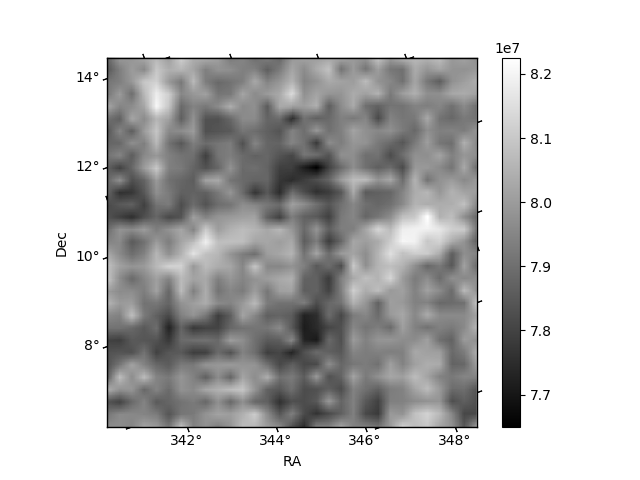
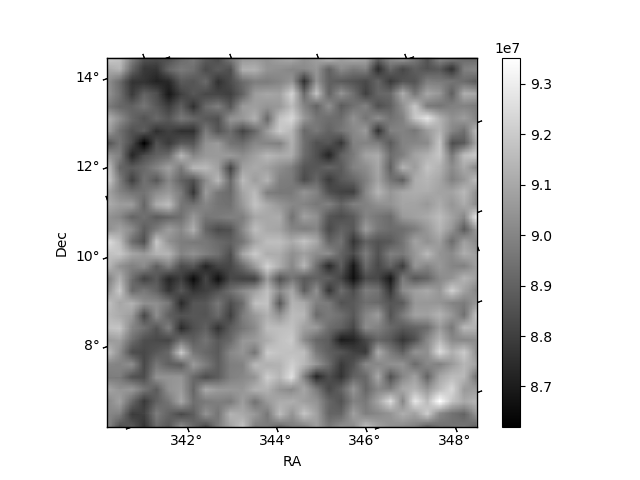
Histogram calculated using DETX and DETY for each event in the final _common_clean file
| Quadrant A | 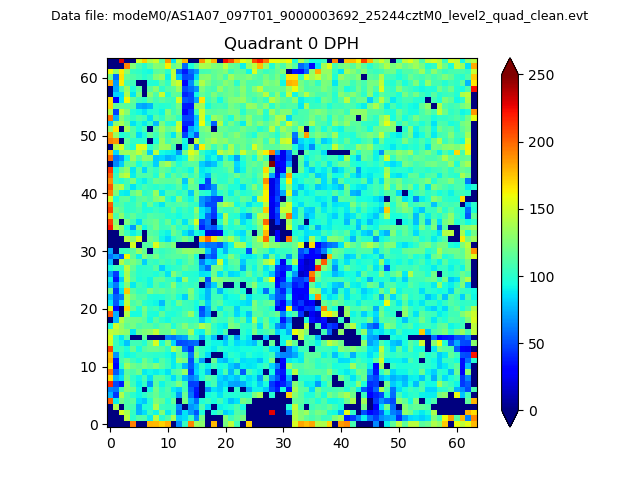 |
 |
Quadrant B |
|---|---|---|---|
| Quadrant D | 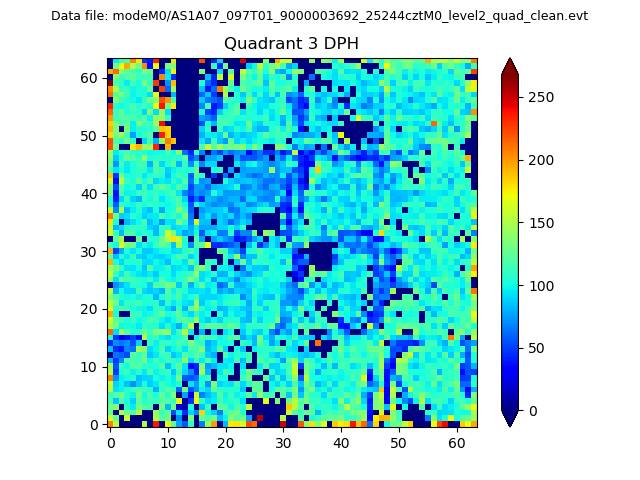 |
 |
Quadrant C |
| Plot type | Count rate plots | Images |
|---|---|---|
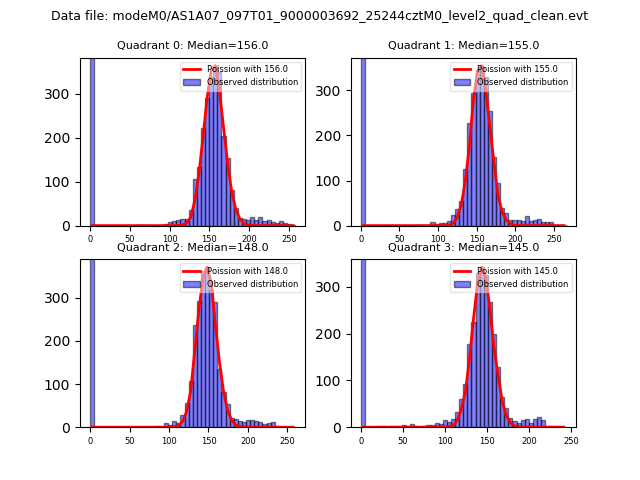
| Comparison with Poisson distribution Blue bars denote a histogram of data divided into 1 sec bins. Red curve is a Poisson curve with rate = median count rate of data. |
 |
 |
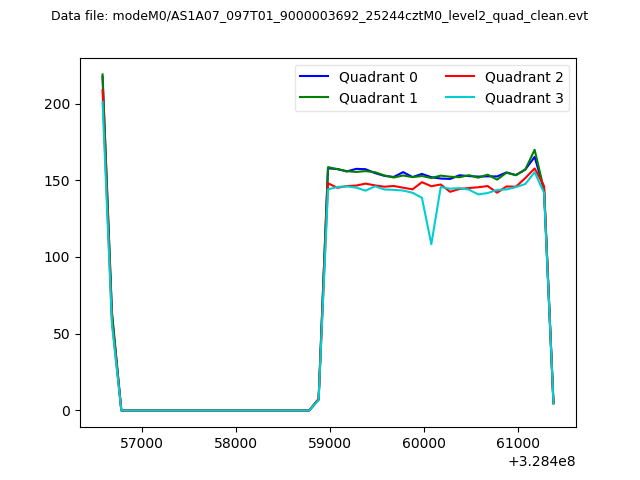
| Quadrant-wise count rates Data is divided into 100 sec bins |
 |
|
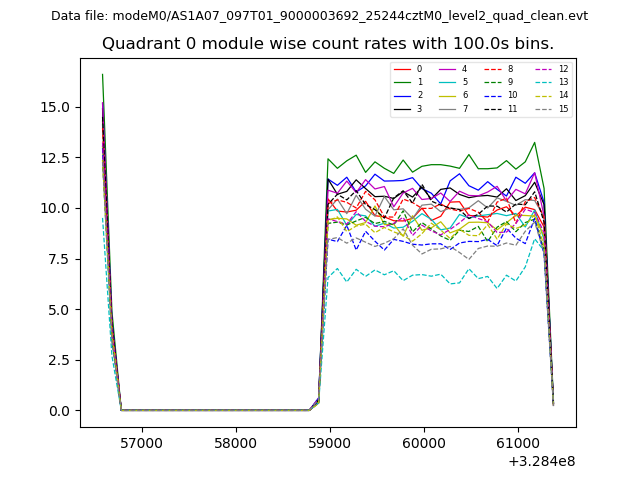
| Module-wise count rates for Quadrant A Data is divided into 100 sec bins |
 |
 |
| Module-wise count rates for Quadrant B Data is divided into 100 sec bins |
 |
 |
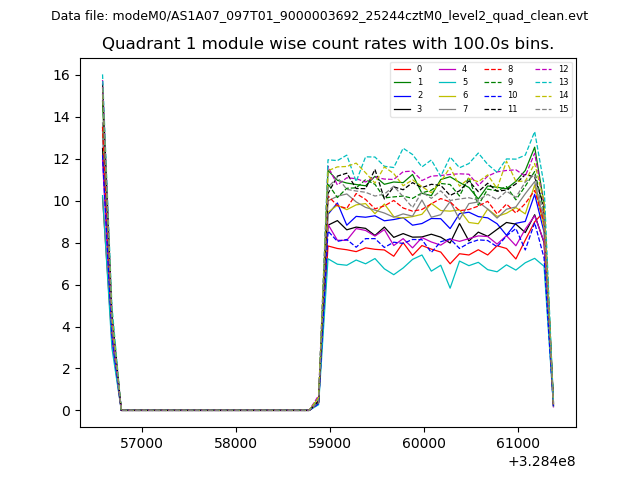
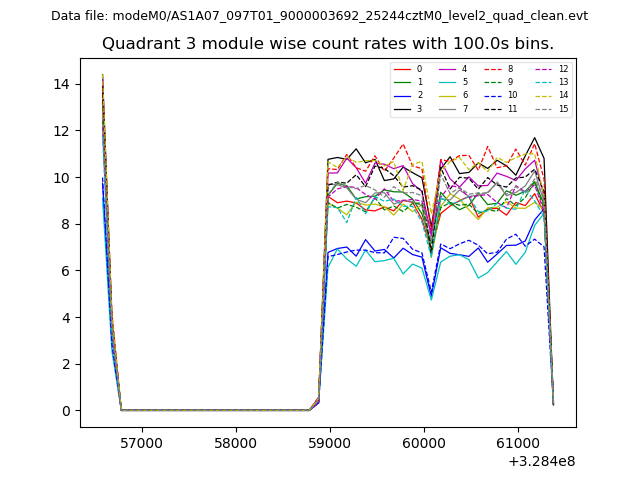
| Module-wise count rates for Quadrant C Data is divided into 100 sec bins |
 |
 |
| Module-wise count rates for Quadrant D Data is divided into 100 sec bins |
 |
 |
| Parameter | Plot |
|---|---|
| CZT HV Monitor | 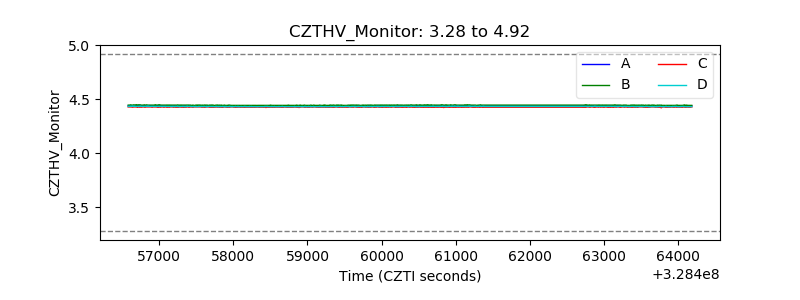 |
| D_VDD | 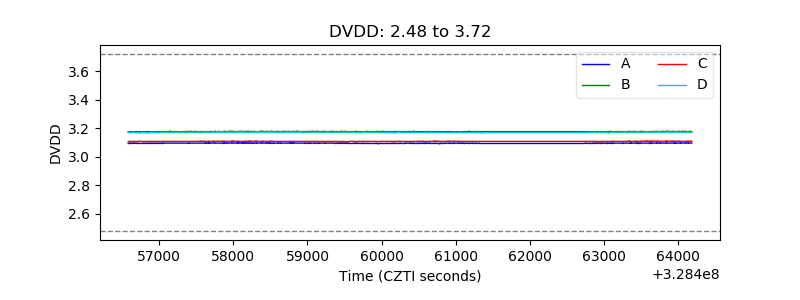 |
| Temperature 1 | 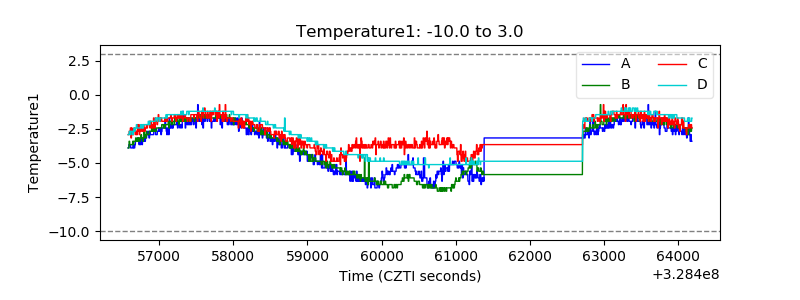 |
| Veto HV Monitor | 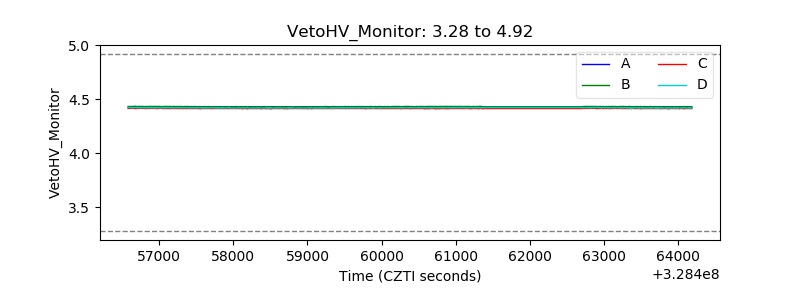 |
| Veto LLD | 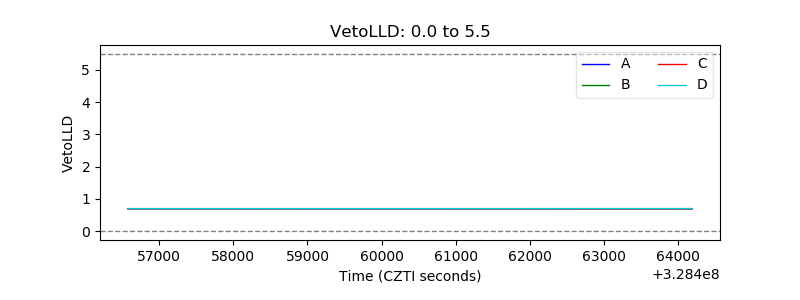 |
| Alpha Counter | 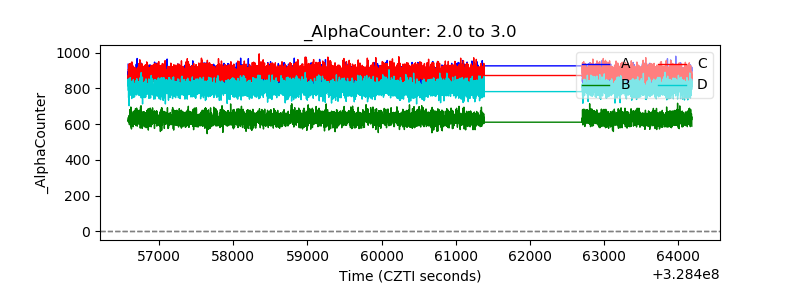 |
| _CPM_Rate | 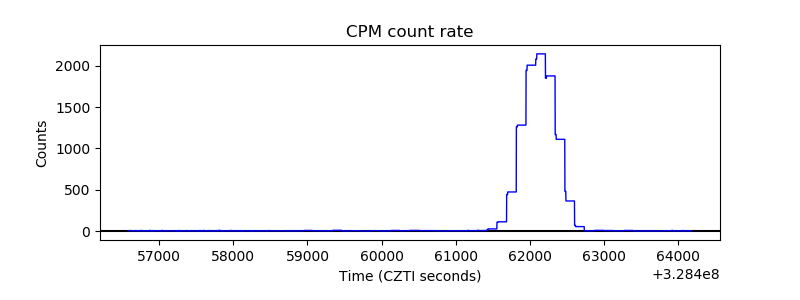 |
| CZT Counter | 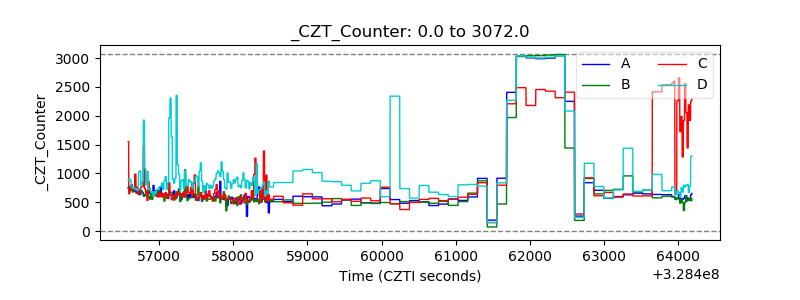 |
| +2.5 Volts monitor |  |
| +5 Volts monitor | 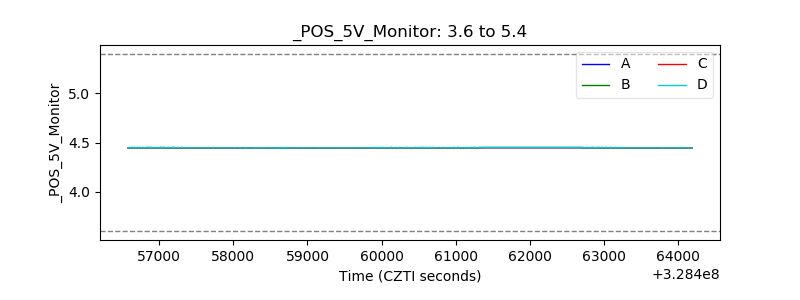 |
| _ROLL_ROT | 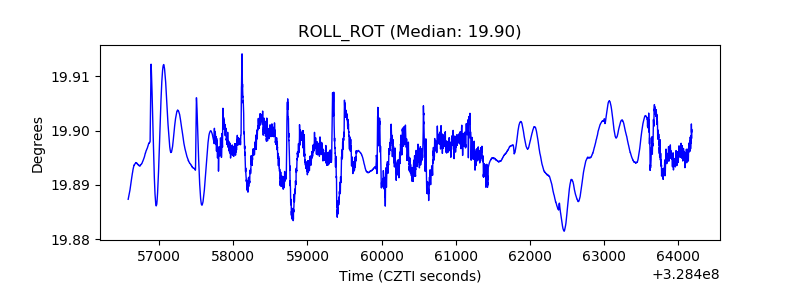 |
| _Roll_DEC | 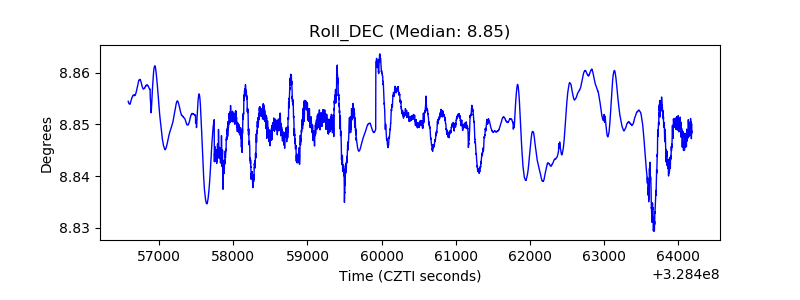 |
| _Roll_RA | 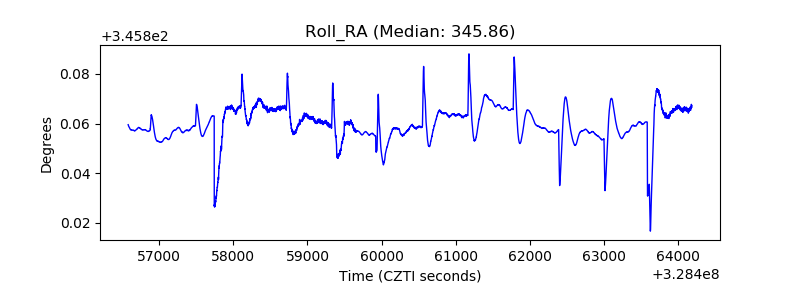 |
| Veto Counter |  |