| Param | Original file | Final file |
|---|---|---|
| Filename | modeM0/AS1A07_097T01_9000003692_25245cztM0_level2.evt | modeM0/AS1A07_097T01_9000003692_25245cztM0_level2_quad_clean.evt |
| Size (bytes) | 651,562,560 | 70,473,600 |
| Size | 621.4 MB | 67.2 MB |
| Events in quadrant A | 3,593,959 | 436,400 |
| Events in quadrant B | 3,636,509 | 439,218 |
| Events in quadrant C | 7,201,893 | 396,322 |
| Events in quadrant D | 4,864,180 | 412,014 |
| Mode M0 | |||
|---|---|---|---|
| Quadrant | BADHDUFLAG | Total packets | Discarded packets |
| A | 0 | 14600 | 0 |
| B | 0 | 14765 | 0 |
| C | 0 | 25852 | 0 |
| D | 0 | 19135 | 0 |
| Mode M9 | |||
|---|---|---|---|
| Quadrant | BADHDUFLAG | Total packets | Discarded packets |
| A | 0 | 14 | 0 |
| B | 0 | 15 | 0 |
| C | 0 | 15 | 0 |
| D | 0 | 15 | 0 |
| Quadrant | Total seconds | Saturated seconds | Saturation percentage |
|---|---|---|---|
| A | 6443 | 145 | 2.250504% |
| B | 6443 | 159 | 2.467795% |
| C | 6443 | 1549 | 24.041596% |
| D | 6443 | 162 | 2.514357% |
Noise dominated data is calculated using 1-second bins in cleaned event files. If a bin has >2000 counts, and if more than 50% of those come from <1% of pixels, then it is considered to be noise-dominated and hence unusable.
| Quadrant | # 1 sec bins | Bins with >0 counts | Bins with >2000 counts | High rate bins dominated by noise | Noise dominated (total time) | Noise dominated (detector-on time) | Marked lightcurve |
|---|---|---|---|---|---|---|---|
| A | 7683 | 6444 | 0 | 0 | 0.00% | 0.00% | 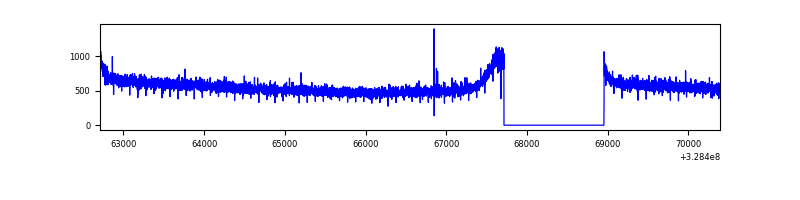 |
| B | 7683 | 6444 | 0 | 0 | 0.00% | 0.00% | 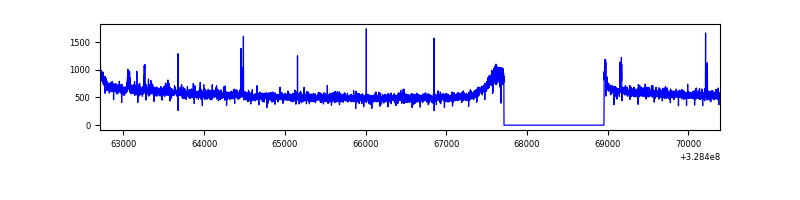 |
| C | 7683 | 6444 | 1118 | 1118 | 14.55% | 17.35% | 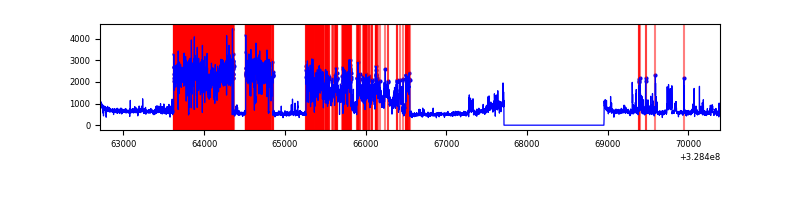 |
| D | 7683 | 6444 | 30 | 30 | 0.39% | 0.47% |  |
Top three noisy pixels from each quadrant. If the there are fewer than three noisy pixels in the level2.evt file, extra rows are filled as -1
| Pixel properties | Quadrant properties | ||||||
|---|---|---|---|---|---|---|---|
| Quadrant | DetID | PixID | Counts | Sigma | Mean | Median | Sigma |
| A | 13 | 254 | 9909 | 48.57 | 931 | 913 | 185.2 |
| A | 3 | 1 | 8073 | 38.66 | 931 | 913 | 185.2 |
| A | 0 | 226 | 8068 | 38.63 | 931 | 913 | 185.2 |
| B | 0 | 190 | 45834 | 258.81 | 918 | 901 | 173.6 |
| B | 12 | 111 | 20476 | 112.75 | 918 | 901 | 173.6 |
| B | 11 | 111 | 17912 | 97.98 | 918 | 901 | 173.6 |
| C | 0 | 239 | 3586331 | 18976.15 | 817 | 822 | 188.9 |
| C | 2 | 16 | 254991 | 1345.18 | 817 | 822 | 188.9 |
| C | 14 | 238 | 128814 | 677.39 | 817 | 822 | 188.9 |
| D | 8 | 195 | 821052 | 3776.35 | 907 | 887 | 217.2 |
| D | 12 | 235 | 144969 | 663.41 | 907 | 887 | 217.2 |
| D | 2 | 244 | 131713 | 602.37 | 907 | 887 | 217.2 |
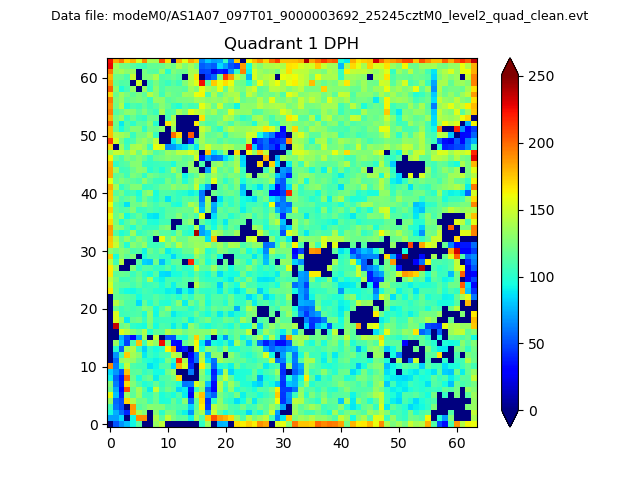
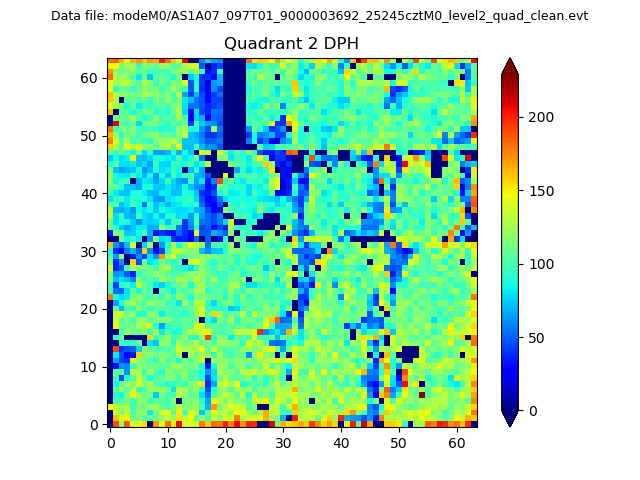
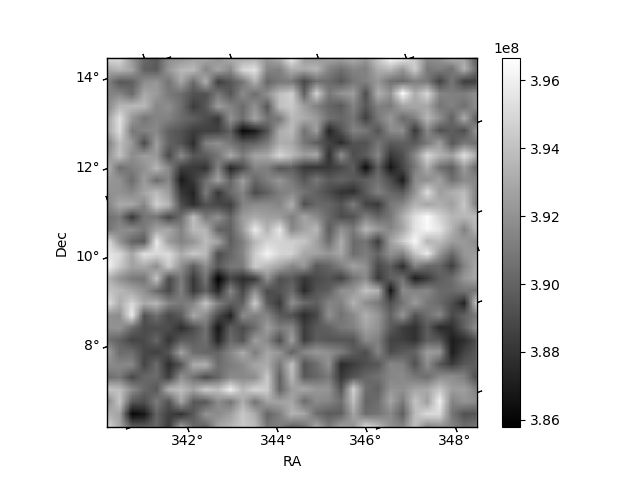
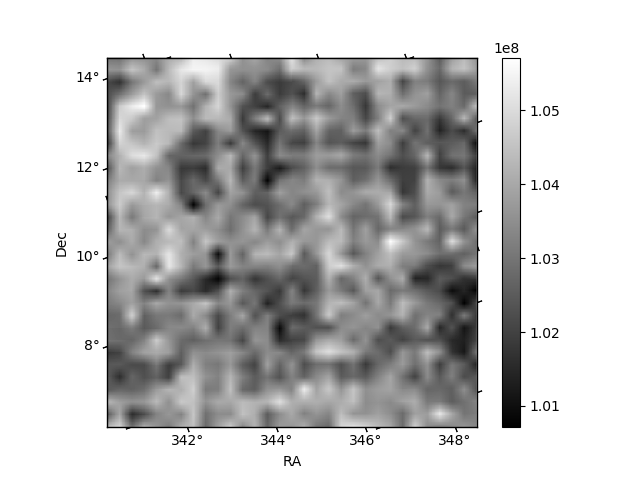
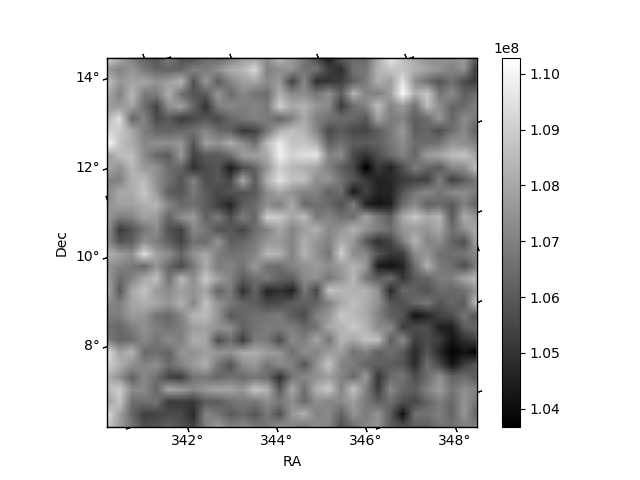
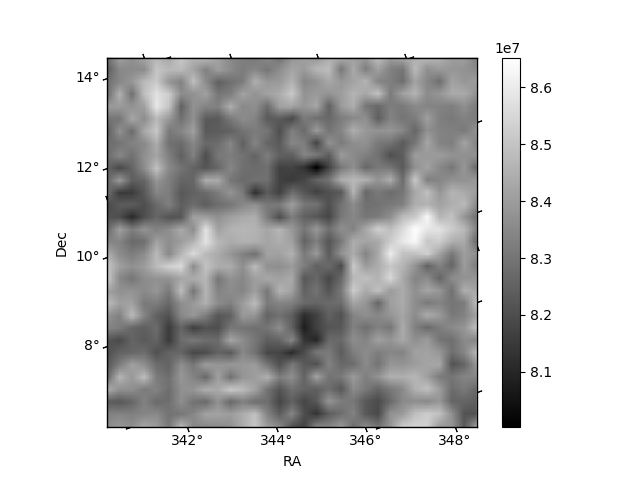
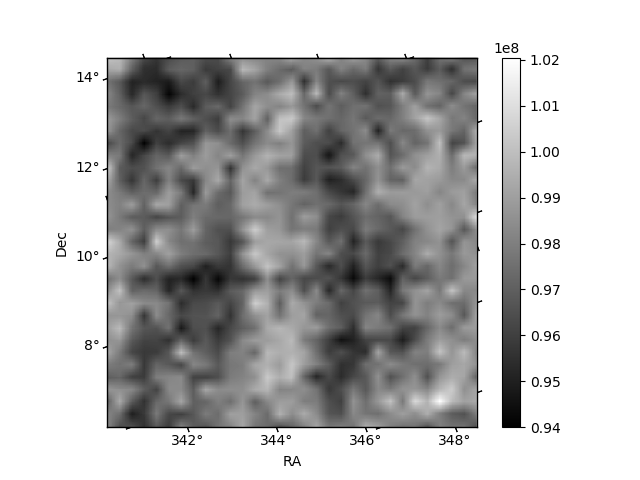
Histogram calculated using DETX and DETY for each event in the final _common_clean file
| Quadrant A | 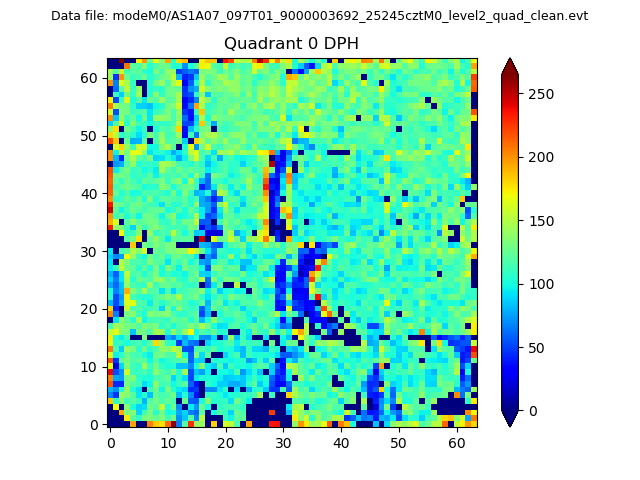 |
 |
Quadrant B |
|---|---|---|---|
| Quadrant D | 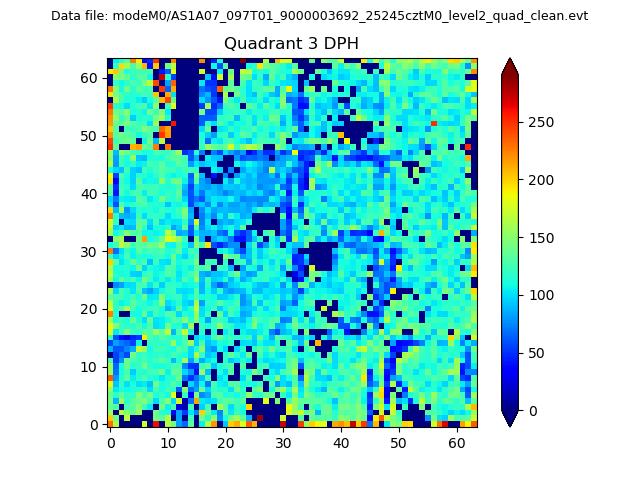 |
 |
Quadrant C |
| Plot type | Count rate plots | Images |
|---|---|---|
| Comparison with Poisson distribution Blue bars denote a histogram of data divided into 1 sec bins. Red curve is a Poisson curve with rate = median count rate of data. |
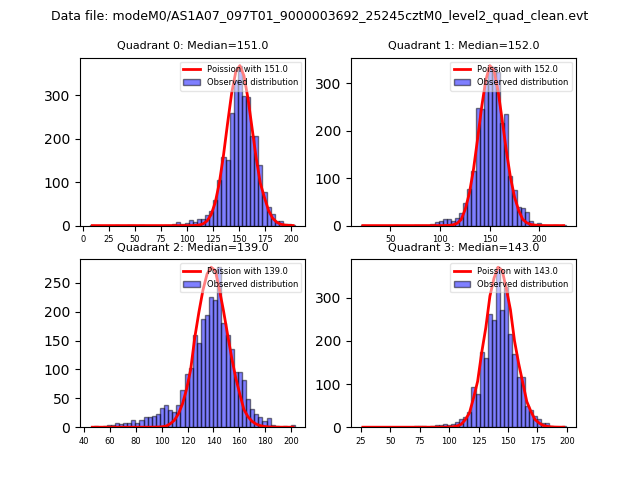 |
 |
| Quadrant-wise count rates Data is divided into 100 sec bins |
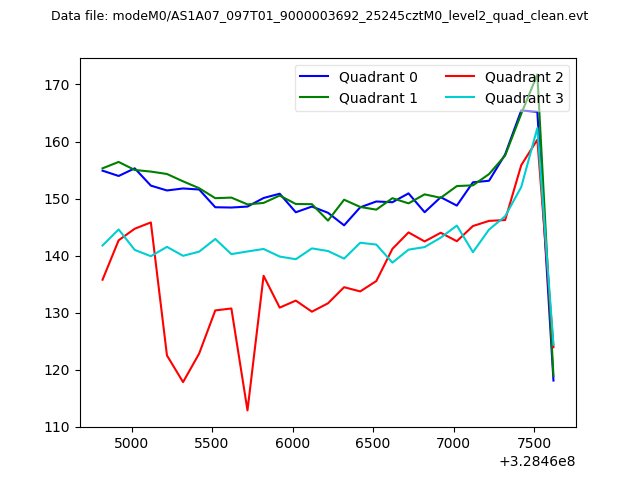 |
|
| Module-wise count rates for Quadrant A Data is divided into 100 sec bins |
 |
 |
| Module-wise count rates for Quadrant B Data is divided into 100 sec bins |
 |
 |
| Module-wise count rates for Quadrant C Data is divided into 100 sec bins |
 |
 |
| Module-wise count rates for Quadrant D Data is divided into 100 sec bins |
 |
 |
| Parameter | Plot |
|---|---|
| CZT HV Monitor |  |
| D_VDD | 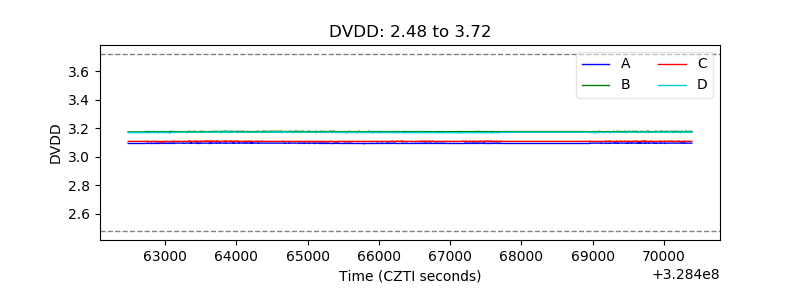 |
| Temperature 1 |  |
| Veto HV Monitor | 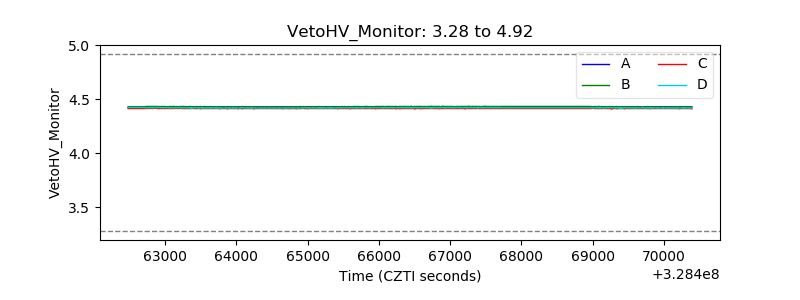 |
| Veto LLD |  |
| Alpha Counter | 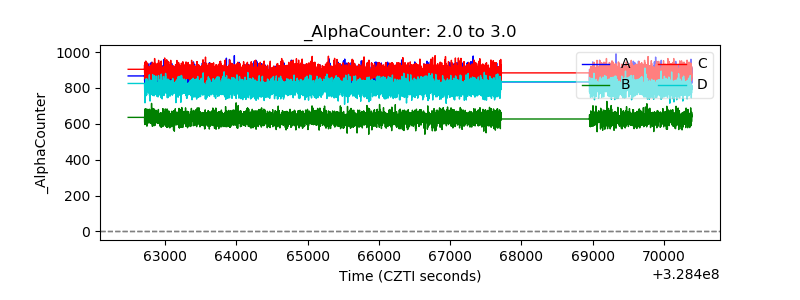 |
| _CPM_Rate | 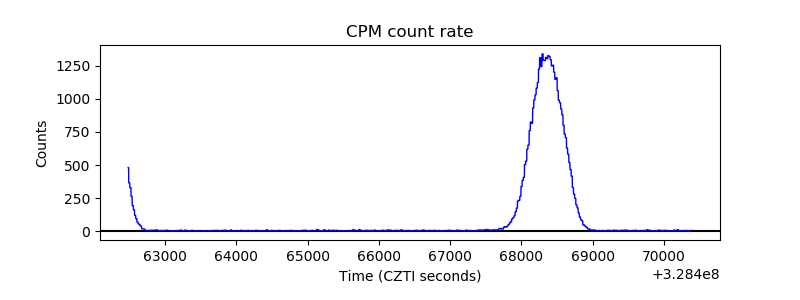 |
| CZT Counter | 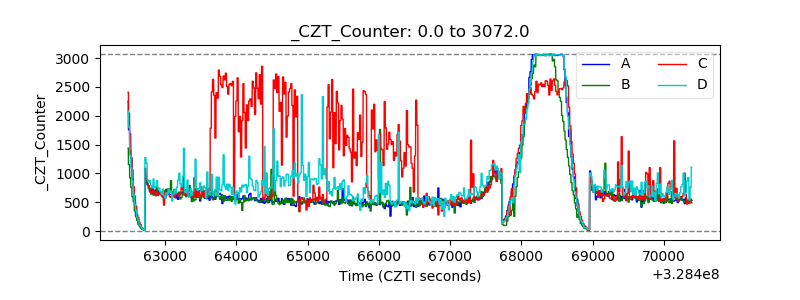 |
| +2.5 Volts monitor |  |
| +5 Volts monitor | 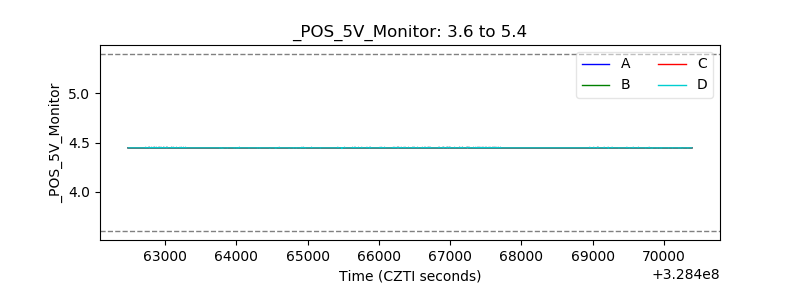 |
| _ROLL_ROT | 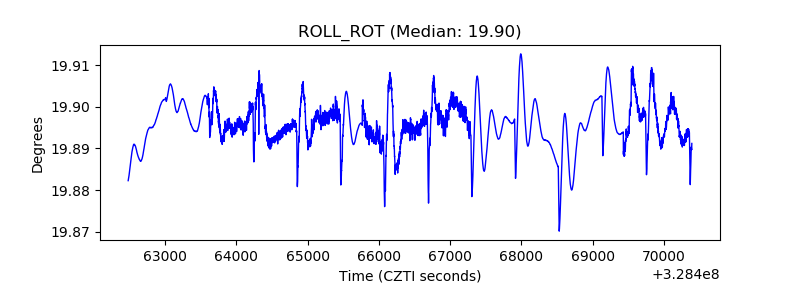 |
| _Roll_DEC | 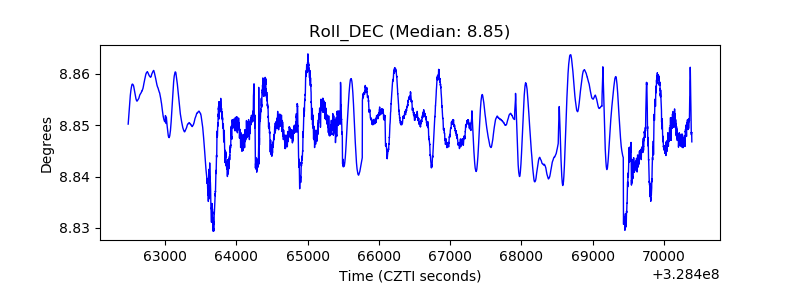 |
| _Roll_RA | 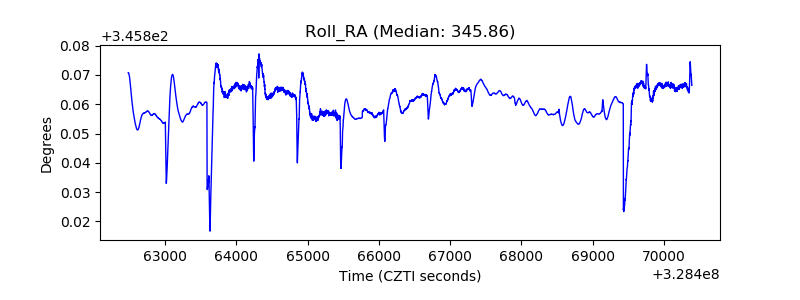 |
| Veto Counter | 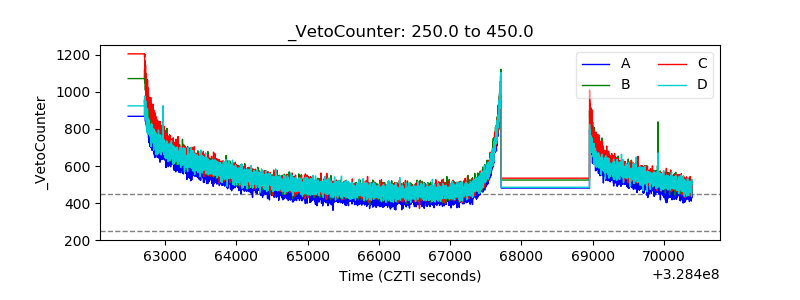 |