| Param | Original file | Final file |
|---|---|---|
| Filename | modeM0/AS1A07_097T01_9000003692_25246cztM0_level2.evt | modeM0/AS1A07_097T01_9000003692_25246cztM0_level2_quad_clean.evt |
| Size (bytes) | 2,357,758,080 | 318,934,080 |
| Size | 2.2 GB | 304.2 MB |
| Events in quadrant A | 13,777,557 | 2,058,362 |
| Events in quadrant B | 13,873,030 | 2,063,636 |
| Events in quadrant C | 21,750,731 | 1,871,712 |
| Events in quadrant D | 20,293,393 | 1,916,670 |
| Mode M0 | |||
|---|---|---|---|
| Quadrant | BADHDUFLAG | Total packets | Discarded packets |
| A | 0 | 55929 | 0 |
| B | 0 | 56083 | 0 |
| C | 0 | 80909 | 0 |
| D | 0 | 78388 | 0 |
| Mode M9 | |||
|---|---|---|---|
| Quadrant | BADHDUFLAG | Total packets | Discarded packets |
| A | 0 | 61 | 0 |
| B | 0 | 61 | 0 |
| C | 0 | 61 | 0 |
| D | 0 | 61 | 0 |
| Quadrant | Total seconds | Saturated seconds | Saturation percentage |
|---|---|---|---|
| A | 25418 | 449 | 1.766465% |
| B | 25419 | 485 | 1.908022% |
| C | 25419 | 3586 | 14.107557% |
| D | 25418 | 1259 | 4.953183% |
Noise dominated data is calculated using 1-second bins in cleaned event files. If a bin has >2000 counts, and if more than 50% of those come from <1% of pixels, then it is considered to be noise-dominated and hence unusable.
| Quadrant | # 1 sec bins | Bins with >0 counts | Bins with >2000 counts | High rate bins dominated by noise | Noise dominated (total time) | Noise dominated (detector-on time) | Marked lightcurve |
|---|---|---|---|---|---|---|---|
| A | 31578 | 25423 | 0 | 0 | 0.00% | 0.00% | 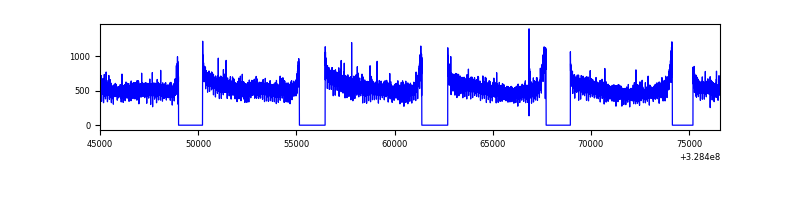 |
| B | 31579 | 25424 | 1 | 1 | 0.00% | 0.00% | 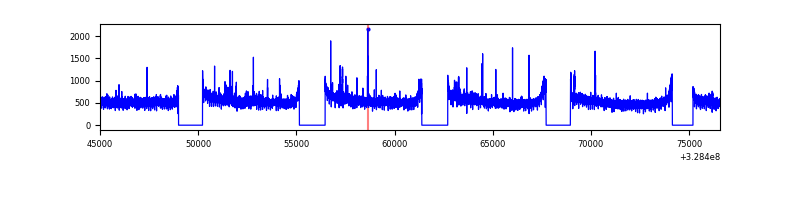 |
| C | 31579 | 25424 | 2325 | 2325 | 7.36% | 9.14% | 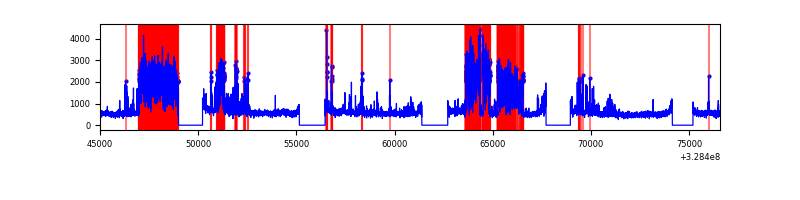 |
| D | 31578 | 25423 | 584 | 584 | 1.85% | 2.30% | 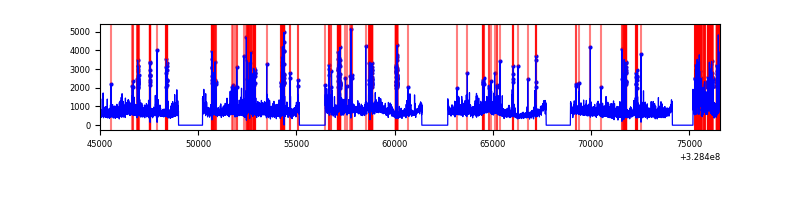 |
Top three noisy pixels from each quadrant. If the there are fewer than three noisy pixels in the level2.evt file, extra rows are filled as -1
| Pixel properties | Quadrant properties | ||||||
|---|---|---|---|---|---|---|---|
| Quadrant | DetID | PixID | Counts | Sigma | Mean | Median | Sigma |
| A | 3 | 1 | 49429 | 65.45 | 3558 | 3493 | 701.9 |
| A | 13 | 254 | 40822 | 53.19 | 3558 | 3493 | 701.9 |
| A | 0 | 226 | 30943 | 39.11 | 3558 | 3493 | 701.9 |
| B | 0 | 190 | 136653 | 204.85 | 3497 | 3429 | 650.4 |
| B | 12 | 111 | 77678 | 114.17 | 3497 | 3429 | 650.4 |
| B | 11 | 111 | 69020 | 100.85 | 3497 | 3429 | 650.4 |
| C | 0 | 239 | 7216157 | 9629.52 | 3235 | 3264 | 749.0 |
| C | 2 | 16 | 930911 | 1238.45 | 3235 | 3264 | 749.0 |
| C | 14 | 238 | 518248 | 687.53 | 3235 | 3264 | 749.0 |
| D | 8 | 195 | 3216061 | 3919.98 | 3421 | 3335 | 819.6 |
| D | 10 | 70 | 1316234 | 1601.92 | 3421 | 3335 | 819.6 |
| D | 9 | 35 | 979384 | 1190.92 | 3421 | 3335 | 819.6 |
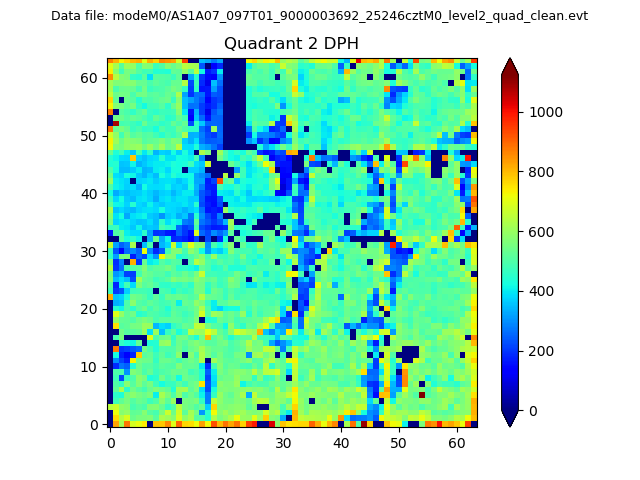
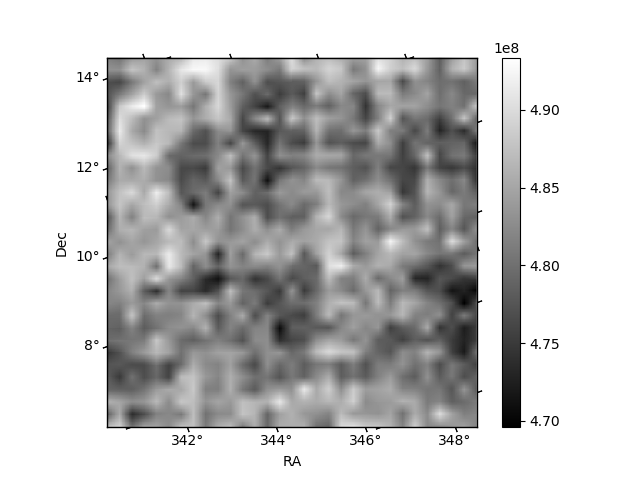
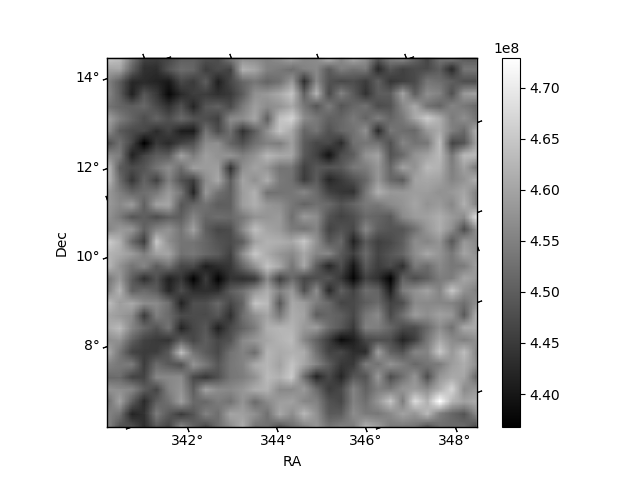
Histogram calculated using DETX and DETY for each event in the final _common_clean file
| Quadrant A |  |
 |
Quadrant B |
|---|---|---|---|
| Quadrant D | 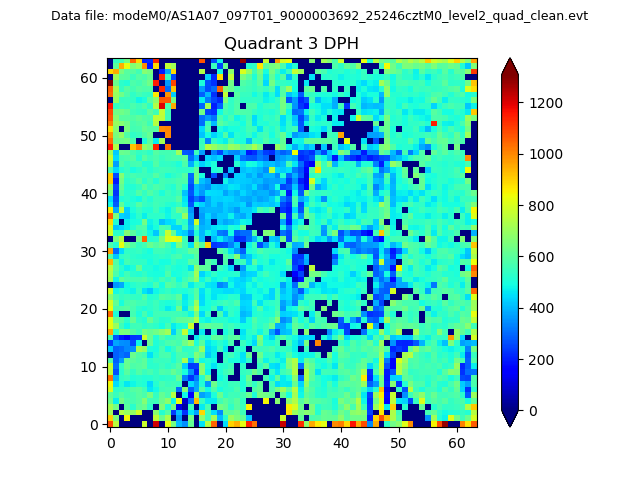 |
 |
Quadrant C |
| Plot type | Count rate plots | Images |
|---|---|---|
| Comparison with Poisson distribution Blue bars denote a histogram of data divided into 1 sec bins. Red curve is a Poisson curve with rate = median count rate of data. |
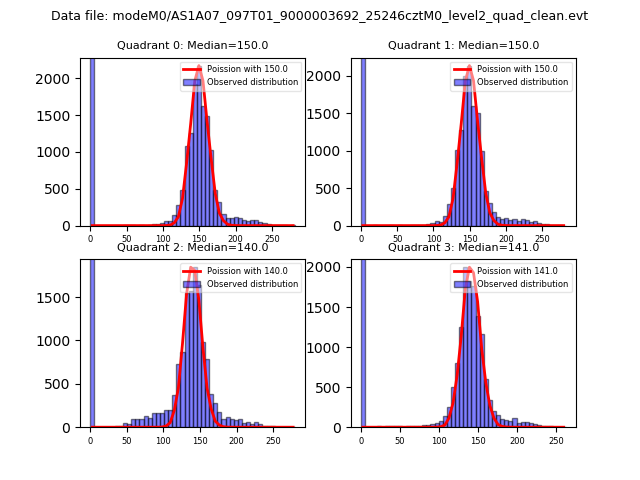 |
 |
| Quadrant-wise count rates Data is divided into 100 sec bins |
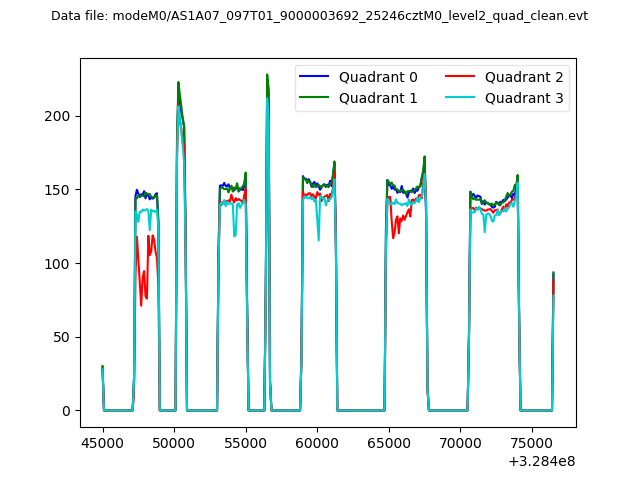 |
|
| Module-wise count rates for Quadrant A Data is divided into 100 sec bins |
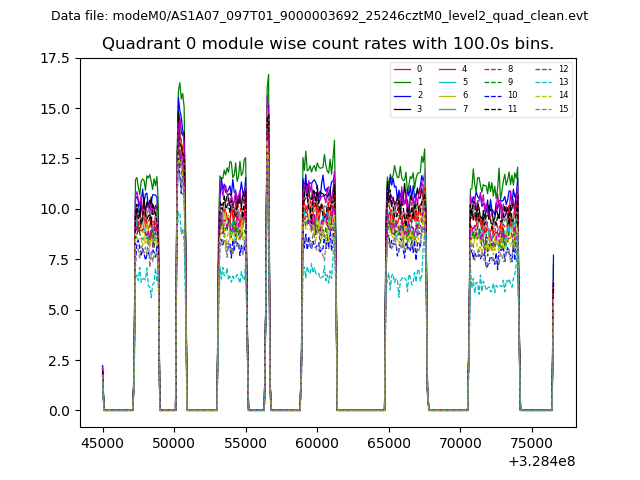 |
 |
| Module-wise count rates for Quadrant B Data is divided into 100 sec bins |
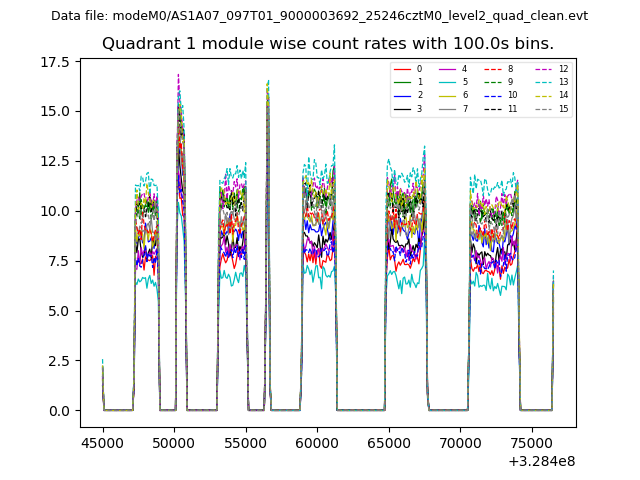 |
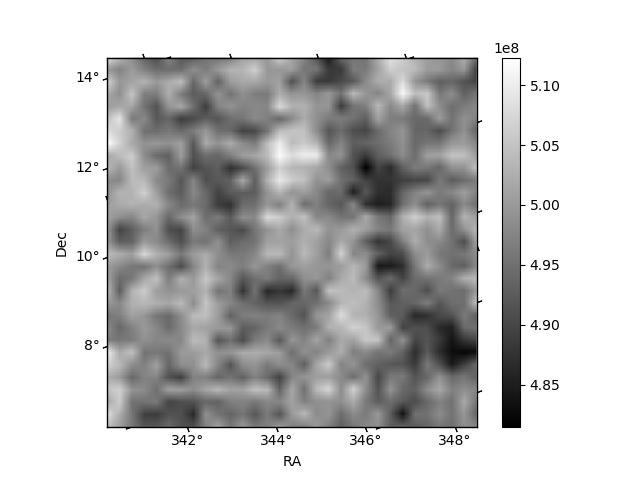 |
| Module-wise count rates for Quadrant C Data is divided into 100 sec bins |
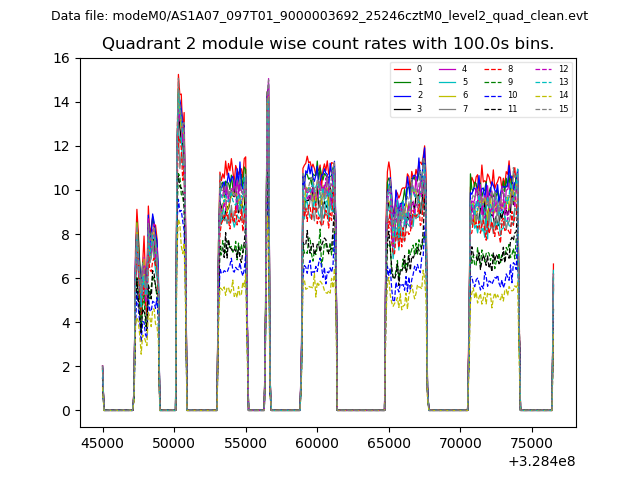 |
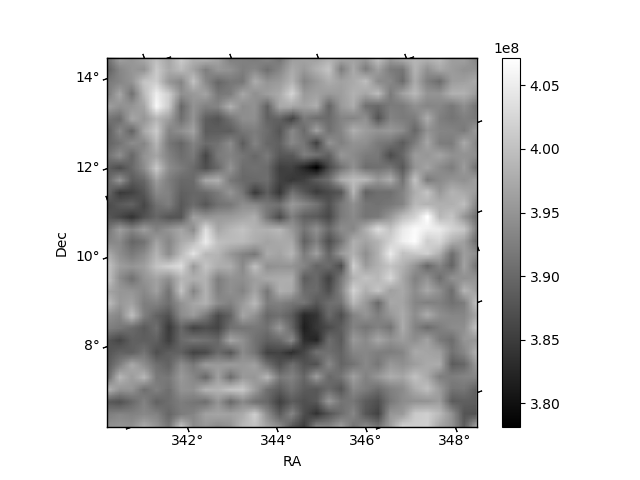 |
| Module-wise count rates for Quadrant D Data is divided into 100 sec bins |
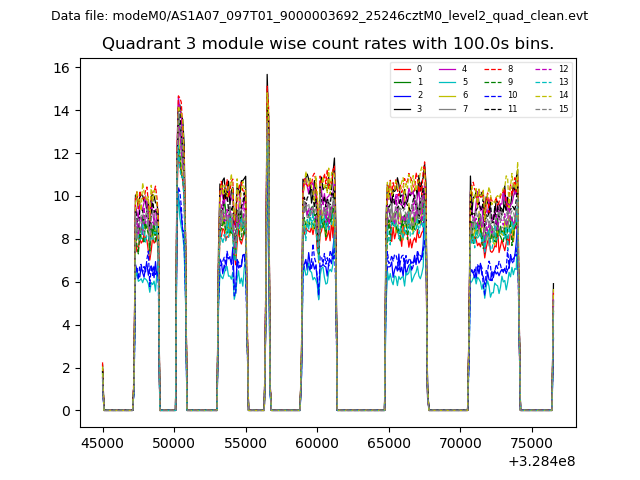 |
 |
| Parameter | Plot |
|---|---|
| CZT HV Monitor | 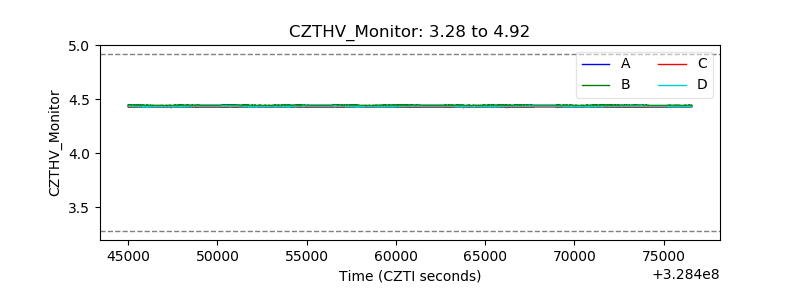 |
| D_VDD | 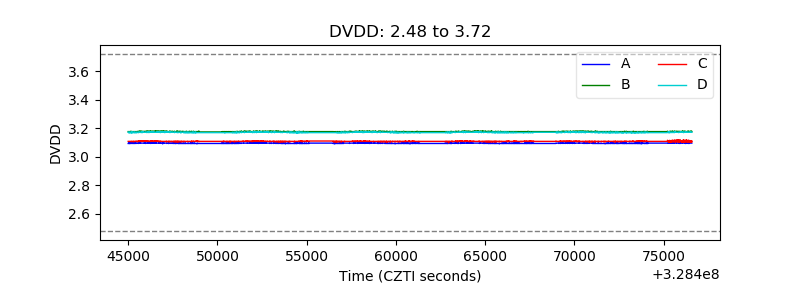 |
| Temperature 1 | 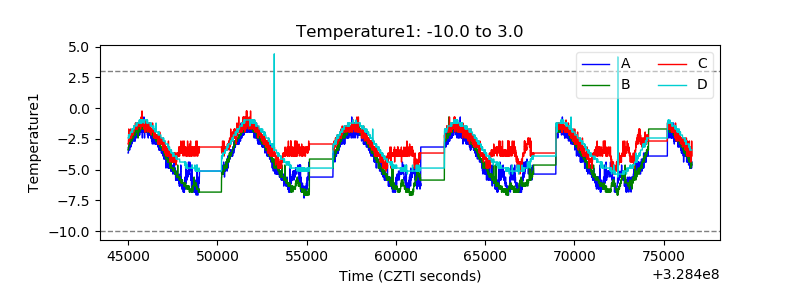 |
| Veto HV Monitor | 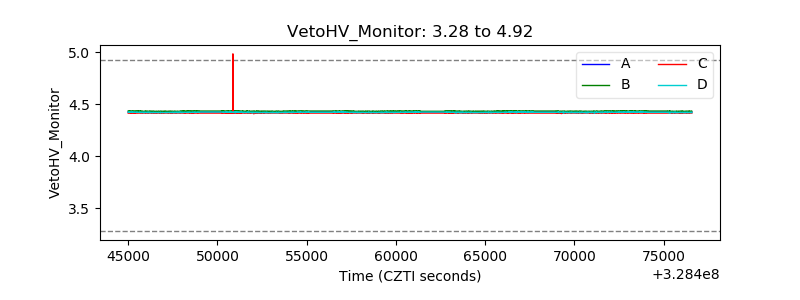 |
| Veto LLD | 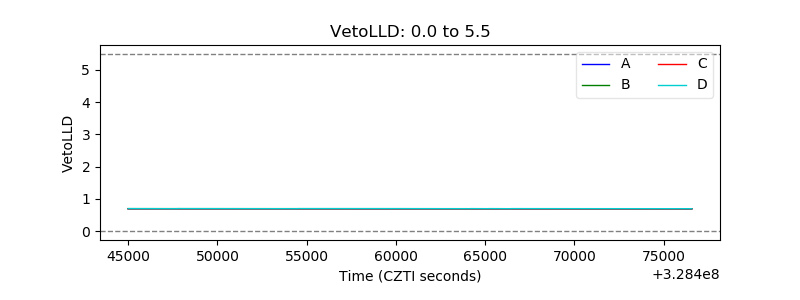 |
| Alpha Counter | 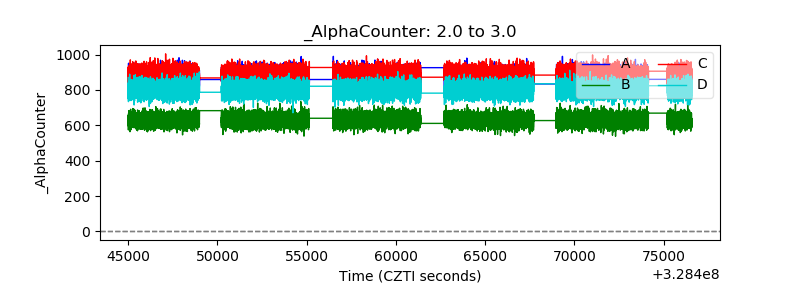 |
| _CPM_Rate | 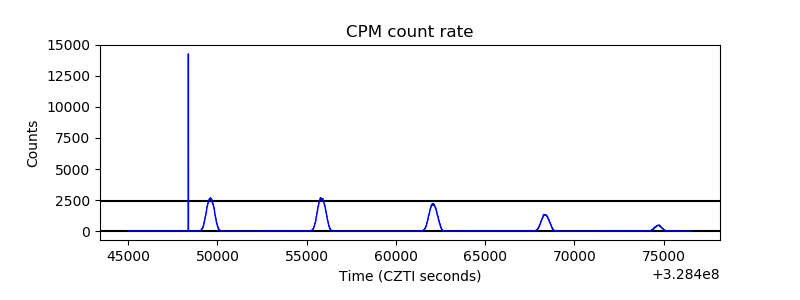 |
| CZT Counter | 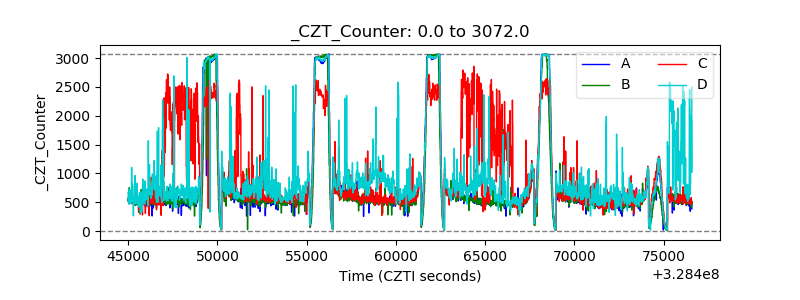 |
| +2.5 Volts monitor |  |
| +5 Volts monitor |  |
| _ROLL_ROT | 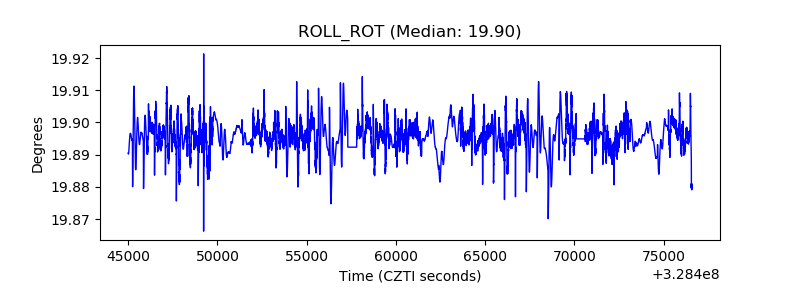 |
| _Roll_DEC | 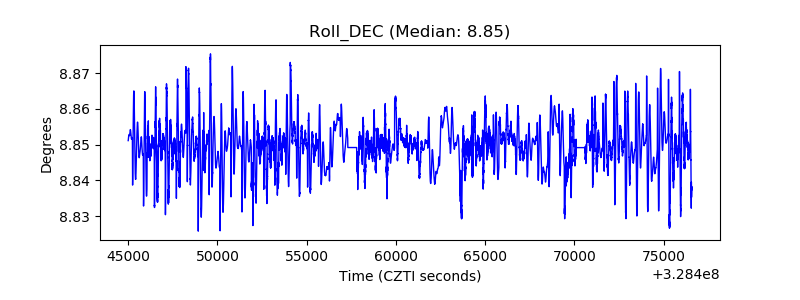 |
| _Roll_RA | 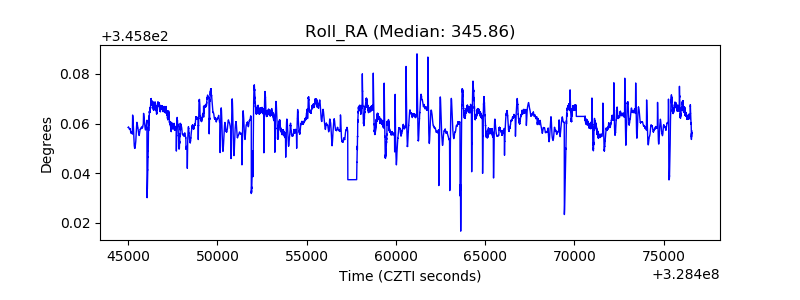 |
| Veto Counter | 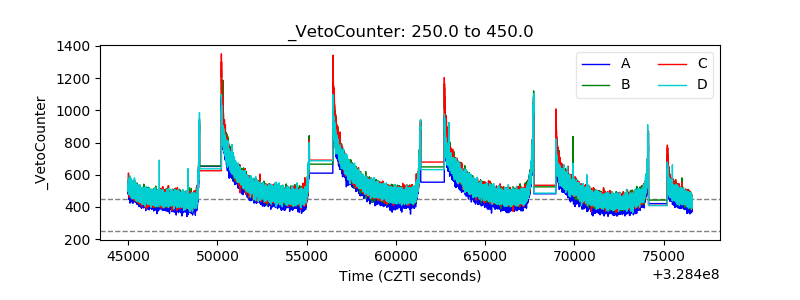 |