| Param | Original file | Final file |
|---|---|---|
| Filename | modeM0/AS1A07_097T01_9000003692_25247cztM0_level2.evt | modeM0/AS1A07_097T01_9000003692_25247cztM0_level2_quad_clean.evt |
| Size (bytes) | 591,379,200 | 84,960,000 |
| Size | 564.0 MB | 81.0 MB |
| Events in quadrant A | 3,309,491 | 543,666 |
| Events in quadrant B | 3,348,622 | 548,614 |
| Events in quadrant C | 3,757,465 | 522,049 |
| Events in quadrant D | 7,041,669 | 492,406 |
| Mode M0 | |||
|---|---|---|---|
| Quadrant | BADHDUFLAG | Total packets | Discarded packets |
| A | 0 | 13845 | 0 |
| B | 0 | 13924 | 0 |
| C | 0 | 15021 | 0 |
| D | 0 | 25511 | 0 |
| Mode M9 | |||
|---|---|---|---|
| Quadrant | BADHDUFLAG | Total packets | Discarded packets |
| A | 0 | 7 | 0 |
| B | 0 | 7 | 0 |
| C | 0 | 7 | 0 |
| D | 0 | 7 | 0 |
| Quadrant | Total seconds | Saturated seconds | Saturation percentage |
|---|---|---|---|
| A | 6680 | 78 | 1.167665% |
| B | 6681 | 85 | 1.272265% |
| C | 6680 | 161 | 2.410180% |
| D | 6680 | 1045 | 15.643713% |
Noise dominated data is calculated using 1-second bins in cleaned event files. If a bin has >2000 counts, and if more than 50% of those come from <1% of pixels, then it is considered to be noise-dominated and hence unusable.
| Quadrant | # 1 sec bins | Bins with >0 counts | Bins with >2000 counts | High rate bins dominated by noise | Noise dominated (total time) | Noise dominated (detector-on time) | Marked lightcurve |
|---|---|---|---|---|---|---|---|
| A | 7350 | 6681 | 0 | 0 | 0.00% | 0.00% | 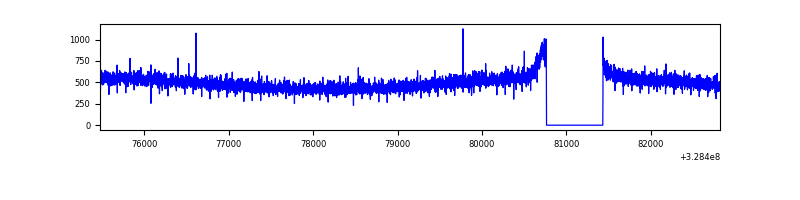 |
| B | 7351 | 6682 | 0 | 0 | 0.00% | 0.00% | 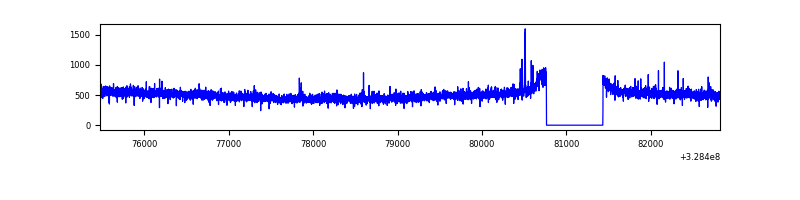 |
| C | 7350 | 6681 | 16 | 16 | 0.22% | 0.24% | 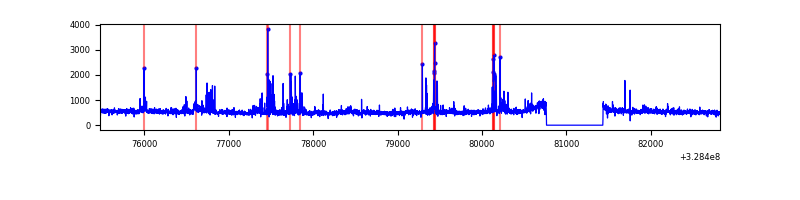 |
| D | 7350 | 6681 | 697 | 697 | 9.48% | 10.43% | 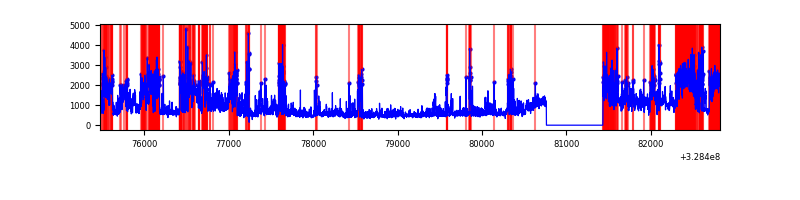 |
Top three noisy pixels from each quadrant. If the there are fewer than three noisy pixels in the level2.evt file, extra rows are filled as -1
| Pixel properties | Quadrant properties | ||||||
|---|---|---|---|---|---|---|---|
| Quadrant | DetID | PixID | Counts | Sigma | Mean | Median | Sigma |
| A | 3 | 1 | 16665 | 91.28 | 853 | 836 | 173.4 |
| A | 13 | 254 | 10894 | 58.0 | 853 | 836 | 173.4 |
| A | 3 | 137 | 7780 | 40.04 | 853 | 836 | 173.4 |
| B | 0 | 190 | 20975 | 122.01 | 846 | 825 | 165.1 |
| B | 12 | 111 | 19722 | 114.42 | 846 | 825 | 165.1 |
| B | 11 | 111 | 17586 | 101.49 | 846 | 825 | 165.1 |
| C | 2 | 16 | 309514 | 1611.22 | 814 | 820 | 191.6 |
| C | 14 | 238 | 131375 | 681.43 | 814 | 820 | 191.6 |
| C | 7 | 247 | 105160 | 544.6 | 814 | 820 | 191.6 |
| D | 1 | 239 | 1474071 | 7569.03 | 794 | 770 | 194.6 |
| D | 9 | 35 | 1126589 | 5783.85 | 794 | 770 | 194.6 |
| D | 10 | 70 | 449923 | 2307.5 | 794 | 770 | 194.6 |
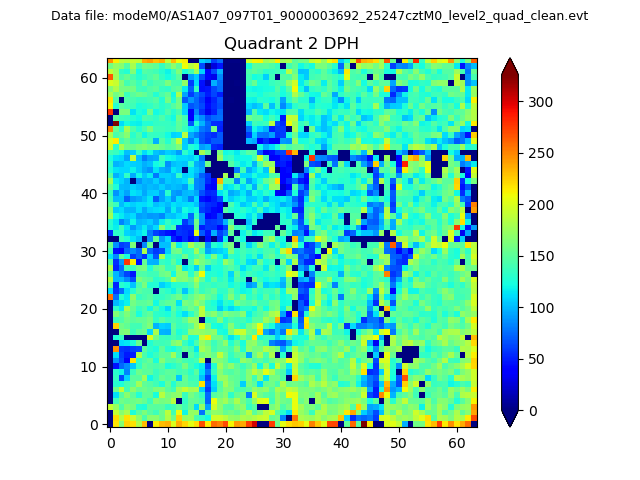
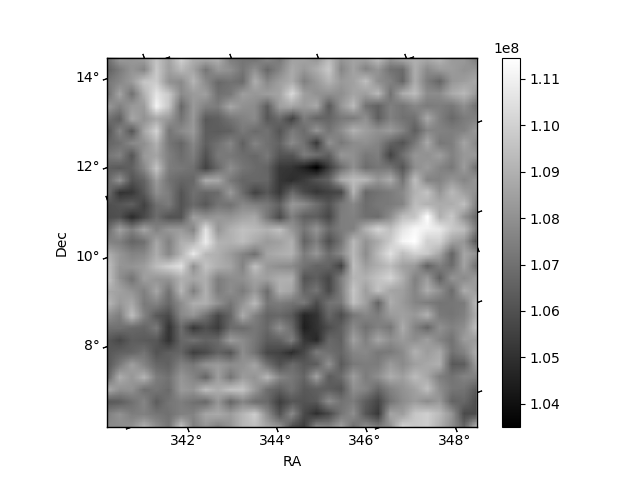
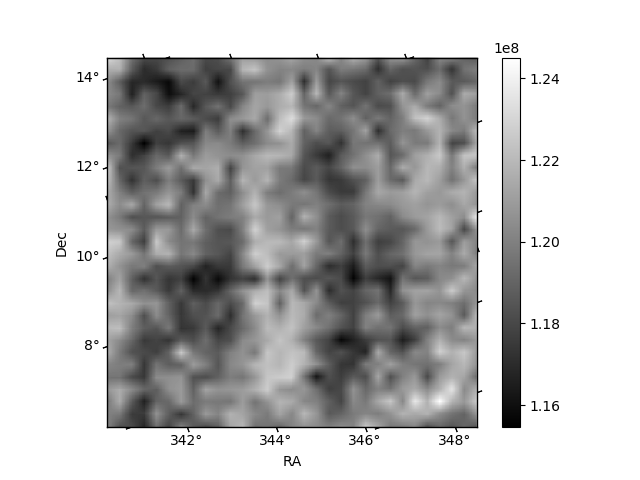
Histogram calculated using DETX and DETY for each event in the final _common_clean file
| Quadrant A | 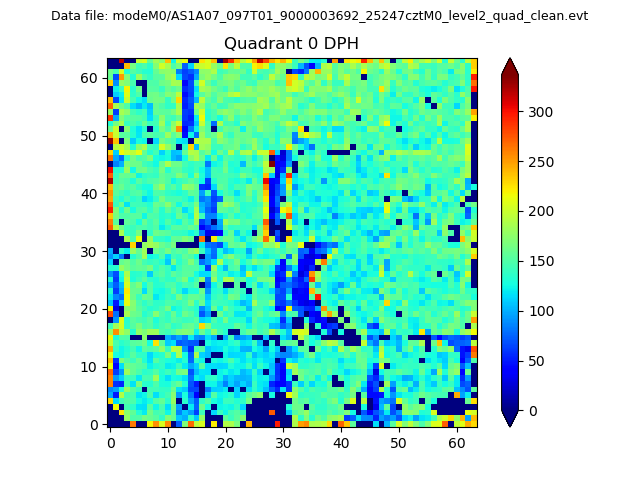 |
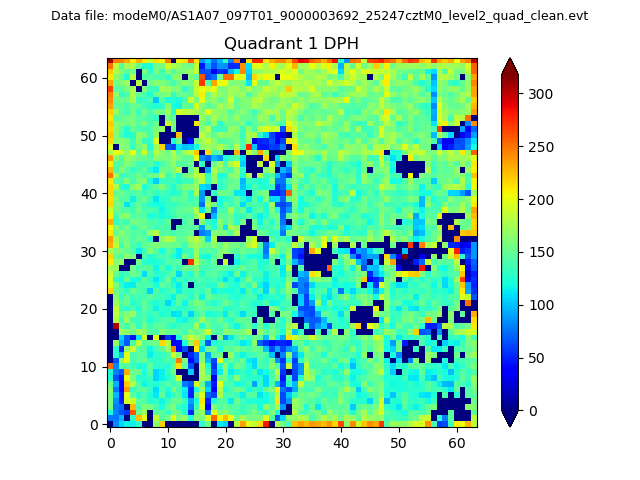 |
Quadrant B |
|---|---|---|---|
| Quadrant D | 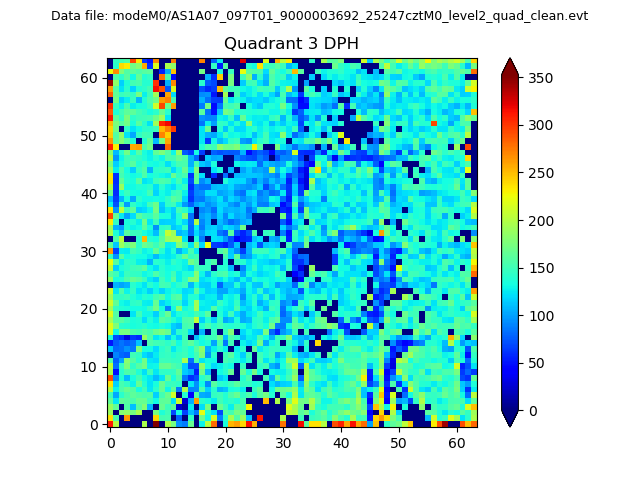 |
 |
Quadrant C |
| Plot type | Count rate plots | Images |
|---|---|---|
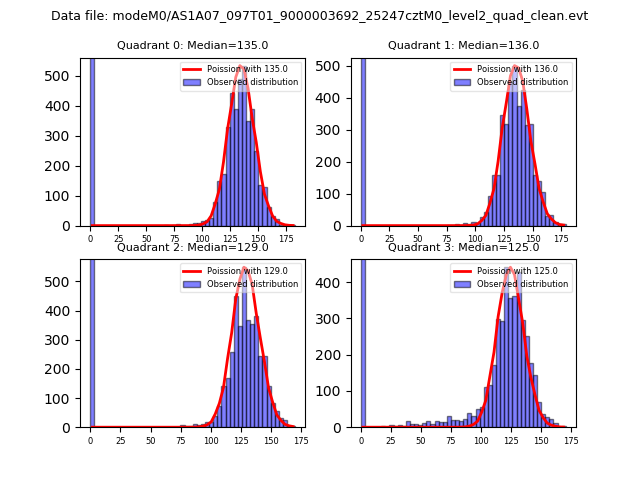
| Comparison with Poisson distribution Blue bars denote a histogram of data divided into 1 sec bins. Red curve is a Poisson curve with rate = median count rate of data. |
 |
 |
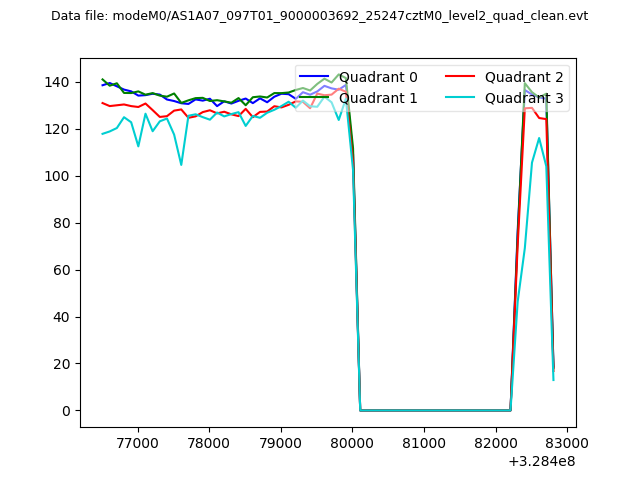
| Quadrant-wise count rates Data is divided into 100 sec bins |
 |
|
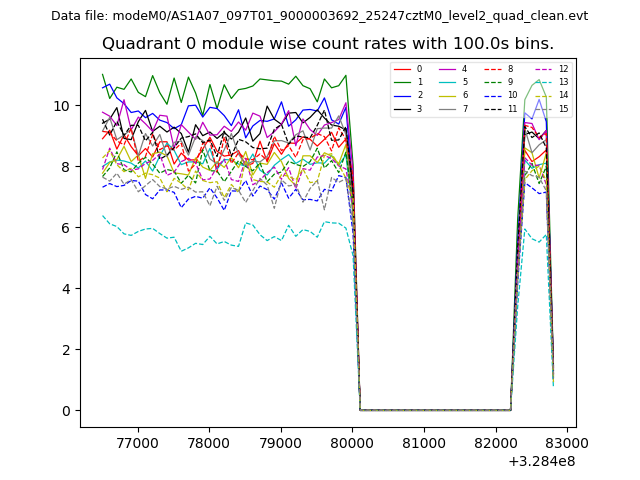
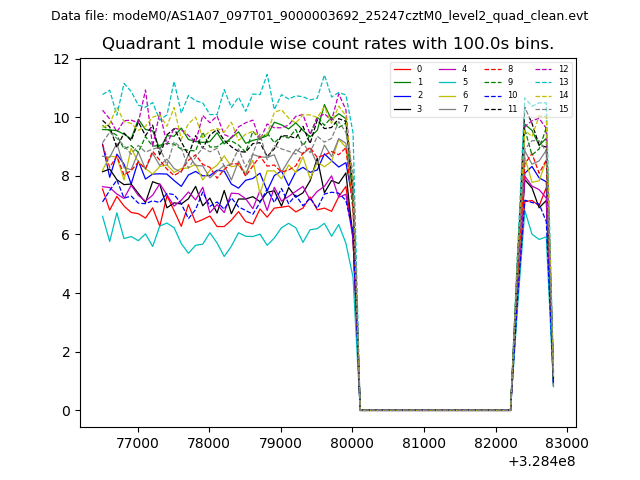
| Module-wise count rates for Quadrant A Data is divided into 100 sec bins |
 |
 |
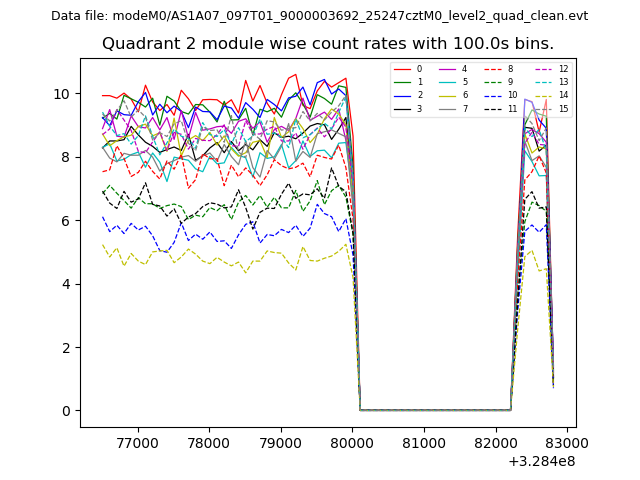
| Module-wise count rates for Quadrant B Data is divided into 100 sec bins |
 |
 |
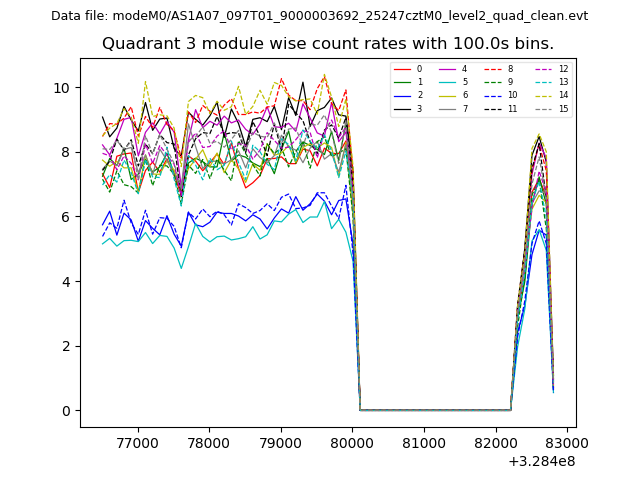
| Module-wise count rates for Quadrant C Data is divided into 100 sec bins |
 |
 |
| Module-wise count rates for Quadrant D Data is divided into 100 sec bins |
 |
 |
| Parameter | Plot |
|---|---|
| CZT HV Monitor | 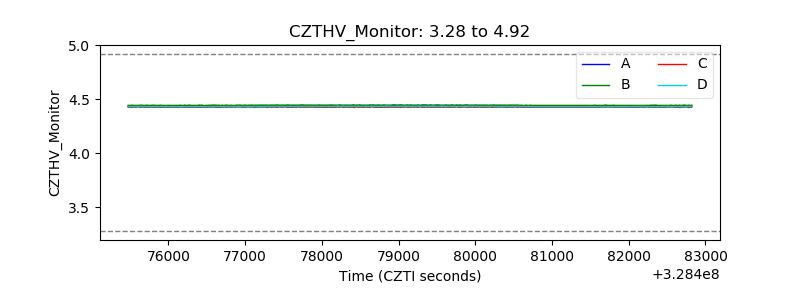 |
| D_VDD |  |
| Temperature 1 | 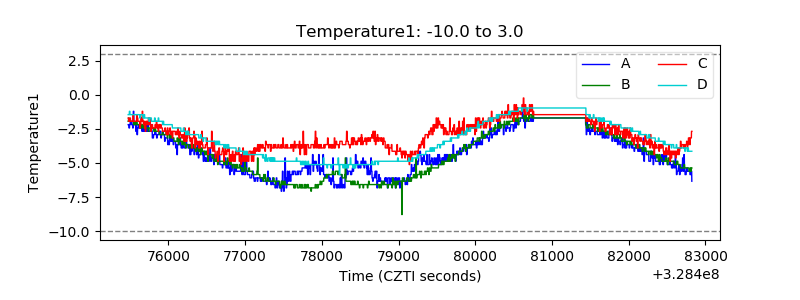 |
| Veto HV Monitor | 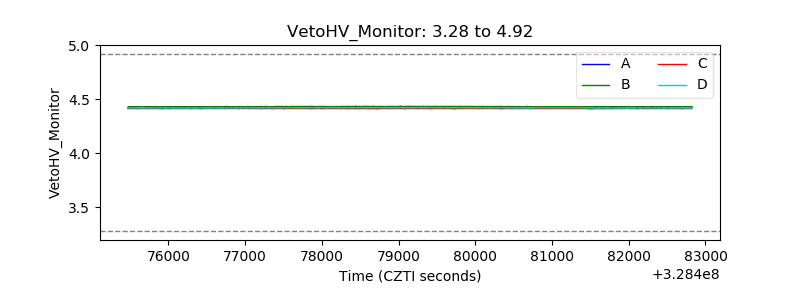 |
| Veto LLD | 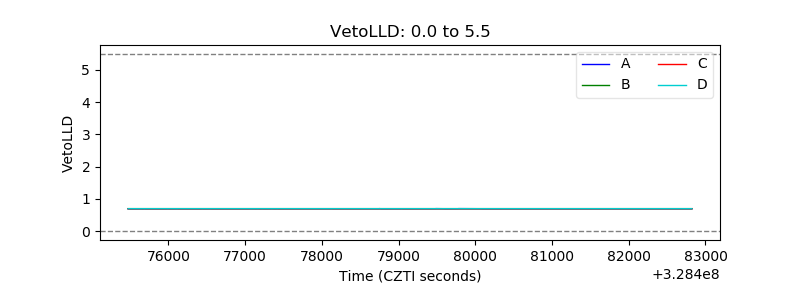 |
| Alpha Counter | 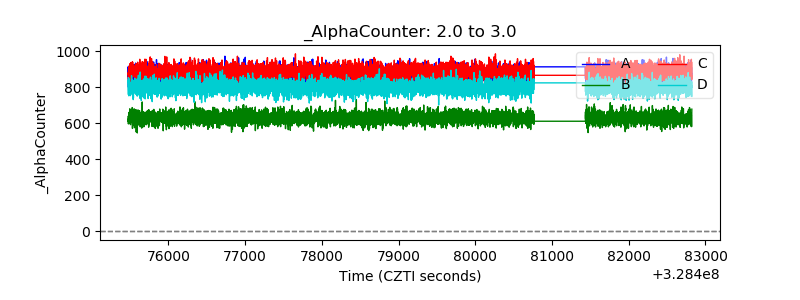 |
| _CPM_Rate | 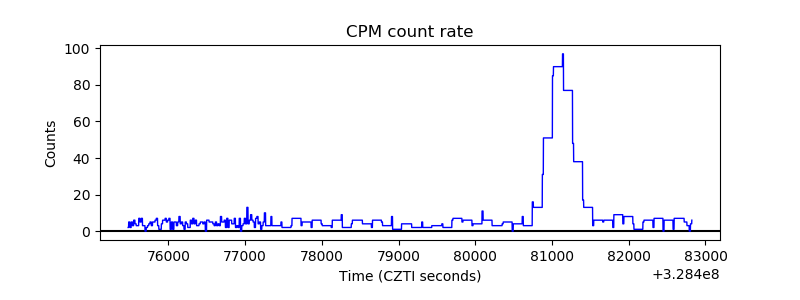 |
| CZT Counter | 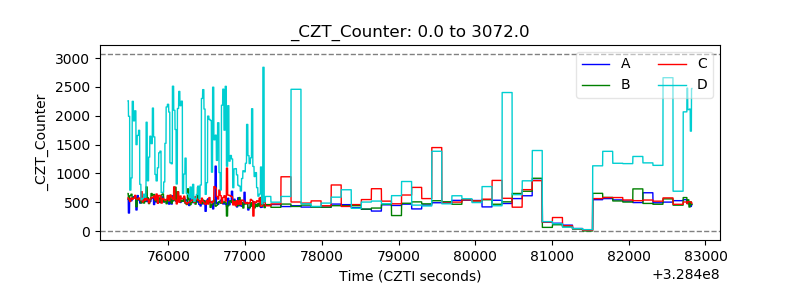 |
| +2.5 Volts monitor |  |
| +5 Volts monitor |  |
| _ROLL_ROT | 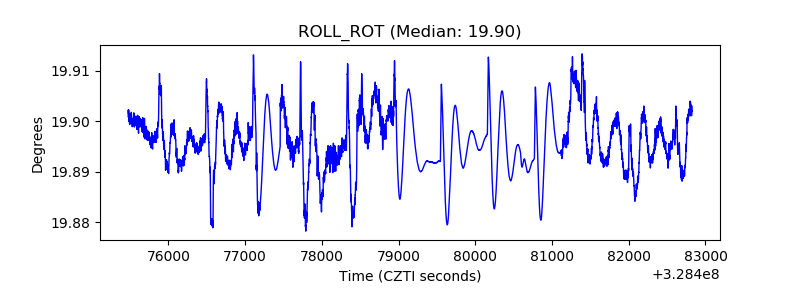 |
| _Roll_DEC | 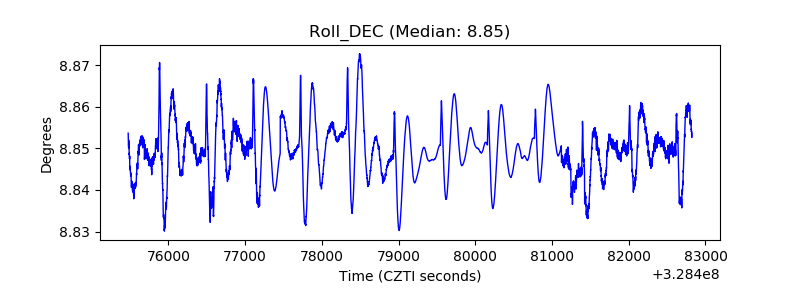 |
| _Roll_RA | 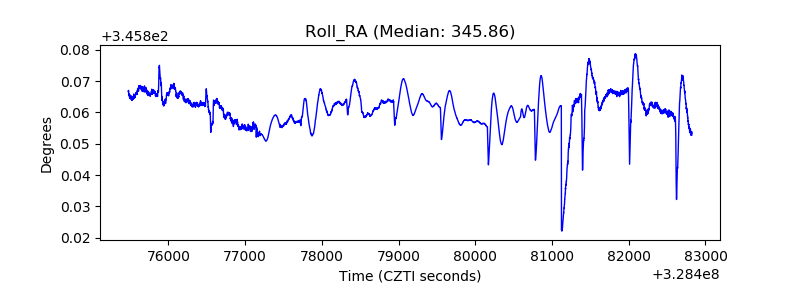 |
| Veto Counter | 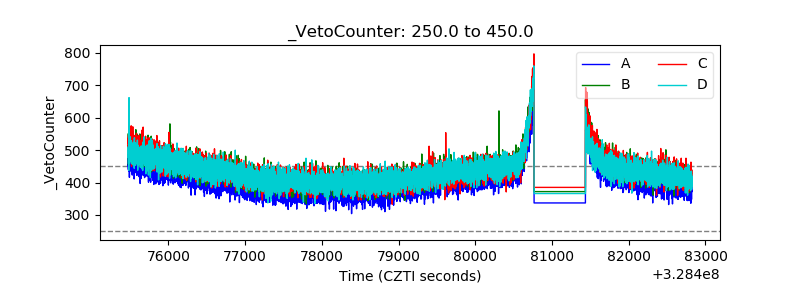 |