| Param | Original file | Final file |
|---|---|---|
| Filename | modeM0/AS1A07_097T01_9000003692_25248cztM0_level2.evt | modeM0/AS1A07_097T01_9000003692_25248cztM0_level2_quad_clean.evt |
| Size (bytes) | 597,245,760 | 93,127,680 |
| Size | 569.6 MB | 88.8 MB |
| Events in quadrant A | 3,588,959 | 594,333 |
| Events in quadrant B | 3,695,218 | 596,907 |
| Events in quadrant C | 4,311,135 | 567,898 |
| Events in quadrant D | 5,990,716 | 545,874 |
| Mode M0 | |||
|---|---|---|---|
| Quadrant | BADHDUFLAG | Total packets | Discarded packets |
| A | 0 | 15293 | 0 |
| B | 0 | 15577 | 0 |
| C | 0 | 17701 | 0 |
| D | 0 | 22918 | 0 |
| Mode M9 | |||
|---|---|---|---|
| Quadrant | BADHDUFLAG | Total packets | Discarded packets |
| A | 0 | 5 | 0 |
| B | 0 | 6 | 0 |
| C | 0 | 6 | 0 |
| D | 0 | 6 | 0 |
| Quadrant | Total seconds | Saturated seconds | Saturation percentage |
|---|---|---|---|
| A | 7393 | 42 | 0.568105% |
| B | 7393 | 70 | 0.946842% |
| C | 7392 | 218 | 2.949134% |
| D | 7392 | 657 | 8.887987% |
Noise dominated data is calculated using 1-second bins in cleaned event files. If a bin has >2000 counts, and if more than 50% of those come from <1% of pixels, then it is considered to be noise-dominated and hence unusable.
| Quadrant | # 1 sec bins | Bins with >0 counts | Bins with >2000 counts | High rate bins dominated by noise | Noise dominated (total time) | Noise dominated (detector-on time) | Marked lightcurve |
|---|---|---|---|---|---|---|---|
| A | 7748 | 7394 | 0 | 0 | 0.00% | 0.00% | 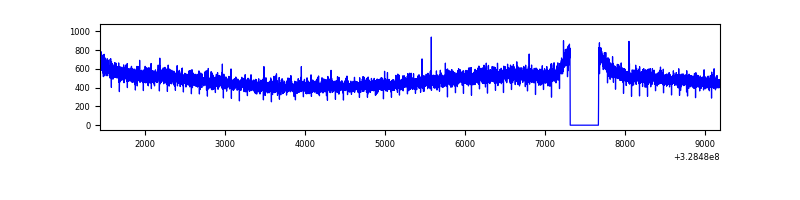 |
| B | 7748 | 7394 | 5 | 5 | 0.06% | 0.07% | 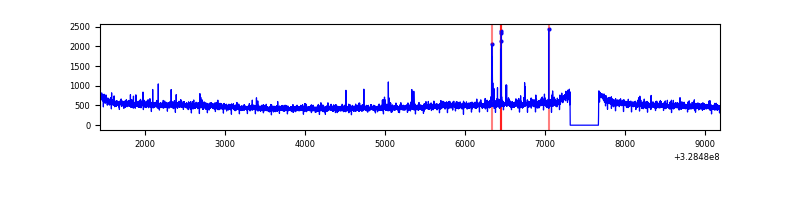 |
| C | 7747 | 7393 | 29 | 29 | 0.37% | 0.39% | 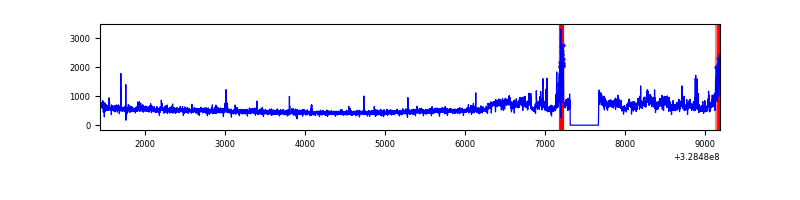 |
| D | 7747 | 7393 | 479 | 479 | 6.18% | 6.48% | 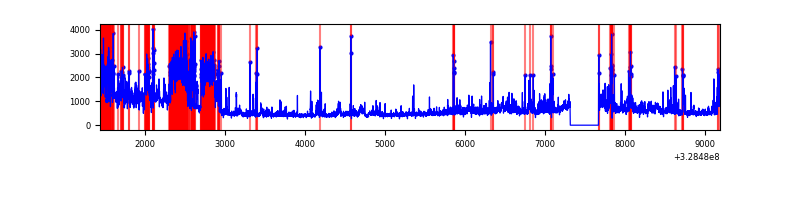 |
Top three noisy pixels from each quadrant. If the there are fewer than three noisy pixels in the level2.evt file, extra rows are filled as -1
| Pixel properties | Quadrant properties | ||||||
|---|---|---|---|---|---|---|---|
| Quadrant | DetID | PixID | Counts | Sigma | Mean | Median | Sigma |
| A | 13 | 254 | 11759 | 57.41 | 930 | 911 | 188.9 |
| A | 3 | 137 | 8609 | 40.74 | 930 | 911 | 188.9 |
| A | 0 | 226 | 7885 | 36.91 | 930 | 911 | 188.9 |
| B | 0 | 190 | 33349 | 183.86 | 923 | 899 | 176.5 |
| B | 12 | 111 | 21854 | 118.73 | 923 | 899 | 176.5 |
| B | 11 | 111 | 19191 | 103.64 | 923 | 899 | 176.5 |
| C | 7 | 247 | 444075 | 2145.6 | 884 | 891 | 206.6 |
| C | 2 | 16 | 228536 | 1102.11 | 884 | 891 | 206.6 |
| C | 14 | 238 | 140868 | 677.68 | 884 | 891 | 206.6 |
| D | 1 | 239 | 1433897 | 6725.78 | 878 | 852 | 213.1 |
| D | 1 | 52 | 249174 | 1165.46 | 878 | 852 | 213.1 |
| D | 12 | 235 | 211666 | 989.42 | 878 | 852 | 213.1 |
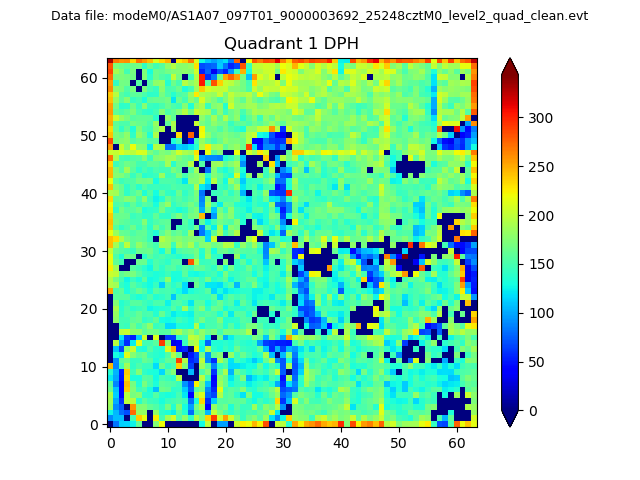
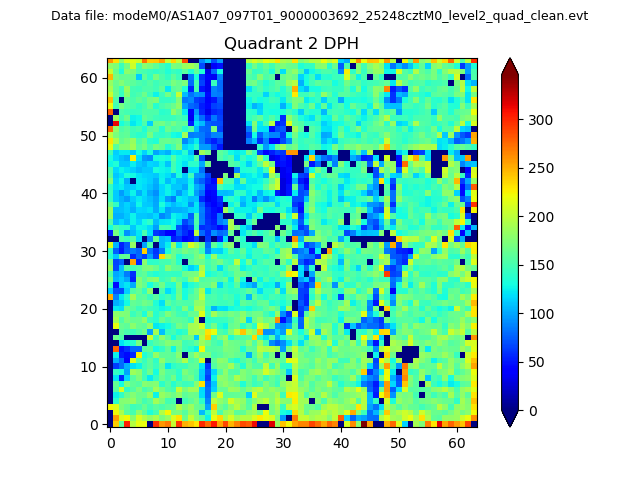
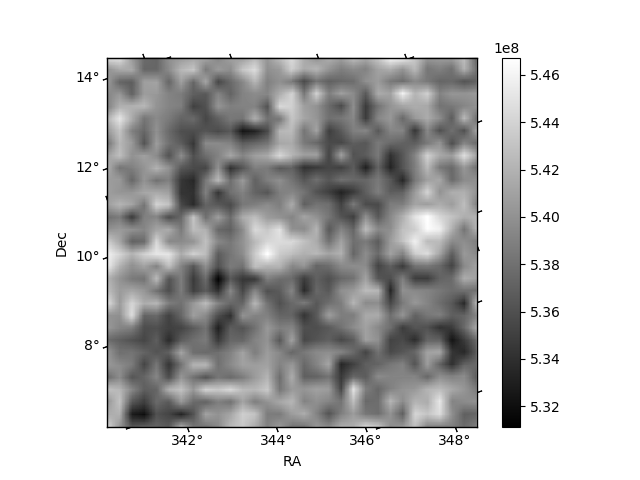
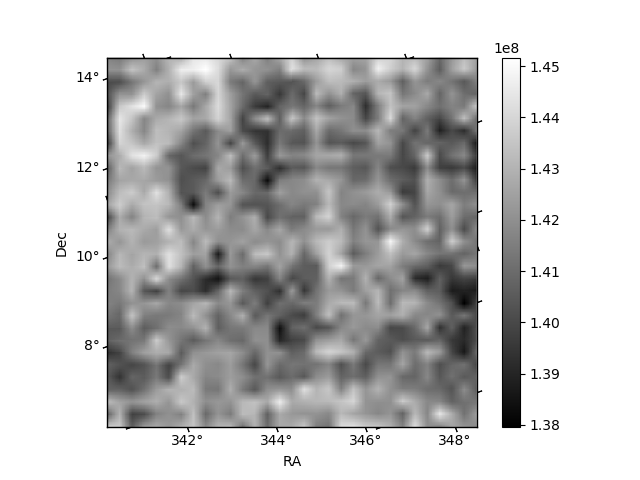
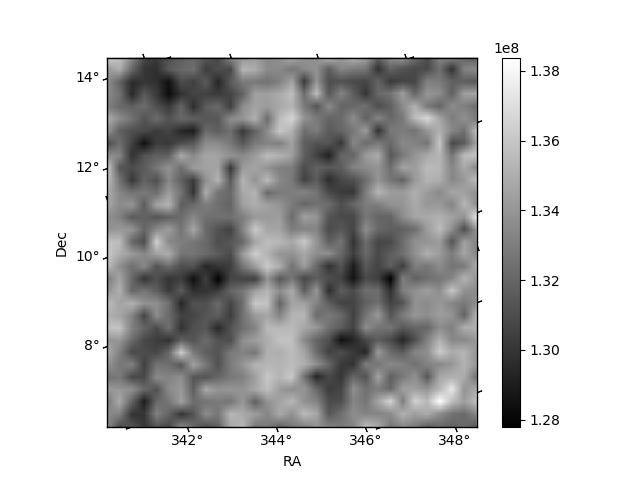
Histogram calculated using DETX and DETY for each event in the final _common_clean file
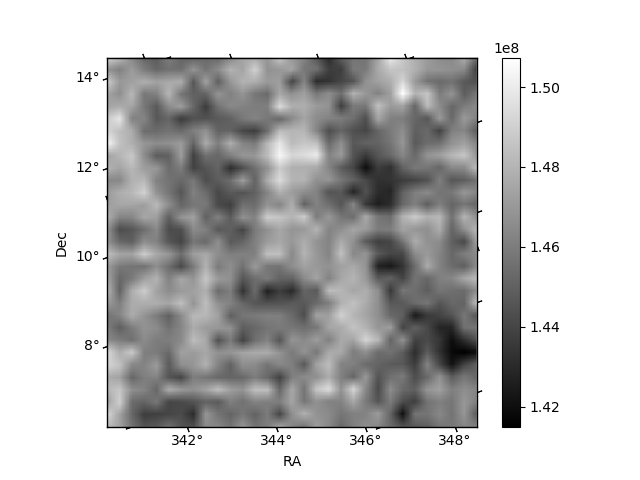
| Quadrant A |  |
 |
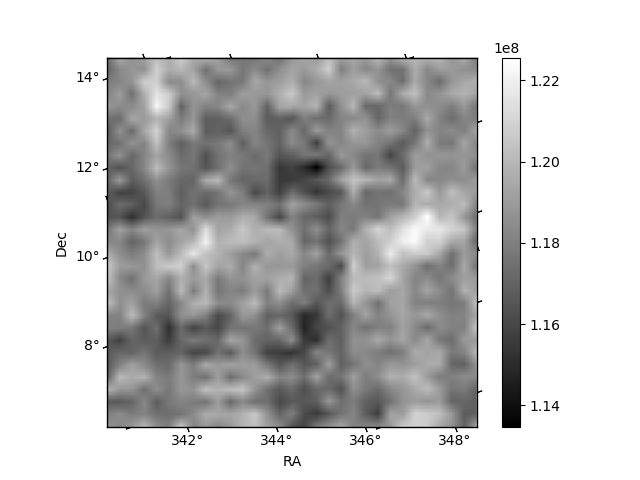
Quadrant B |
|---|---|---|---|
| Quadrant D | 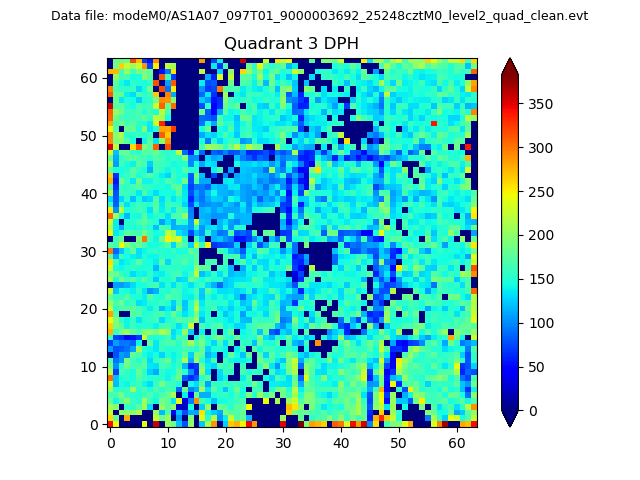 |
 |
Quadrant C |
| Plot type | Count rate plots | Images |
|---|---|---|
| Comparison with Poisson distribution Blue bars denote a histogram of data divided into 1 sec bins. Red curve is a Poisson curve with rate = median count rate of data. |
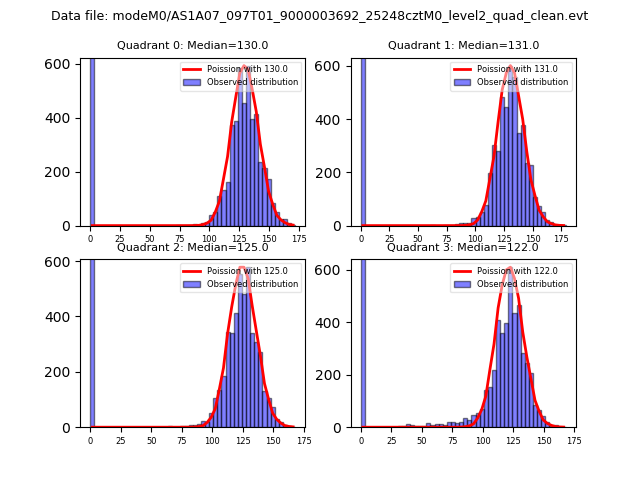 |
 |
| Quadrant-wise count rates Data is divided into 100 sec bins |
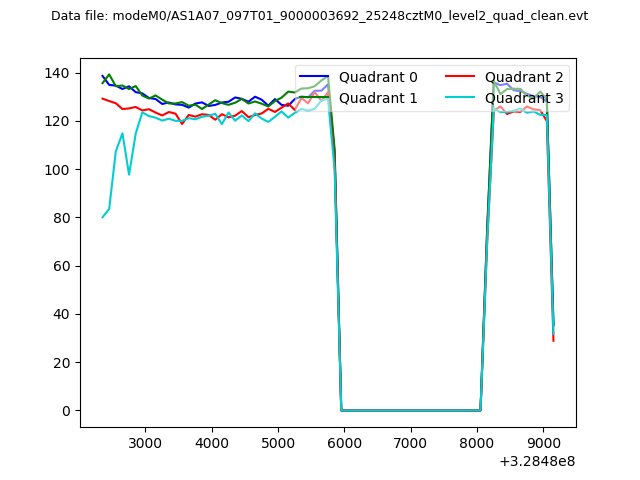 |
|
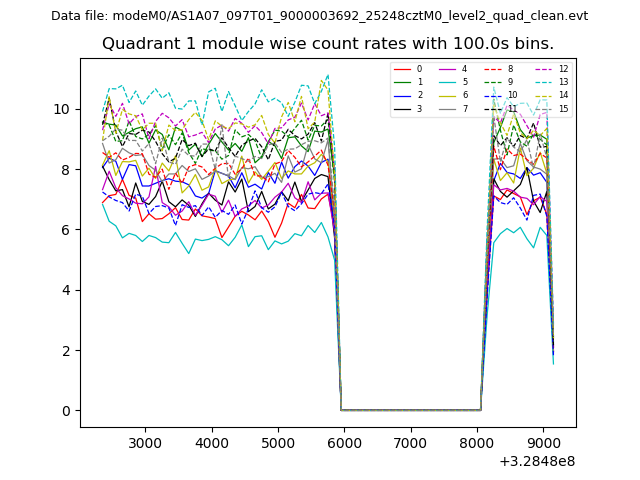
| Module-wise count rates for Quadrant A Data is divided into 100 sec bins |
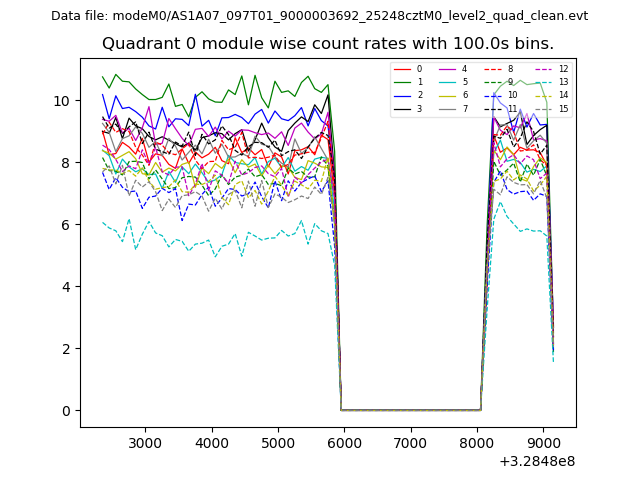 |
 |
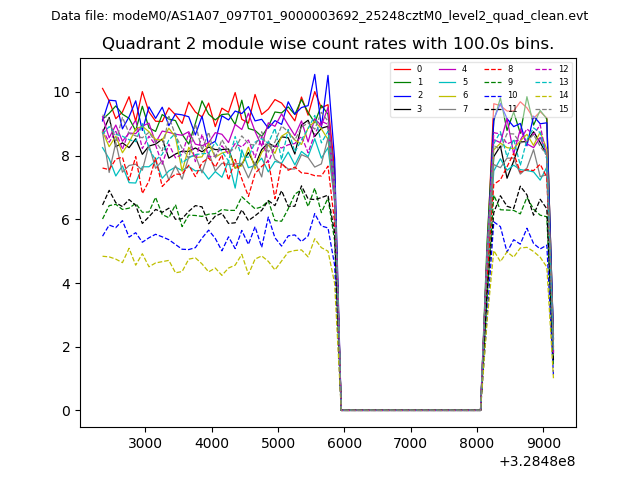
| Module-wise count rates for Quadrant B Data is divided into 100 sec bins |
 |
 |
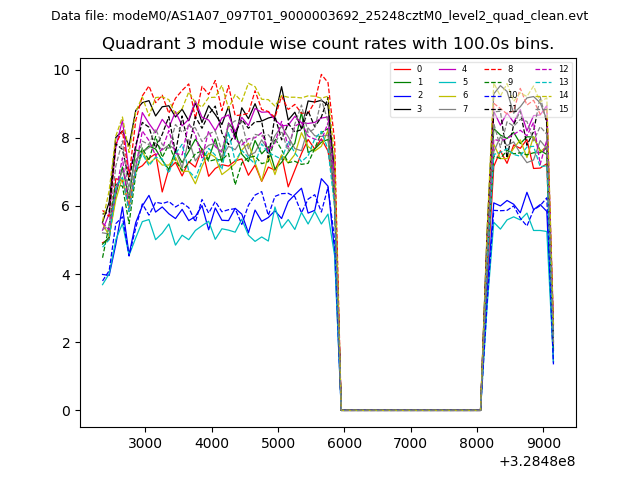
| Module-wise count rates for Quadrant C Data is divided into 100 sec bins |
 |
 |
| Module-wise count rates for Quadrant D Data is divided into 100 sec bins |
 |
 |
| Parameter | Plot |
|---|---|
| CZT HV Monitor | 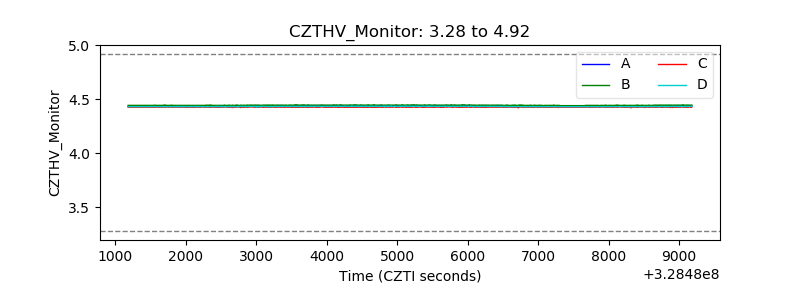 |
| D_VDD | 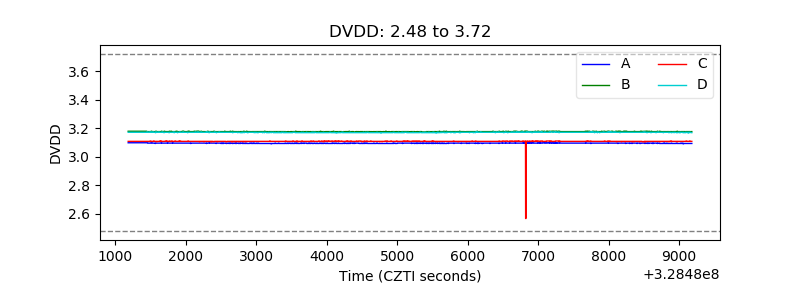 |
| Temperature 1 | 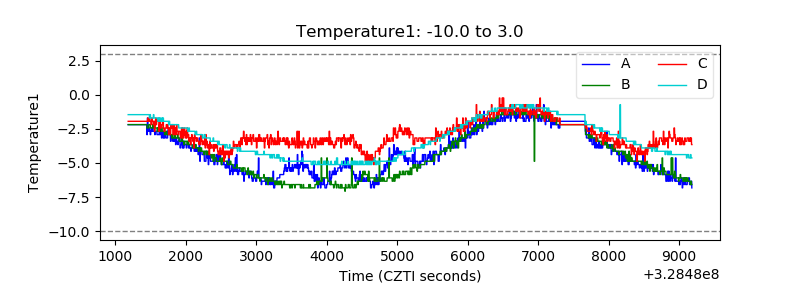 |
| Veto HV Monitor | 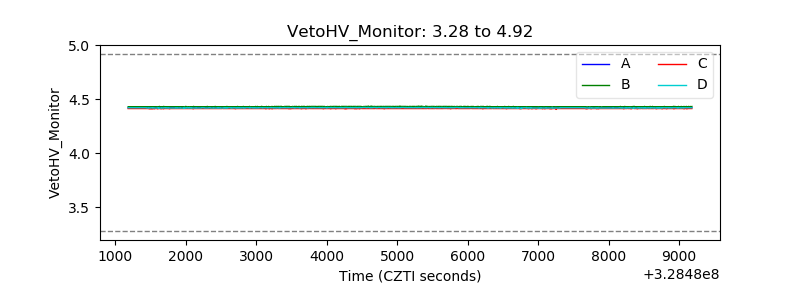 |
| Veto LLD | 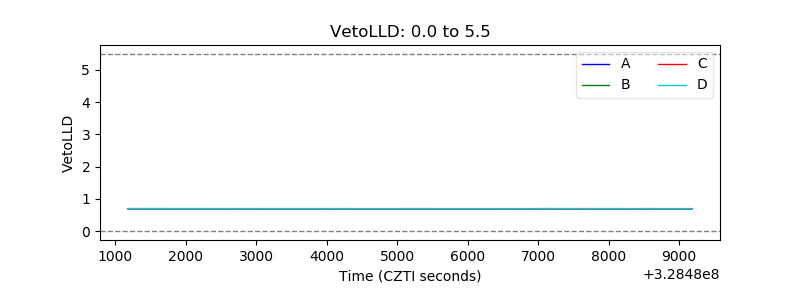 |
| Alpha Counter | 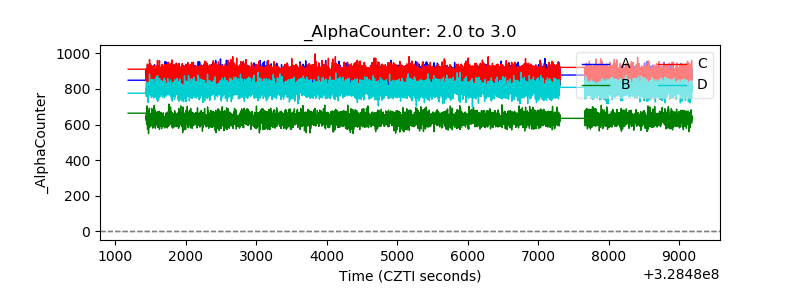 |
| _CPM_Rate | 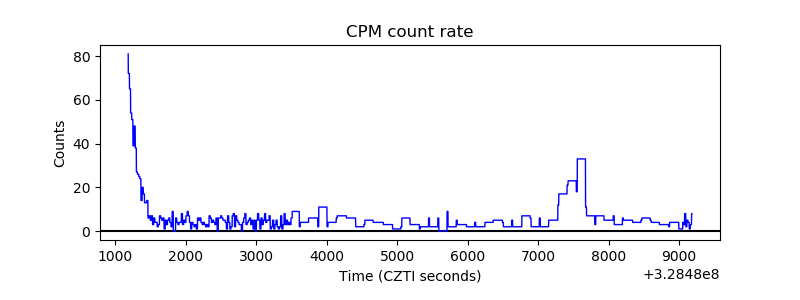 |
| CZT Counter | 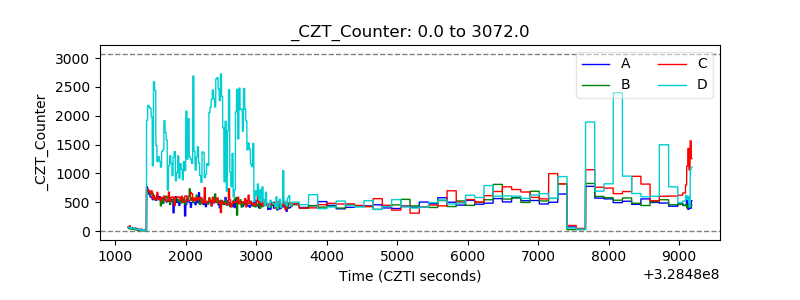 |
| +2.5 Volts monitor |  |
| +5 Volts monitor |  |
| _ROLL_ROT | 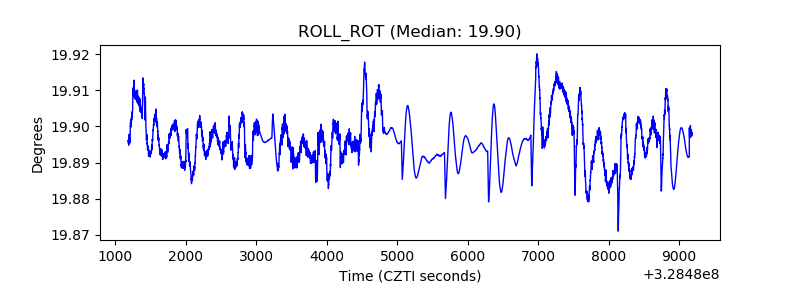 |
| _Roll_DEC | 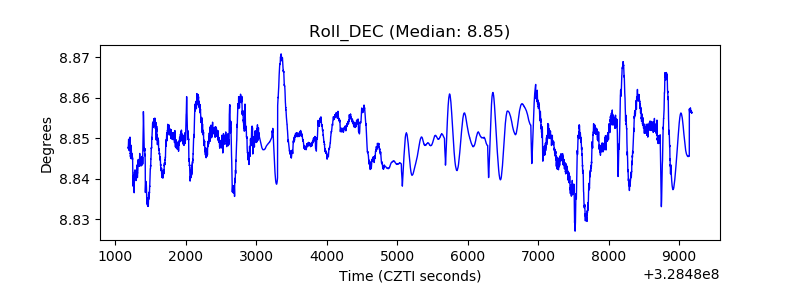 |
| _Roll_RA | 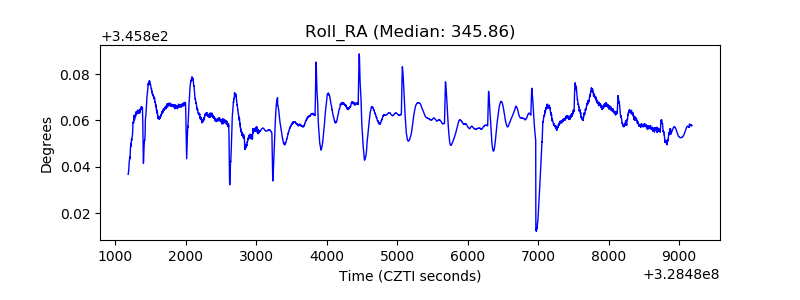 |
| Veto Counter | 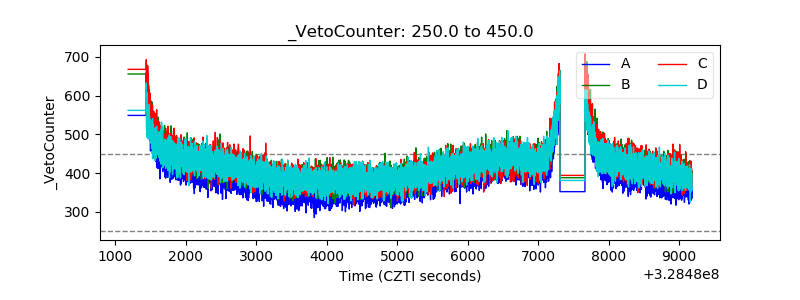 |