| Param | Original file | Final file |
|---|---|---|
| Filename | modeM0/AS1A07_097T01_9000003692_25249cztM0_level2.evt | modeM0/AS1A07_097T01_9000003692_25249cztM0_level2_quad_clean.evt |
| Size (bytes) | 583,200,000 | 78,350,400 |
| Size | 556.2 MB | 74.7 MB |
| Events in quadrant A | 3,394,345 | 489,409 |
| Events in quadrant B | 3,461,346 | 493,210 |
| Events in quadrant C | 4,604,405 | 465,565 |
| Events in quadrant D | 5,740,403 | 449,210 |
| Mode M0 | |||
|---|---|---|---|
| Quadrant | BADHDUFLAG | Total packets | Discarded packets |
| A | 0 | 14418 | 0 |
| B | 0 | 14669 | 0 |
| C | 0 | 18302 | 0 |
| D | 0 | 21726 | 0 |
| Mode M9 | |||
|---|---|---|---|
| Quadrant | BADHDUFLAG | Total packets | Discarded packets |
| A | 0 | 6 | 0 |
| B | 0 | 6 | 0 |
| C | 0 | 6 | 0 |
| D | 0 | 6 | 0 |
| Quadrant | Total seconds | Saturated seconds | Saturation percentage |
|---|---|---|---|
| A | 6809 | 107 | 1.571450% |
| B | 6810 | 153 | 2.246696% |
| C | 6810 | 346 | 5.080764% |
| D | 6810 | 541 | 7.944200% |
Noise dominated data is calculated using 1-second bins in cleaned event files. If a bin has >2000 counts, and if more than 50% of those come from <1% of pixels, then it is considered to be noise-dominated and hence unusable.
| Quadrant | # 1 sec bins | Bins with >0 counts | Bins with >2000 counts | High rate bins dominated by noise | Noise dominated (total time) | Noise dominated (detector-on time) | Marked lightcurve |
|---|---|---|---|---|---|---|---|
| A | 7424 | 6811 | 0 | 0 | 0.00% | 0.00% | 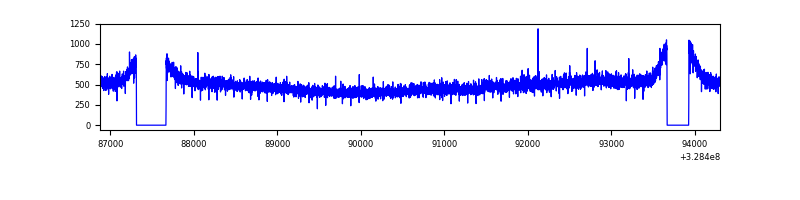 |
| B | 7425 | 6812 | 1 | 1 | 0.01% | 0.01% | 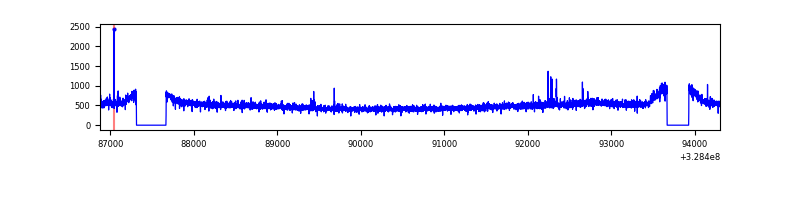 |
| C | 7425 | 6812 | 44 | 44 | 0.59% | 0.65% | 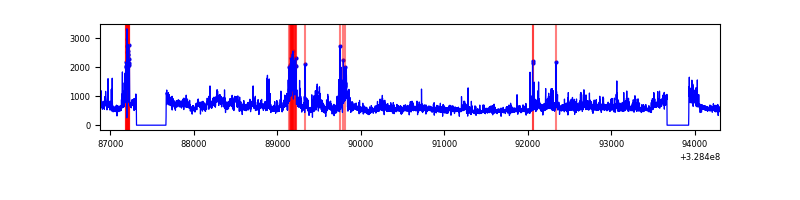 |
| D | 7425 | 6812 | 264 | 264 | 3.56% | 3.88% | 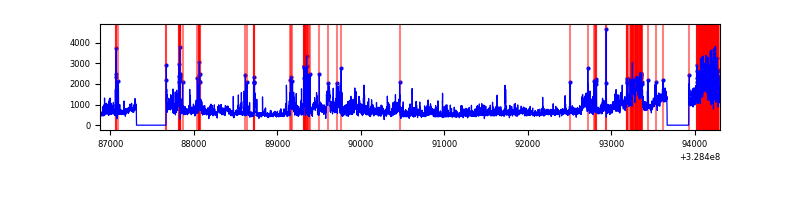 |
Top three noisy pixels from each quadrant. If the there are fewer than three noisy pixels in the level2.evt file, extra rows are filled as -1
| Pixel properties | Quadrant properties | ||||||
|---|---|---|---|---|---|---|---|
| Quadrant | DetID | PixID | Counts | Sigma | Mean | Median | Sigma |
| A | 3 | 1 | 22235 | 121.5 | 872 | 854 | 176.0 |
| A | 13 | 254 | 11352 | 59.66 | 872 | 854 | 176.0 |
| A | 11 | 128 | 9574 | 49.55 | 872 | 854 | 176.0 |
| B | 0 | 190 | 22347 | 128.44 | 865 | 843 | 167.4 |
| B | 12 | 111 | 20715 | 118.7 | 865 | 843 | 167.4 |
| B | 11 | 111 | 17966 | 102.28 | 865 | 843 | 167.4 |
| C | 7 | 247 | 624965 | 3188.37 | 825 | 828 | 195.8 |
| C | 2 | 16 | 477484 | 2434.97 | 825 | 828 | 195.8 |
| C | 14 | 238 | 130046 | 660.1 | 825 | 828 | 195.8 |
| D | 8 | 195 | 708039 | 3495.75 | 825 | 801 | 202.3 |
| D | 1 | 52 | 595020 | 2937.12 | 825 | 801 | 202.3 |
| D | 1 | 239 | 499431 | 2464.64 | 825 | 801 | 202.3 |
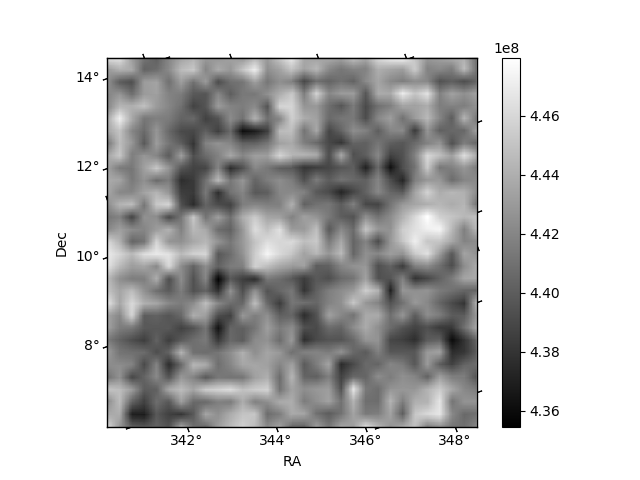
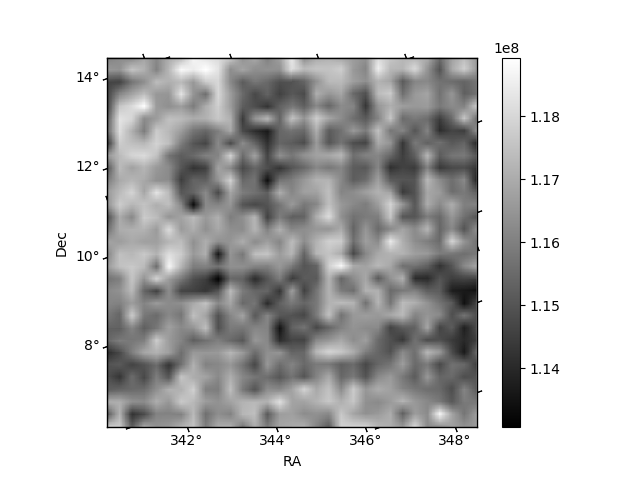
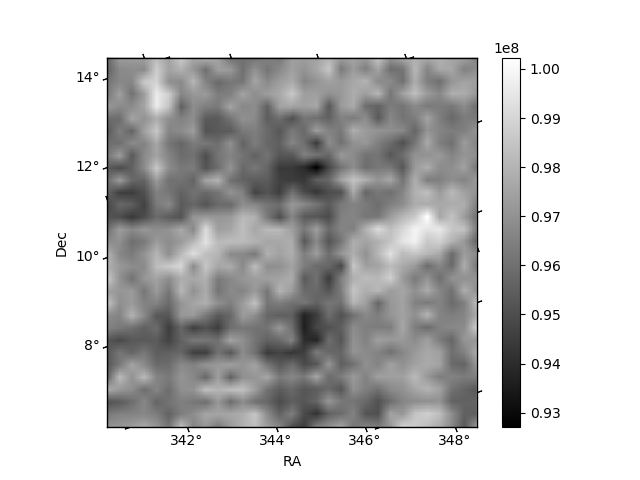
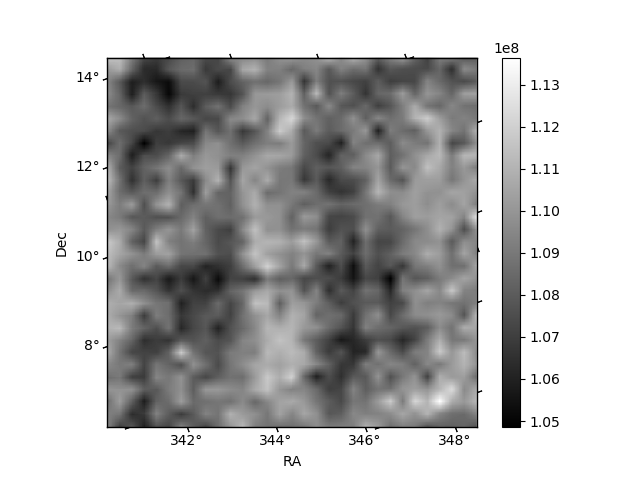
Histogram calculated using DETX and DETY for each event in the final _common_clean file
| Quadrant A |  |
 |
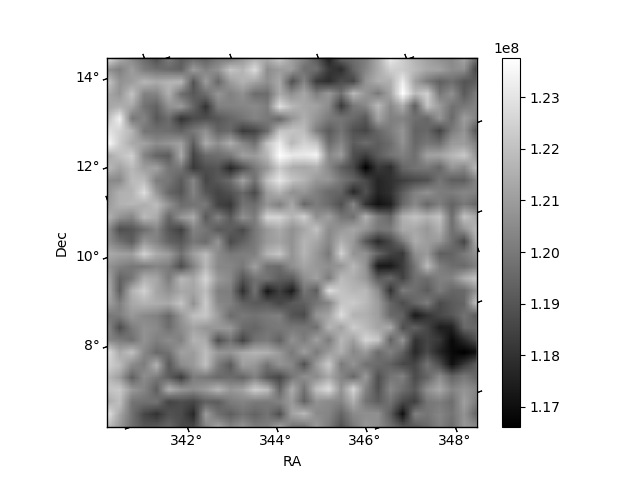
Quadrant B |
|---|---|---|---|
| Quadrant D |  |
 |
Quadrant C |
| Plot type | Count rate plots | Images |
|---|---|---|
| Comparison with Poisson distribution Blue bars denote a histogram of data divided into 1 sec bins. Red curve is a Poisson curve with rate = median count rate of data. |
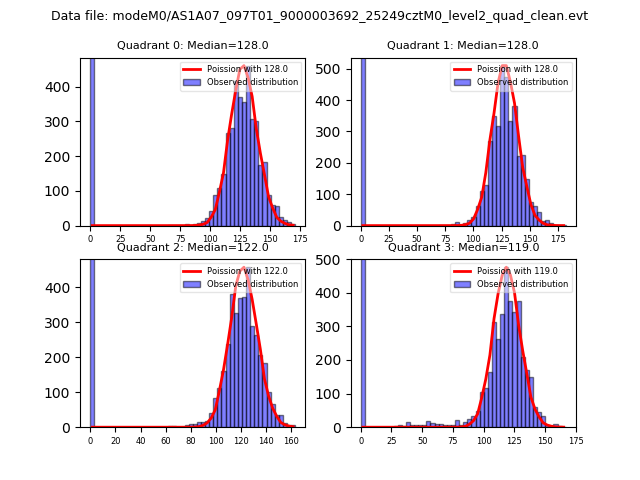 |
 |
| Quadrant-wise count rates Data is divided into 100 sec bins |
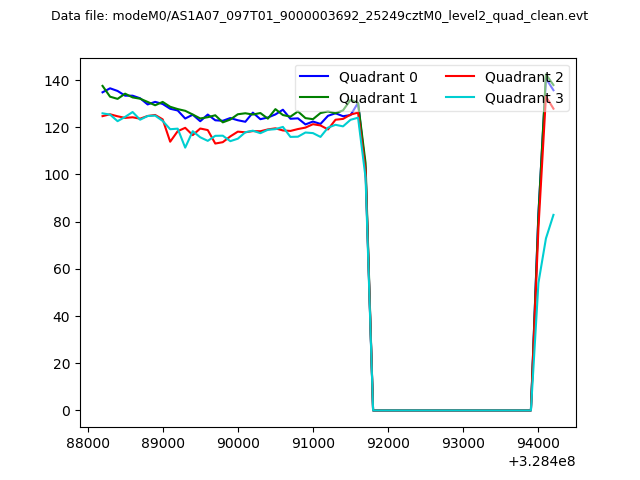 |
|
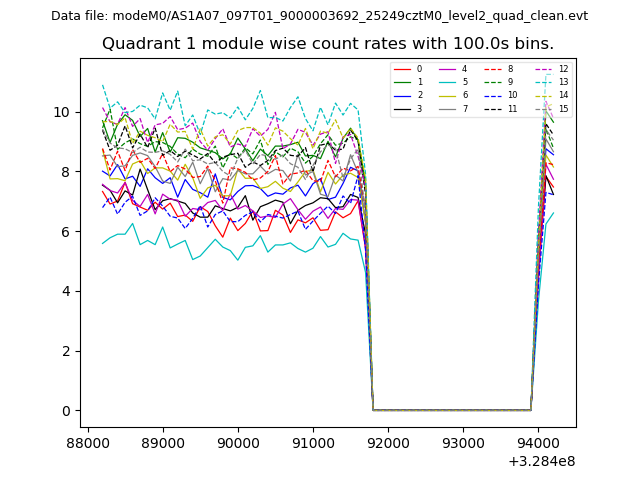
| Module-wise count rates for Quadrant A Data is divided into 100 sec bins |
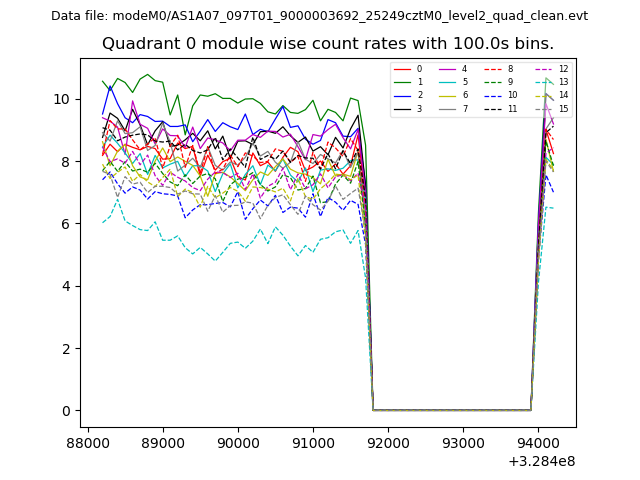 |
 |
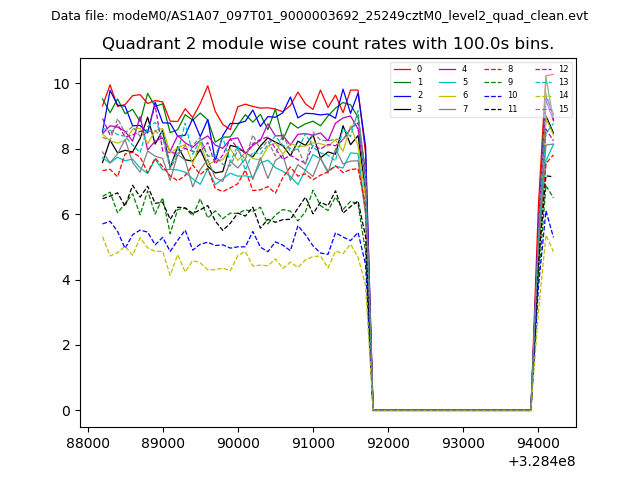
| Module-wise count rates for Quadrant B Data is divided into 100 sec bins |
 |
 |
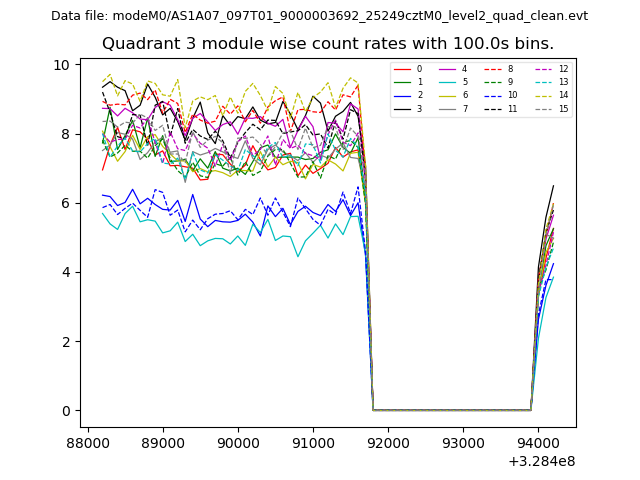
| Module-wise count rates for Quadrant C Data is divided into 100 sec bins |
 |
 |
| Module-wise count rates for Quadrant D Data is divided into 100 sec bins |
 |
 |
| Parameter | Plot |
|---|---|
| CZT HV Monitor | 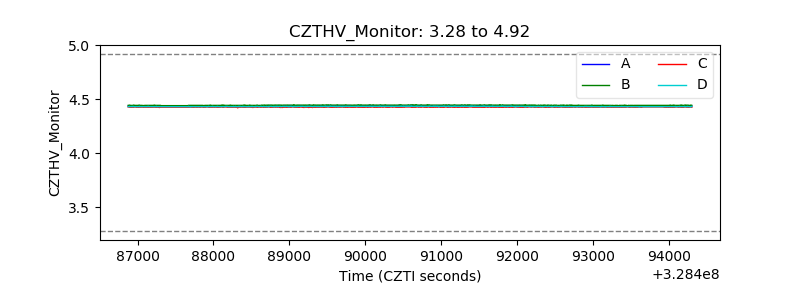 |
| D_VDD | 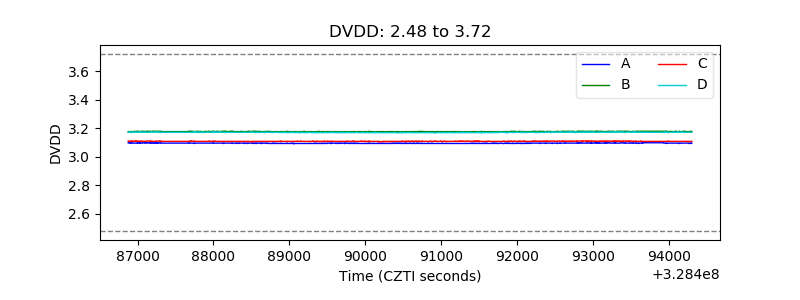 |
| Temperature 1 | 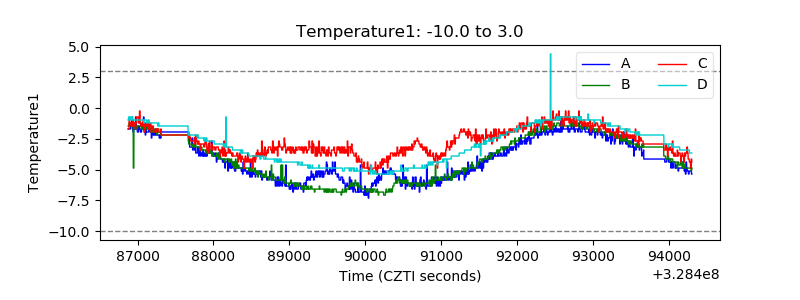 |
| Veto HV Monitor | 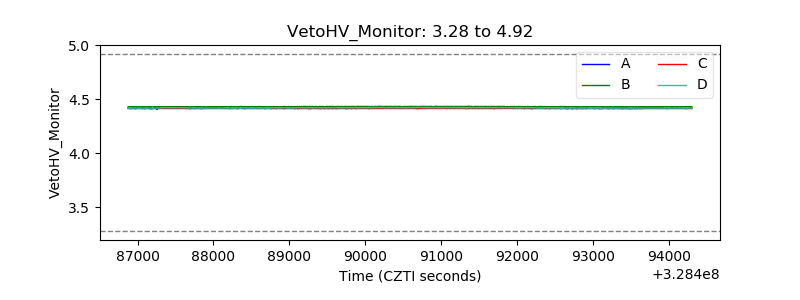 |
| Veto LLD | 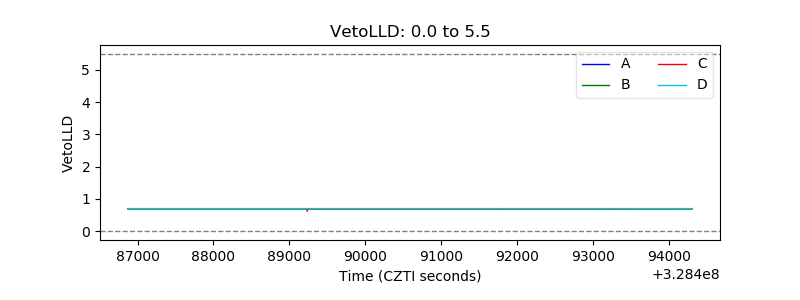 |
| Alpha Counter | 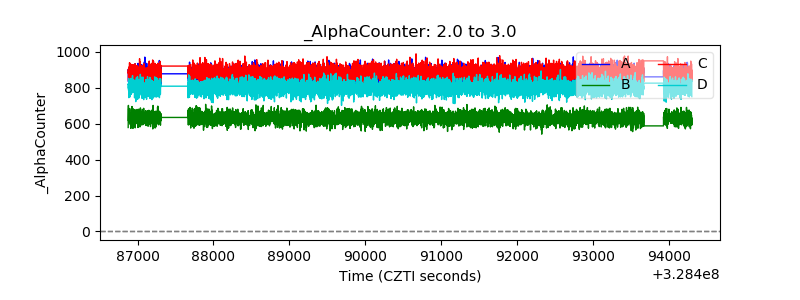 |
| _CPM_Rate | 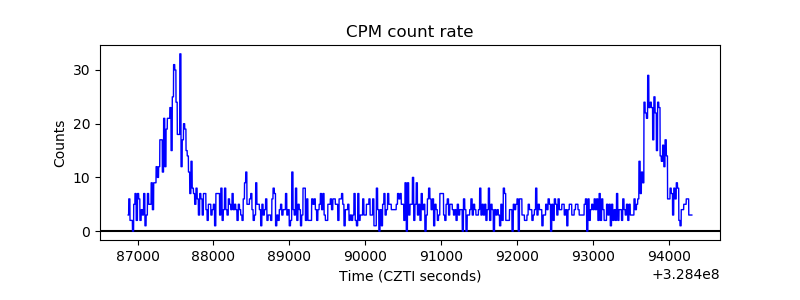 |
| CZT Counter | 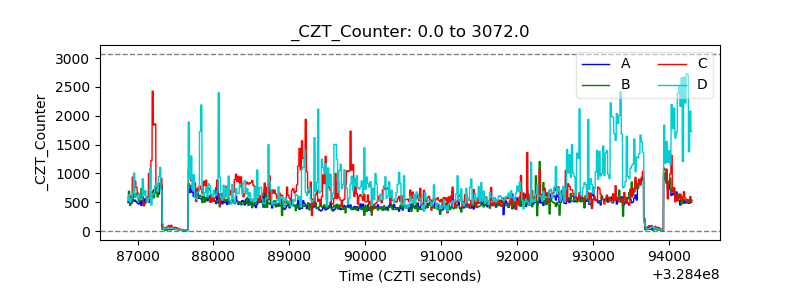 |
| +2.5 Volts monitor |  |
| +5 Volts monitor |  |
| _ROLL_ROT | 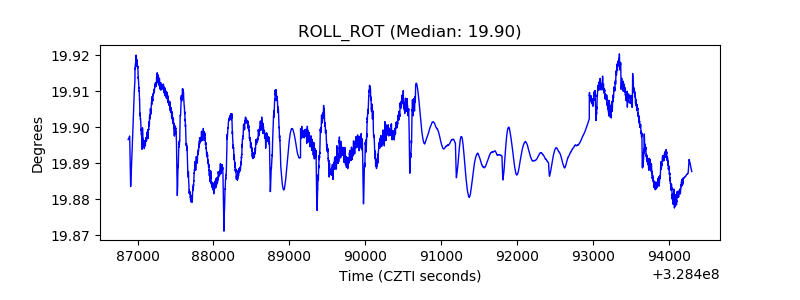 |
| _Roll_DEC | 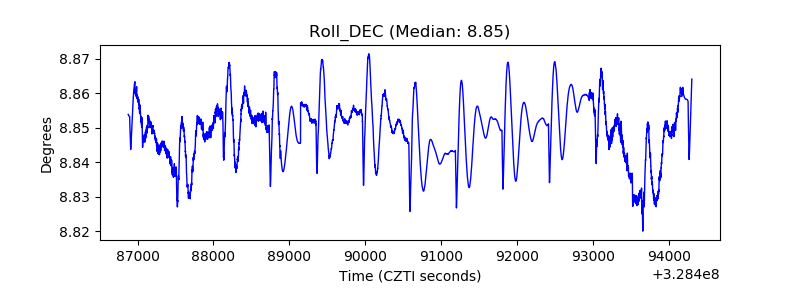 |
| _Roll_RA | 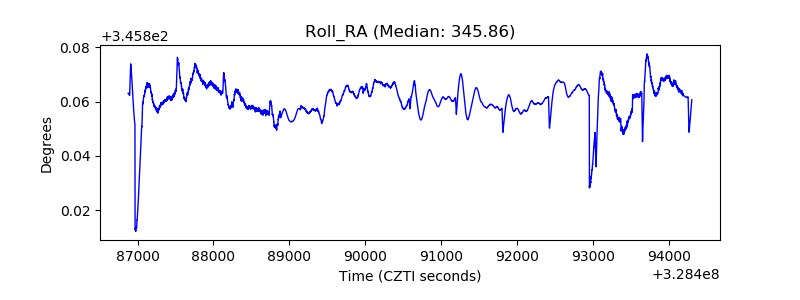 |
| Veto Counter | 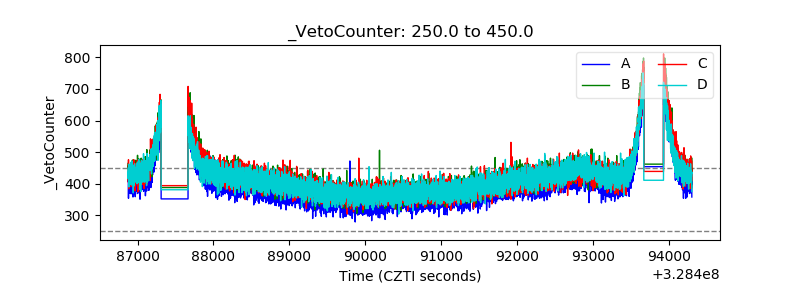 |