| Param | Original file | Final file |
|---|---|---|
| Filename | modeM0/AS1A07_097T01_9000003692_25250cztM0_level2.evt | modeM0/AS1A07_097T01_9000003692_25250cztM0_level2_quad_clean.evt |
| Size (bytes) | 75,919,680 | 5,878,080 |
| Size | 72.4 MB | 5.6 MB |
| Events in quadrant A | 397,475 | 35,950 |
| Events in quadrant B | 423,588 | 36,326 |
| Events in quadrant C | 432,814 | 33,919 |
| Events in quadrant D | 1,001,146 | 21,201 |
| Mode M0 | |||
|---|---|---|---|
| Quadrant | BADHDUFLAG | Total packets | Discarded packets |
| A | 0 | 1576 | 0 |
| B | 0 | 1649 | 0 |
| C | 0 | 1689 | 0 |
| D | 0 | 3385 | 0 |
| Mode M9 | |||
|---|---|---|---|
| Quadrant | BADHDUFLAG | Total packets | Discarded packets |
| A | 0 | 3 | 0 |
| B | 0 | 3 | 0 |
| C | 0 | 3 | 0 |
| D | 0 | 3 | 0 |
| Quadrant | Total seconds | Saturated seconds | Saturation percentage |
|---|---|---|---|
| A | 603 | 63 | 10.447761% |
| B | 604 | 94 | 15.562914% |
| C | 604 | 125 | 20.695364% |
| D | 604 | 342 | 56.622517% |
Noise dominated data is calculated using 1-second bins in cleaned event files. If a bin has >2000 counts, and if more than 50% of those come from <1% of pixels, then it is considered to be noise-dominated and hence unusable.
| Quadrant | # 1 sec bins | Bins with >0 counts | Bins with >2000 counts | High rate bins dominated by noise | Noise dominated (total time) | Noise dominated (detector-on time) | Marked lightcurve |
|---|---|---|---|---|---|---|---|
| A | 863 | 604 | 0 | 0 | 0.00% | 0.00% | 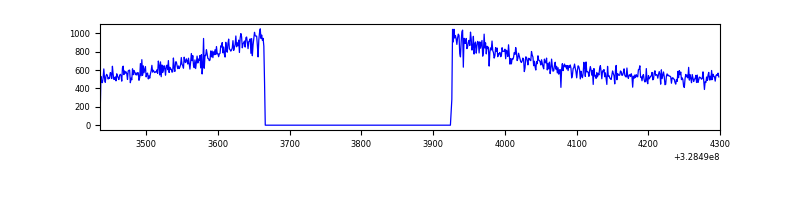 |
| B | 864 | 605 | 0 | 0 | 0.00% | 0.00% | 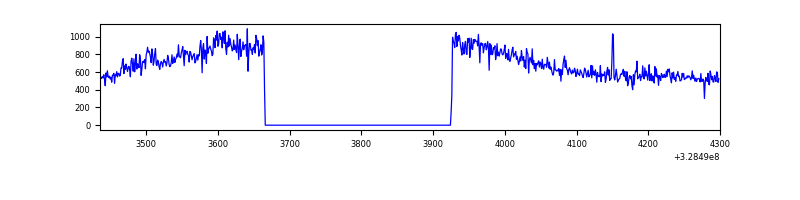 |
| C | 864 | 605 | 0 | 0 | 0.00% | 0.00% | 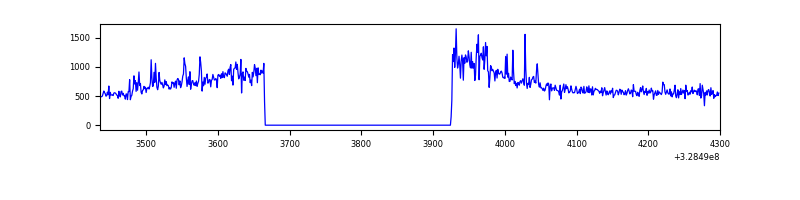 |
| D | 864 | 605 | 156 | 156 | 18.06% | 25.79% | 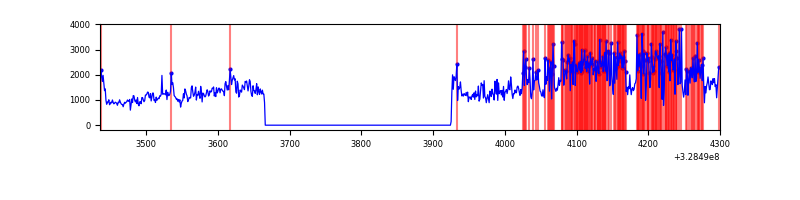 |
Top three noisy pixels from each quadrant. If the there are fewer than three noisy pixels in the level2.evt file, extra rows are filled as -1
| Pixel properties | Quadrant properties | ||||||
|---|---|---|---|---|---|---|---|
| Quadrant | DetID | PixID | Counts | Sigma | Mean | Median | Sigma |
| A | 3 | 137 | 1081 | 41.51 | 103 | 100 | 23.6 |
| A | 13 | 254 | 1043 | 39.9 | 103 | 100 | 23.6 |
| A | 0 | 226 | 909 | 34.23 | 103 | 100 | 23.6 |
| B | 2 | 174 | 16121 | 695.57 | 102 | 99 | 23.0 |
| B | 12 | 111 | 2755 | 115.31 | 102 | 99 | 23.0 |
| B | 11 | 111 | 2292 | 95.21 | 102 | 99 | 23.0 |
| C | 7 | 247 | 24397 | 936.15 | 95 | 95 | 26.0 |
| C | 14 | 238 | 14574 | 557.75 | 95 | 95 | 26.0 |
| C | 3 | 233 | 12122 | 463.3 | 95 | 95 | 26.0 |
| D | 1 | 52 | 343171 | 14517.98 | 83 | 80 | 23.6 |
| D | 8 | 195 | 178392 | 7545.32 | 83 | 80 | 23.6 |
| D | 1 | 239 | 76088 | 3216.3 | 83 | 80 | 23.6 |
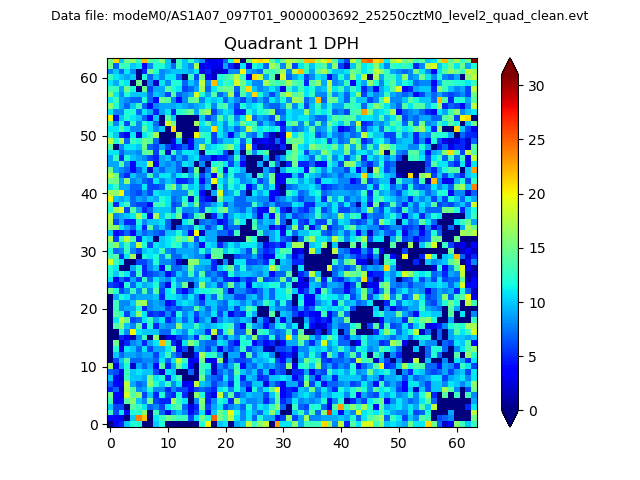
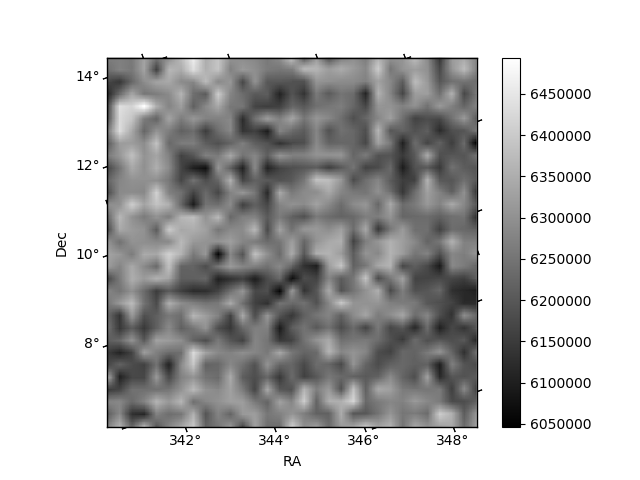
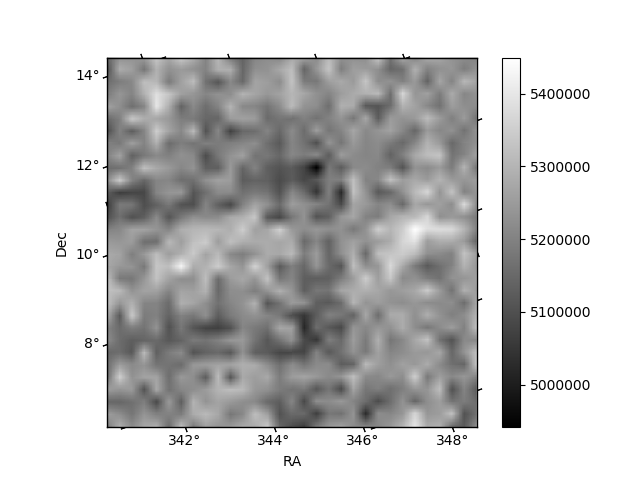
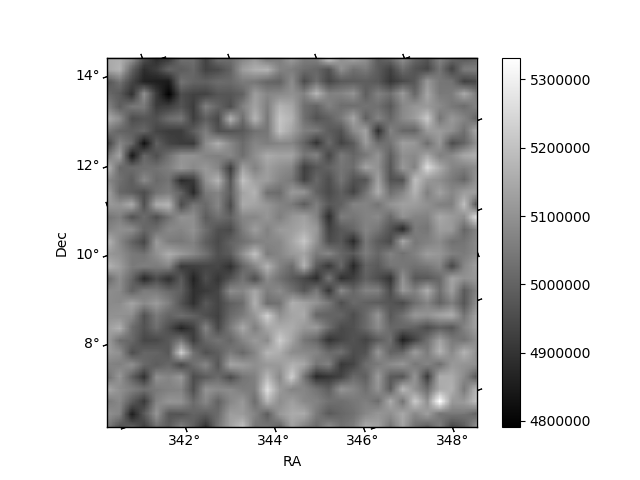
Histogram calculated using DETX and DETY for each event in the final _common_clean file
| Quadrant A |  |
 |
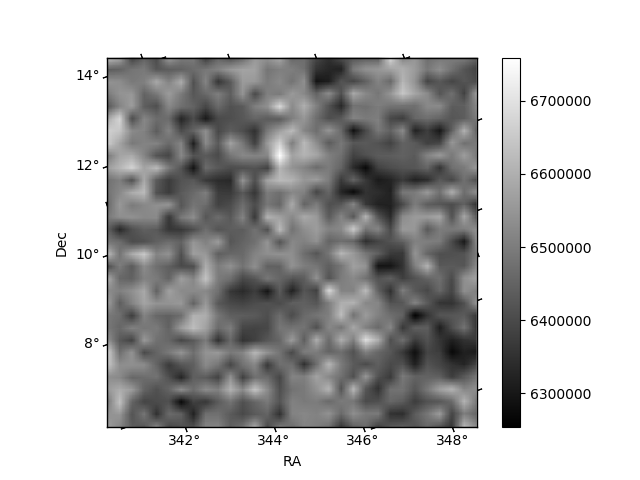
Quadrant B |
|---|---|---|---|
| Quadrant D |  |
 |
Quadrant C |
| Plot type | Count rate plots | Images |
|---|---|---|
| Comparison with Poisson distribution Blue bars denote a histogram of data divided into 1 sec bins. Red curve is a Poisson curve with rate = median count rate of data. |
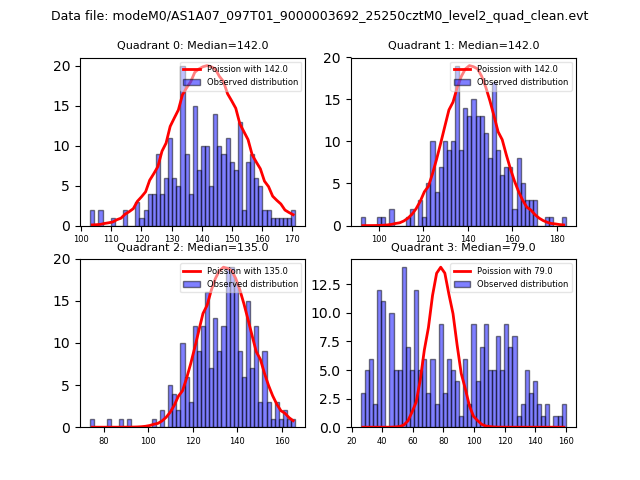 |
 |
| Quadrant-wise count rates Data is divided into 100 sec bins |
 |
|
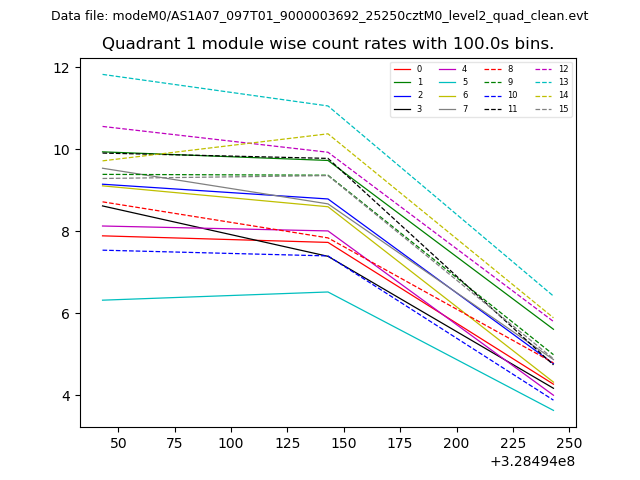
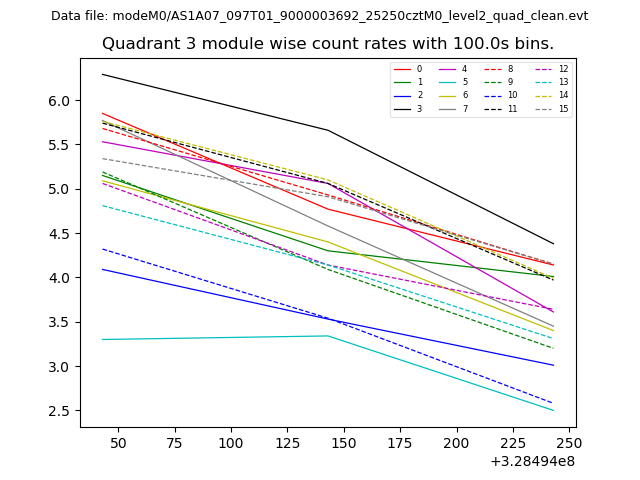
| Module-wise count rates for Quadrant A Data is divided into 100 sec bins |
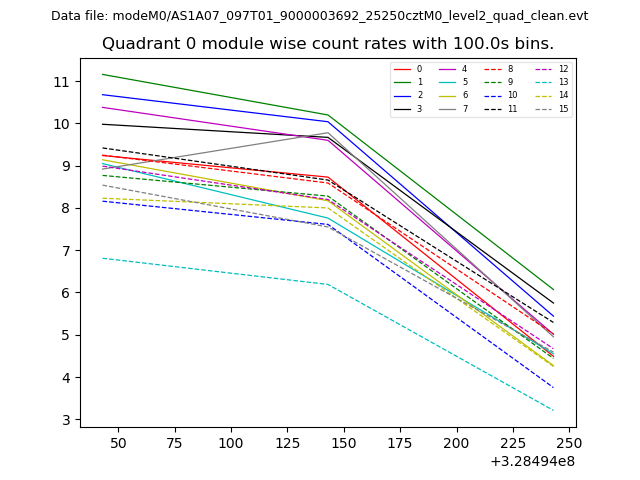 |
 |
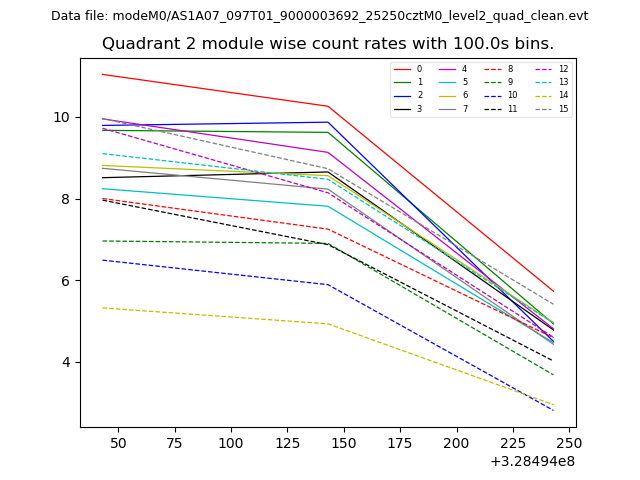
| Module-wise count rates for Quadrant B Data is divided into 100 sec bins |
 |
 |
| Module-wise count rates for Quadrant C Data is divided into 100 sec bins |
 |
 |
| Module-wise count rates for Quadrant D Data is divided into 100 sec bins |
 |
 |
| Parameter | Plot |
|---|---|
| CZT HV Monitor | 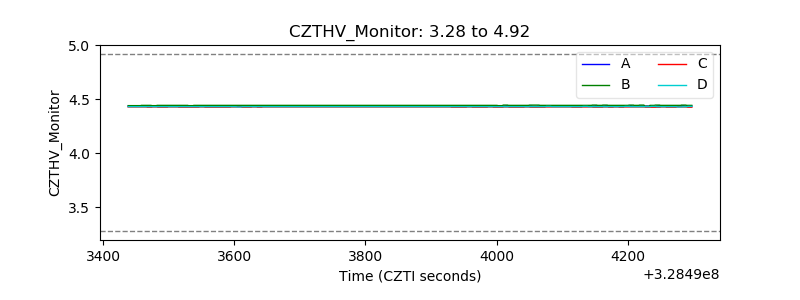 |
| D_VDD | 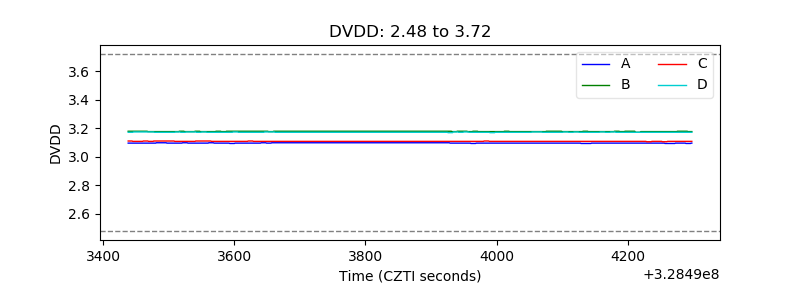 |
| Temperature 1 | 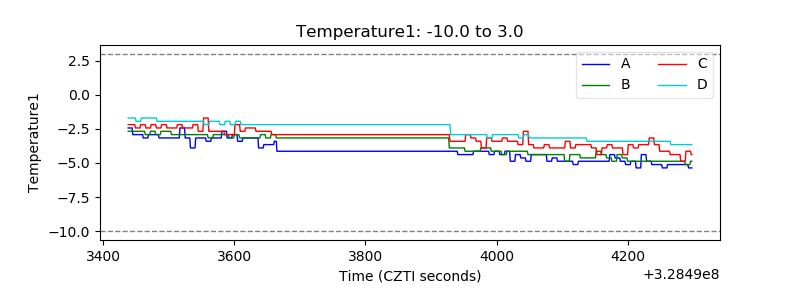 |
| Veto HV Monitor | 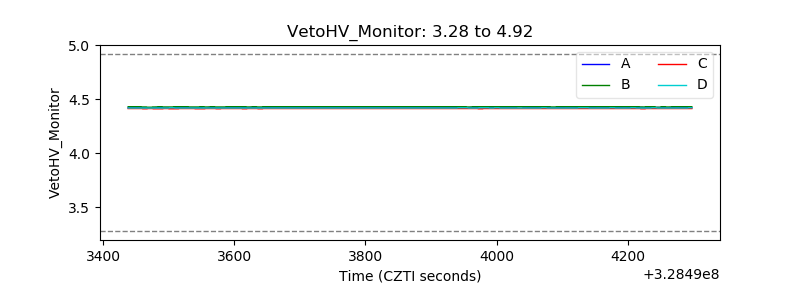 |
| Veto LLD | 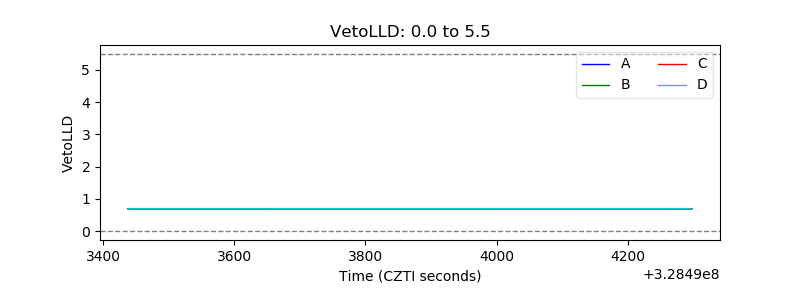 |
| Alpha Counter | 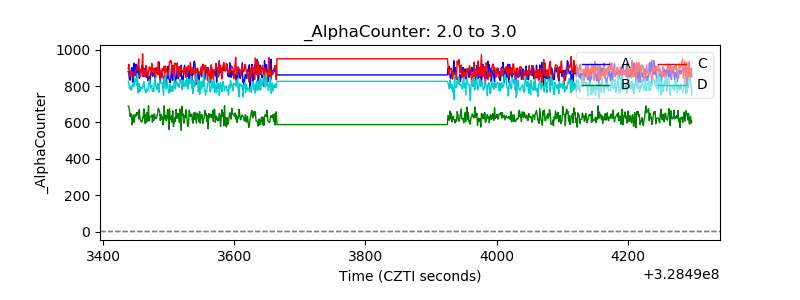 |
| _CPM_Rate | 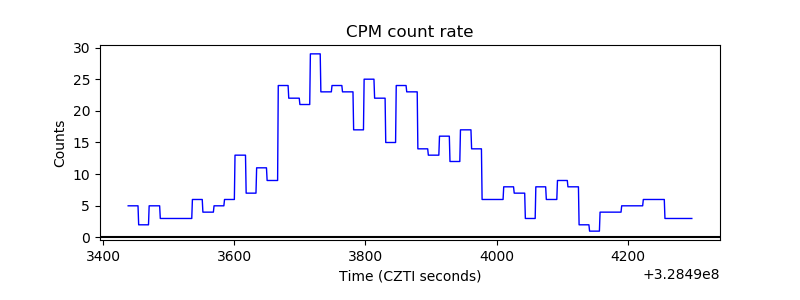 |
| CZT Counter |  |
| +2.5 Volts monitor |  |
| +5 Volts monitor |  |
| _ROLL_ROT | 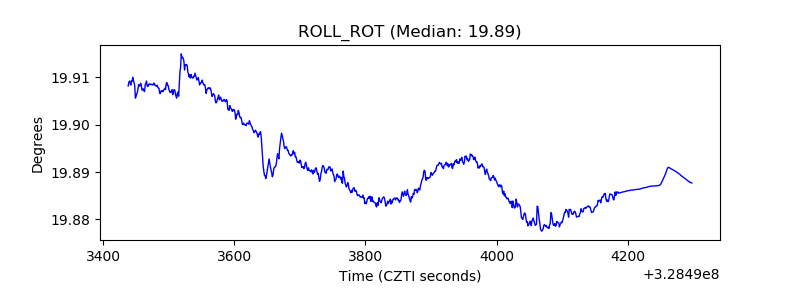 |
| _Roll_DEC | 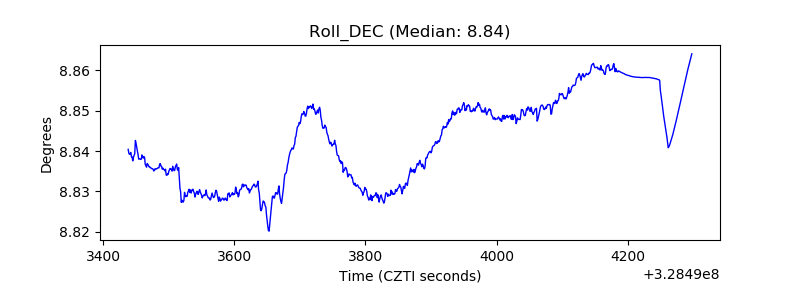 |
| _Roll_RA | 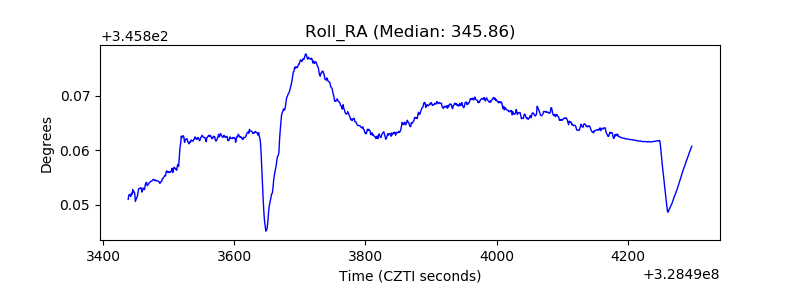 |
| Veto Counter | 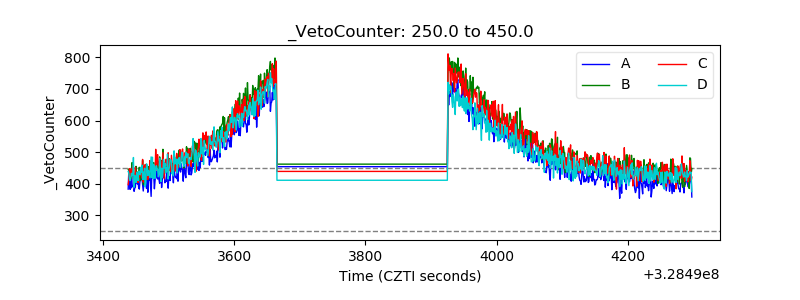 |