| Param | Original file | Final file |
|---|---|---|
| Filename | modeM0/AS1A09_027T01_9000003694cztM0_level2.fits | modeM0/AS1A09_027T01_9000003694cztM0_level2_quad_clean.evt |
| Size (bytes) | 550,103,040 | 464,607,360 |
| Size | 524.6 MB | 443.1 MB |
| Events in quadrant A | 3,666,250 | 3,110,658 |
| Events in quadrant B | 3,457,326 | 3,085,207 |
| Events in quadrant C | 3,414,108 | 2,840,052 |
| Events in quadrant D | 2,101,030 | 1,027,289 |
| Mode M0 | |||
|---|---|---|---|
| Quadrant | BADHDUFLAG | Total packets | Discarded packets |
| A | 0 | 122574 | 0 |
| B | 0 | 129669 | 0 |
| C | 0 | 154501 | 0 |
| D | 0 | 364769 | 0 |
| Mode M9 | |||
|---|---|---|---|
| Quadrant | BADHDUFLAG | Total packets | Discarded packets |
| A | 0 | 110 | 0 |
| B | 0 | 110 | 0 |
| C | 0 | 110 | 0 |
| D | 0 | 110 | 0 |
| Mode SS | |||
|---|---|---|---|
| Quadrant | BADHDUFLAG | Total packets | Discarded packets |
| A | 0 | 1190 | 0 |
| B | 0 | 1190 | 0 |
| C | 0 | 1190 | 0 |
| D | 0 | 1190 | 0 |
| Quadrant | Total seconds | Saturated seconds | Saturation percentage |
|---|---|---|---|
| A | 58383 | 504 | 0.863265% |
| B | 58383 | 943 | 1.615196% |
| C | 58383 | 3797 | 6.503606% |
| D | 58383 | 31081 | 53.236387% |
Noise dominated data is calculated using 1-second bins in cleaned event files. If a bin has >2000 counts, and if more than 50% of those come from <1% of pixels, then it is considered to be noise-dominated and hence unusable.
| Quadrant | # 1 sec bins | Bins with >0 counts | Bins with >2000 counts | High rate bins dominated by noise | Noise dominated (total time) | Noise dominated (detector-on time) | Marked lightcurve |
|---|---|---|---|---|---|---|---|
| A | 69408 | 58382 | 0 | 0 | 0.00% | 0.00% |  |
| B | 69408 | 58381 | 0 | 0 | 0.00% | 0.00% |  |
| C | 69408 | 58361 | 0 | 0 | 0.00% | 0.00% | 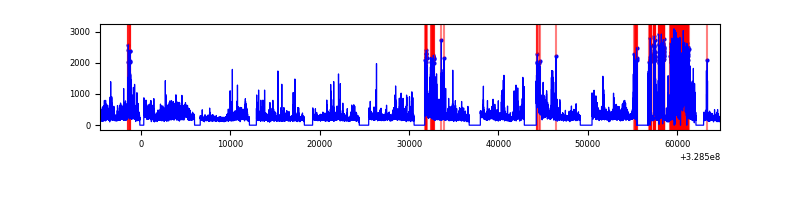 |
| D | 69408 | 55589 | 0 | 0 | 0.00% | 0.00% | 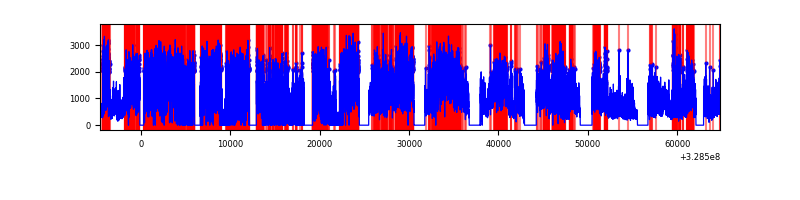 |
Top three noisy pixels from each quadrant. If the there are fewer than three noisy pixels in the level2.evt file, extra rows are filled as -1
| Pixel properties | Quadrant properties | ||||||
|---|---|---|---|---|---|---|---|
| Quadrant | DetID | PixID | Counts | Sigma | Mean | Median | Sigma |
| A | 0 | 29 | 3643 | 11.87 | 956 | 905 | 230.6 |
| A | 7 | 110 | 3009 | 9.12 | 956 | 905 | 230.6 |
| A | 0 | 30 | 2839 | 8.39 | 956 | 905 | 230.6 |
| B | 2 | 9 | 2800 | 10.81 | 917 | 882 | 177.5 |
| B | 2 | 8 | 2325 | 8.13 | 917 | 882 | 177.5 |
| B | 5 | 128 | 2227 | 7.58 | 917 | 882 | 177.5 |
| C | 12 | 241 | 2389 | 6.76 | 902 | 851 | 227.4 |
| C | 3 | 126 | 2379 | 6.72 | 902 | 851 | 227.4 |
| C | 3 | 187 | 2314 | 6.43 | 902 | 851 | 227.4 |
| D | 4 | 246 | 1660 | 6.99 | 600 | 552 | 158.5 |
| D | 10 | 189 | 1492 | 5.93 | 600 | 552 | 158.5 |
| D | 7 | 3 | 1474 | 5.82 | 600 | 552 | 158.5 |
Histogram calculated using DETX and DETY for each event in the final _common_clean file
| Quadrant A |  |
 |
Quadrant B |
|---|---|---|---|
| Quadrant D | 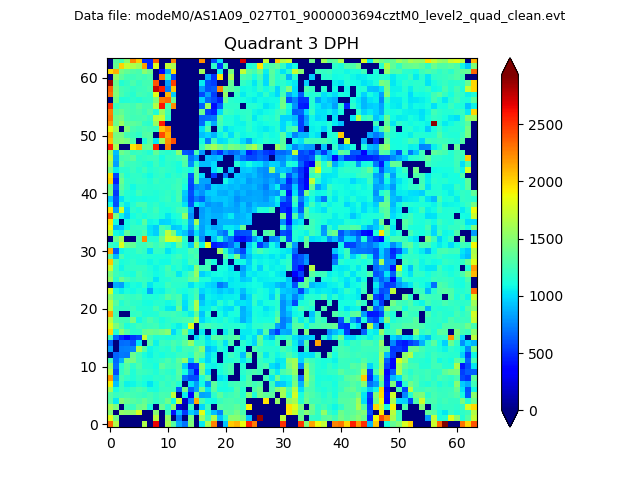 |
 |
Quadrant C |
| Plot type | Count rate plots | Images |
|---|---|---|
| Comparison with Poisson distribution Blue bars denote a histogram of data divided into 1 sec bins. Red curve is a Poisson curve with rate = median count rate of data. |
 |
 |
| Quadrant-wise count rates Data is divided into 100 sec bins |
 |
|
| Module-wise count rates for Quadrant A Data is divided into 100 sec bins |
 |
 |
| Module-wise count rates for Quadrant B Data is divided into 100 sec bins |
 |
 |
| Module-wise count rates for Quadrant C Data is divided into 100 sec bins |
 |
 |
| Module-wise count rates for Quadrant D Data is divided into 100 sec bins |
 |
 |
| Parameter | Plot |
|---|---|
| CZT HV Monitor | 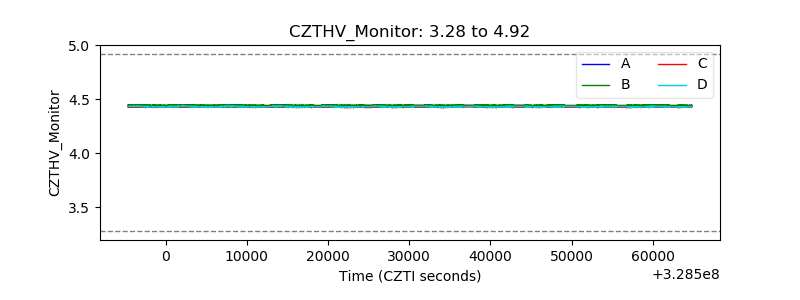 |
| D_VDD |  |
| Temperature 1 |  |
| Veto HV Monitor |  |
| Veto LLD |  |
| Alpha Counter |  |
| _CPM_Rate |  |
| CZT Counter |  |
| +2.5 Volts monitor |  |
| +5 Volts monitor |  |
| _ROLL_ROT |  |
| _Roll_DEC |  |
| _Roll_RA |  |
| Veto Counter |  |