| Param | Original file | Final file |
|---|---|---|
| Filename | modeM0/AS1A09_027T01_9000003694_25250cztM0_level2.evt | modeM0/AS1A09_027T01_9000003694_25250cztM0_level2_quad_clean.evt |
| Size (bytes) | 668,422,080 | 79,223,040 |
| Size | 637.5 MB | 75.6 MB |
| Events in quadrant A | 2,766,176 | 534,232 |
| Events in quadrant B | 2,946,582 | 540,471 |
| Events in quadrant C | 3,724,610 | 509,587 |
| Events in quadrant D | 10,396,466 | 391,430 |
| Mode M0 | |||
|---|---|---|---|
| Quadrant | BADHDUFLAG | Total packets | Discarded packets |
| A | 0 | 12266 | 0 |
| B | 0 | 12766 | 0 |
| C | 0 | 15163 | 0 |
| D | 0 | 35086 | 0 |
| Mode M9 | |||
|---|---|---|---|
| Quadrant | BADHDUFLAG | Total packets | Discarded packets |
| A | 0 | 5 | 0 |
| B | 0 | 5 | 0 |
| C | 0 | 5 | 0 |
| D | 0 | 5 | 0 |
| Quadrant | Total seconds | Saturated seconds | Saturation percentage |
|---|---|---|---|
| A | 6052 | 40 | 0.660939% |
| B | 6052 | 64 | 1.057502% |
| C | 6052 | 168 | 2.775942% |
| D | 6052 | 2781 | 45.951751% |
Noise dominated data is calculated using 1-second bins in cleaned event files. If a bin has >2000 counts, and if more than 50% of those come from <1% of pixels, then it is considered to be noise-dominated and hence unusable.
| Quadrant | # 1 sec bins | Bins with >0 counts | Bins with >2000 counts | High rate bins dominated by noise | Noise dominated (total time) | Noise dominated (detector-on time) | Marked lightcurve |
|---|---|---|---|---|---|---|---|
| A | 6502 | 6053 | 0 | 0 | 0.00% | 0.00% | 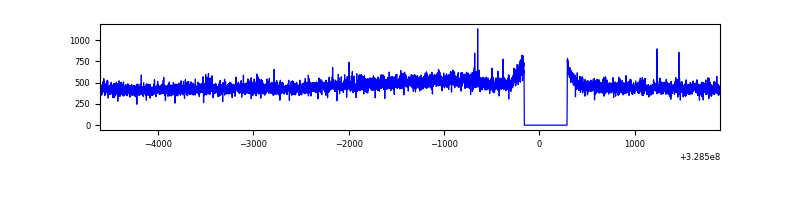 |
| B | 6502 | 6053 | 7 | 7 | 0.11% | 0.12% | 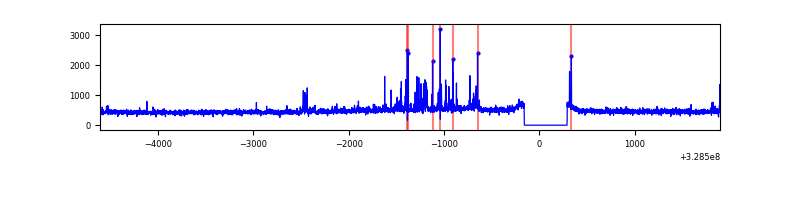 |
| C | 6502 | 6053 | 32 | 32 | 0.49% | 0.53% | 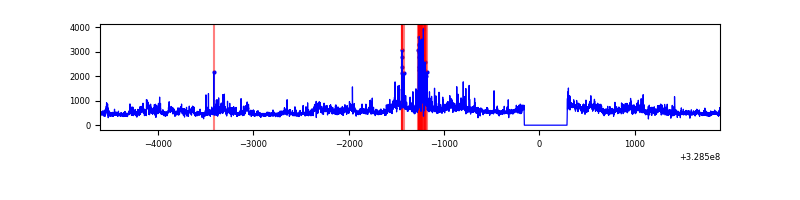 |
| D | 6502 | 6052 | 2405 | 2405 | 36.99% | 39.74% | 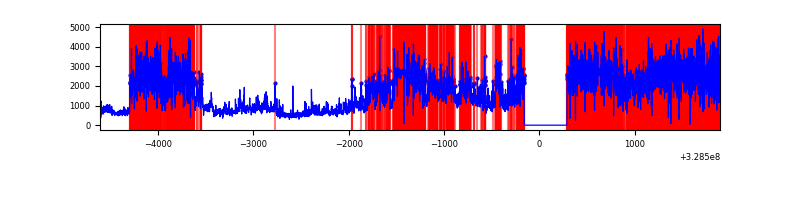 |
Top three noisy pixels from each quadrant. If the there are fewer than three noisy pixels in the level2.evt file, extra rows are filled as -1
| Pixel properties | Quadrant properties | ||||||
|---|---|---|---|---|---|---|---|
| Quadrant | DetID | PixID | Counts | Sigma | Mean | Median | Sigma |
| A | 13 | 254 | 9522 | 60.2 | 716 | 699 | 146.6 |
| A | 3 | 137 | 6506 | 39.62 | 716 | 699 | 146.6 |
| A | 0 | 226 | 6201 | 37.54 | 716 | 699 | 146.6 |
| B | 0 | 229 | 92600 | 670.35 | 713 | 694 | 137.1 |
| B | 0 | 190 | 38587 | 276.39 | 713 | 694 | 137.1 |
| B | 12 | 111 | 16588 | 115.93 | 713 | 694 | 137.1 |
| C | 7 | 247 | 577479 | 3568.78 | 685 | 689 | 161.6 |
| C | 2 | 16 | 220642 | 1360.92 | 685 | 689 | 161.6 |
| C | 3 | 233 | 116085 | 713.99 | 685 | 689 | 161.6 |
| D | 1 | 239 | 6665655 | 50955.6 | 534 | 518 | 130.8 |
| D | 8 | 195 | 781678 | 5972.04 | 534 | 518 | 130.8 |
| D | 9 | 35 | 494942 | 3779.92 | 534 | 518 | 130.8 |
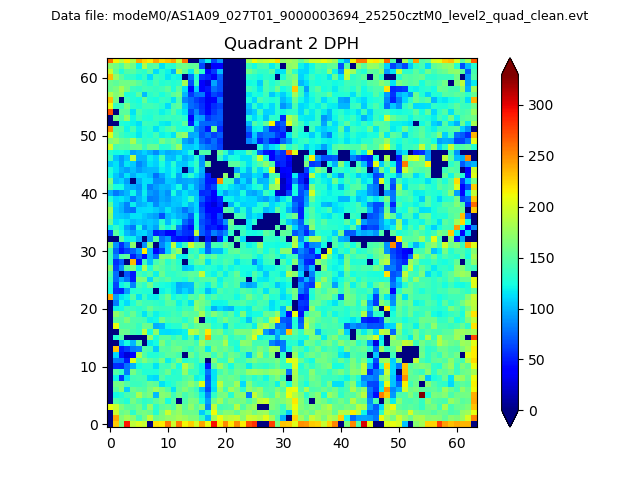
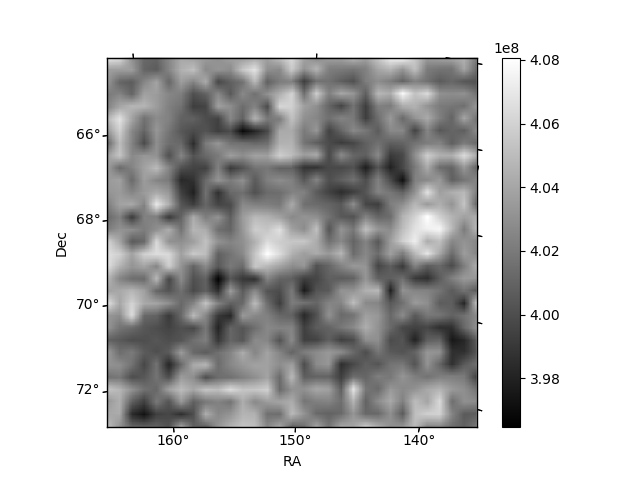
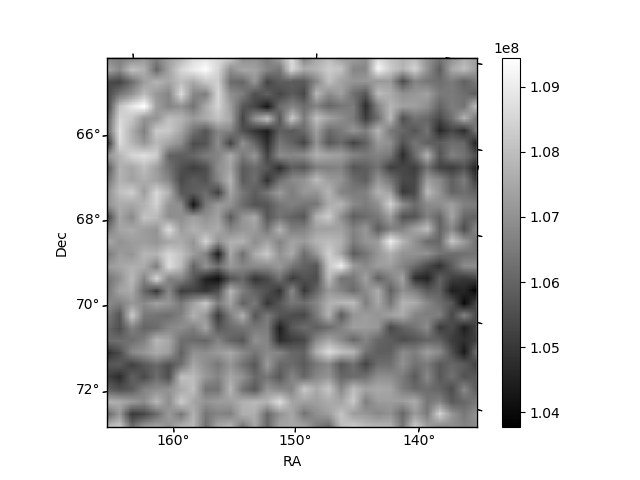
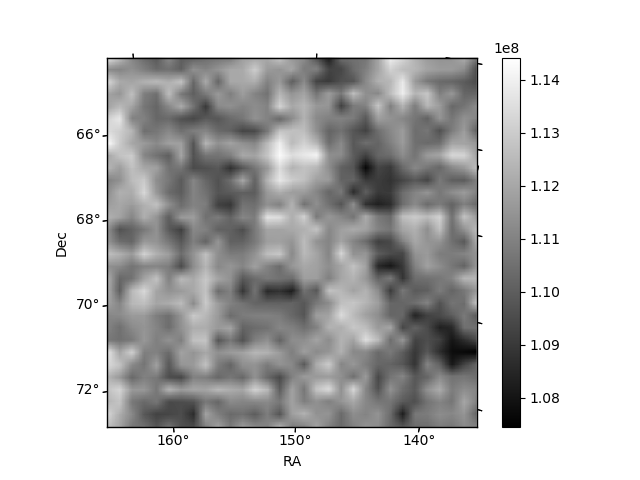
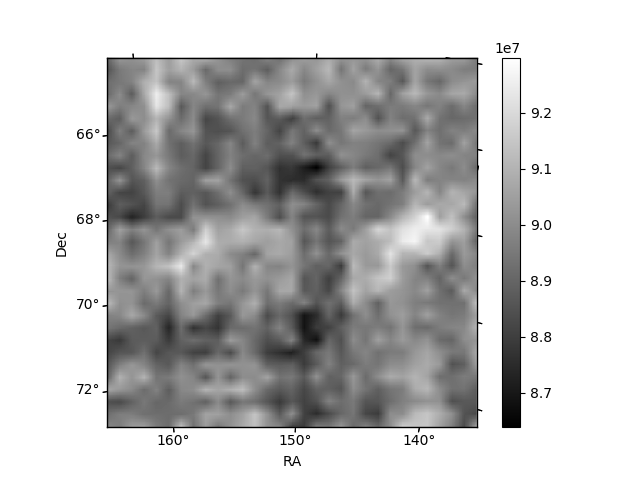
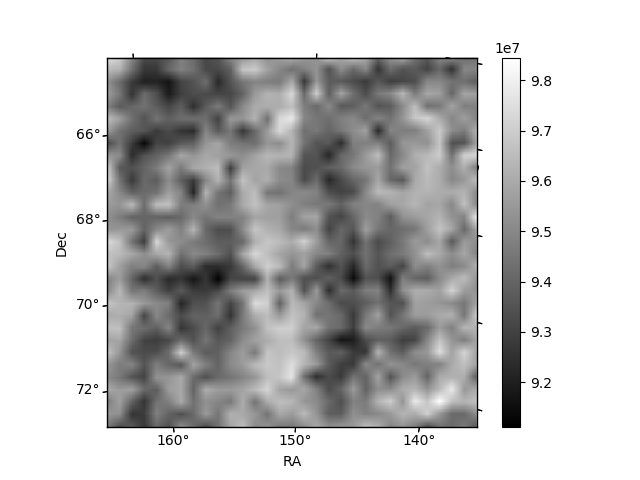
Histogram calculated using DETX and DETY for each event in the final _common_clean file
| Quadrant A | 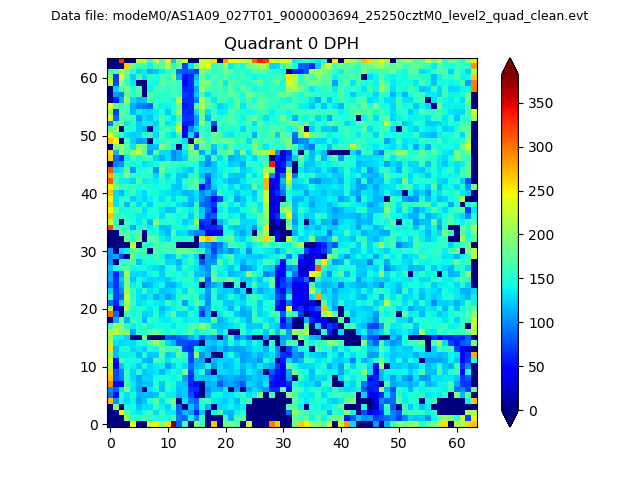 |
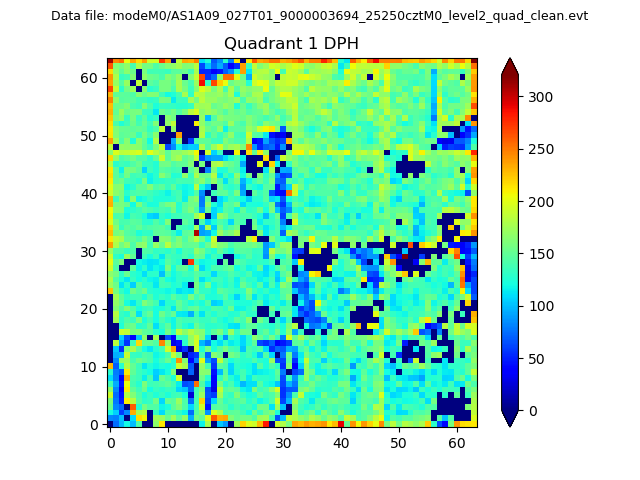 |
Quadrant B |
|---|---|---|---|
| Quadrant D | 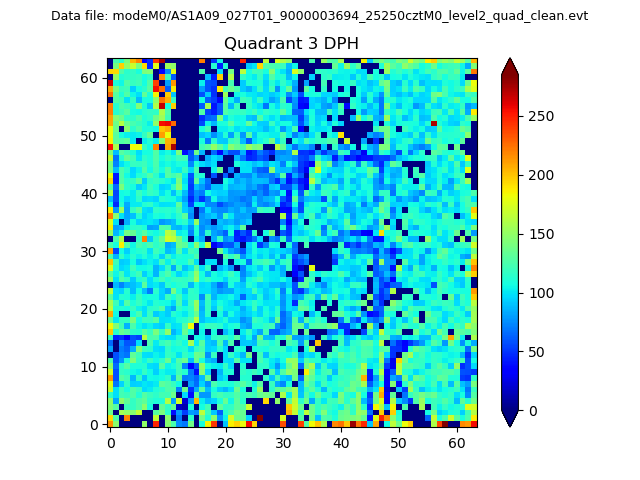 |
 |
Quadrant C |
| Plot type | Count rate plots | Images |
|---|---|---|
| Comparison with Poisson distribution Blue bars denote a histogram of data divided into 1 sec bins. Red curve is a Poisson curve with rate = median count rate of data. |
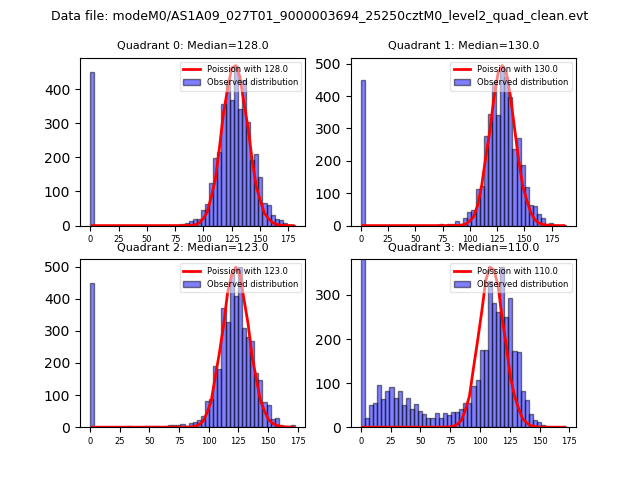 |
 |
| Quadrant-wise count rates Data is divided into 100 sec bins |
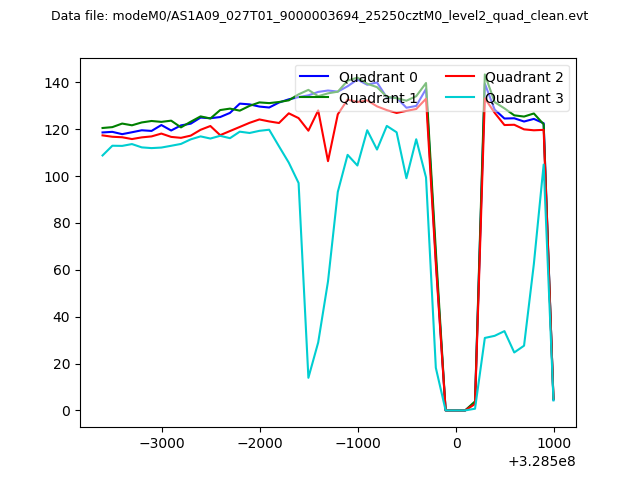 |
|
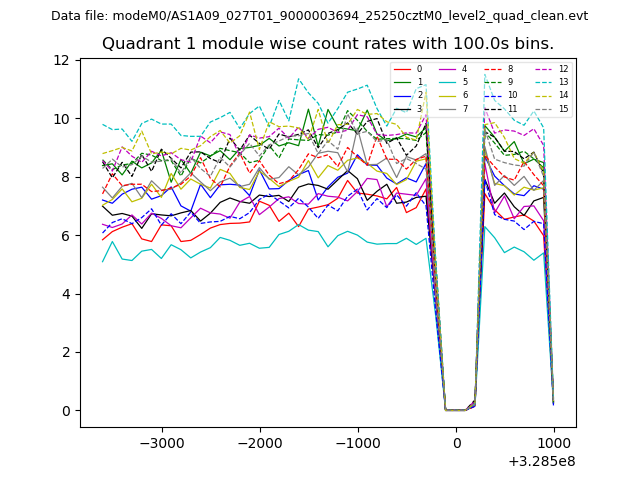
| Module-wise count rates for Quadrant A Data is divided into 100 sec bins |
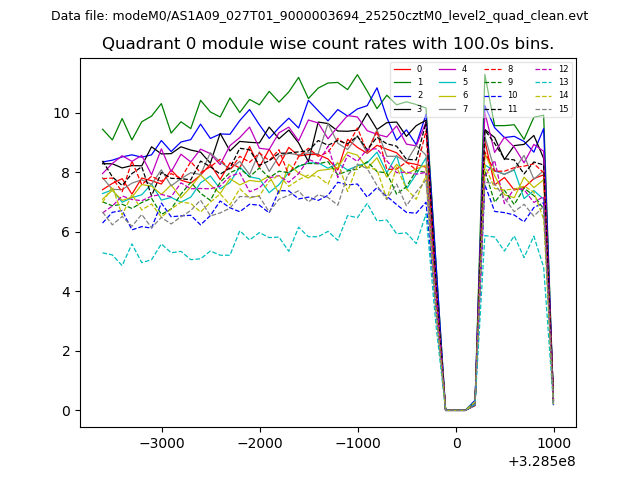 |
 |
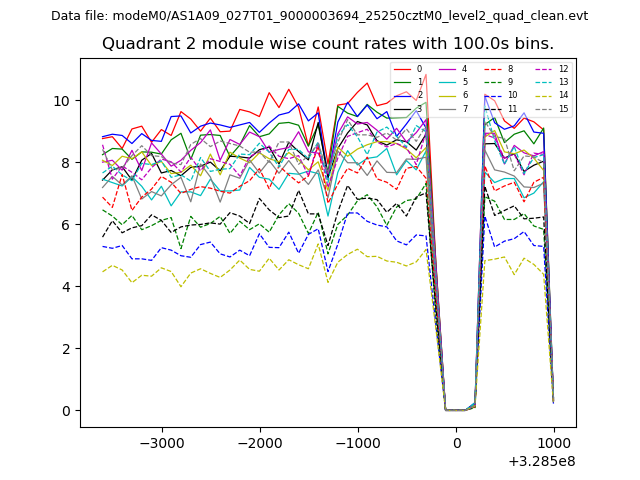
| Module-wise count rates for Quadrant B Data is divided into 100 sec bins |
 |
 |
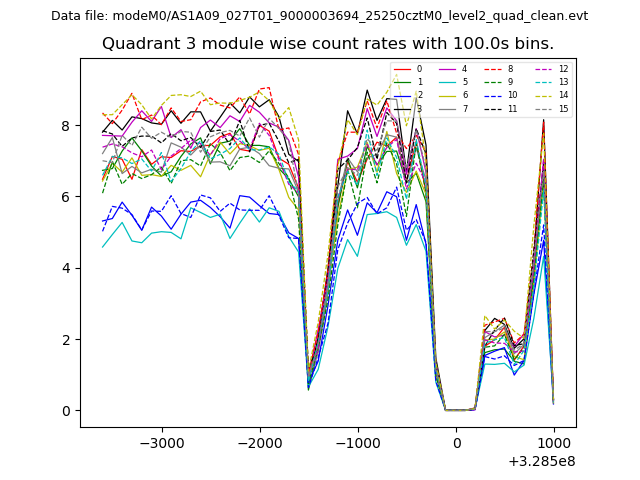
| Module-wise count rates for Quadrant C Data is divided into 100 sec bins |
 |
 |
| Module-wise count rates for Quadrant D Data is divided into 100 sec bins |
 |
 |
| Parameter | Plot |
|---|---|
| CZT HV Monitor | 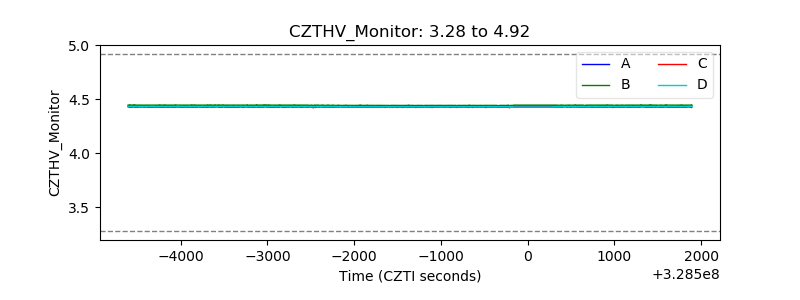 |
| D_VDD | 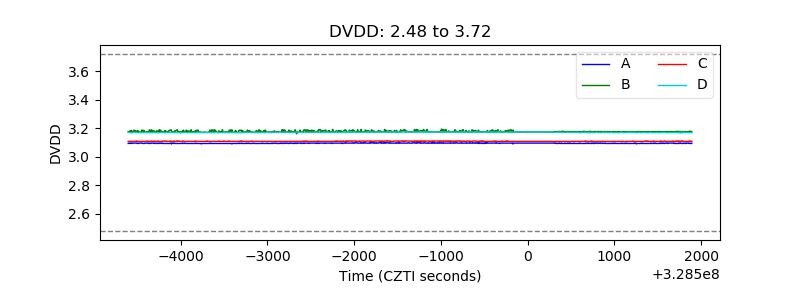 |
| Temperature 1 | 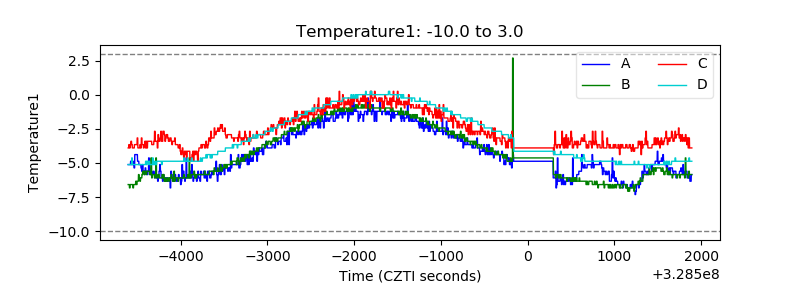 |
| Veto HV Monitor | 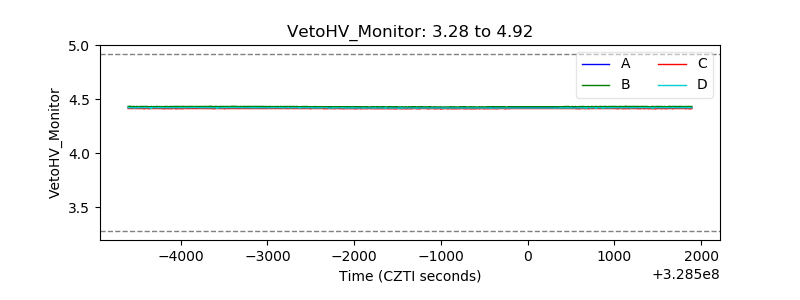 |
| Veto LLD |  |
| Alpha Counter | 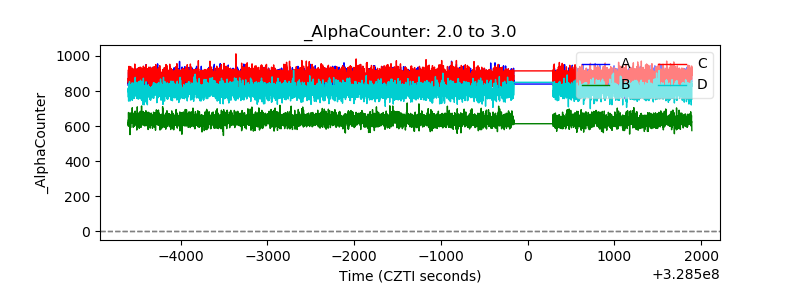 |
| _CPM_Rate | 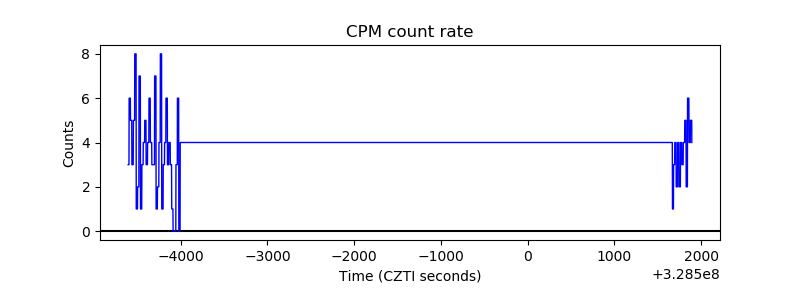 |
| CZT Counter | 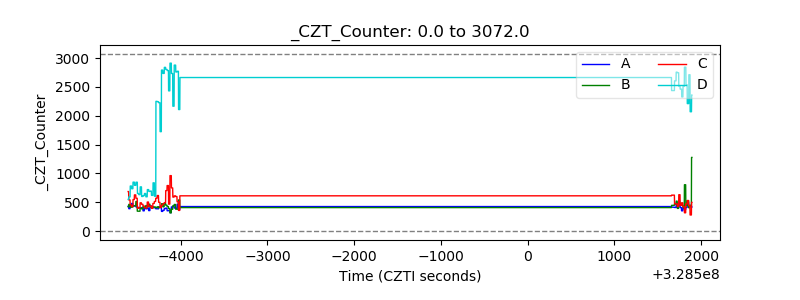 |
| +2.5 Volts monitor |  |
| +5 Volts monitor |  |
| _ROLL_ROT | 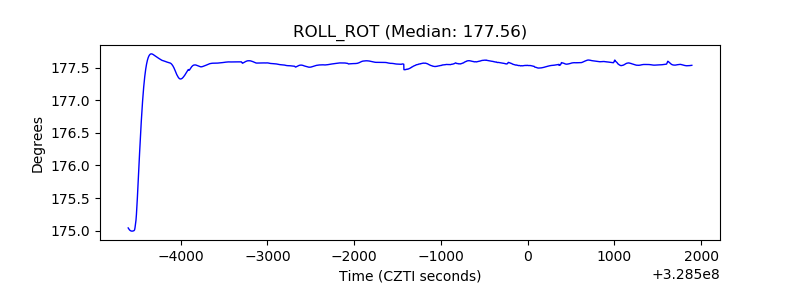 |
| _Roll_DEC | 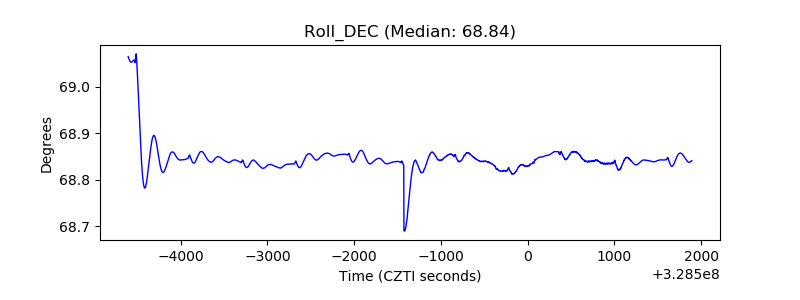 |
| _Roll_RA | 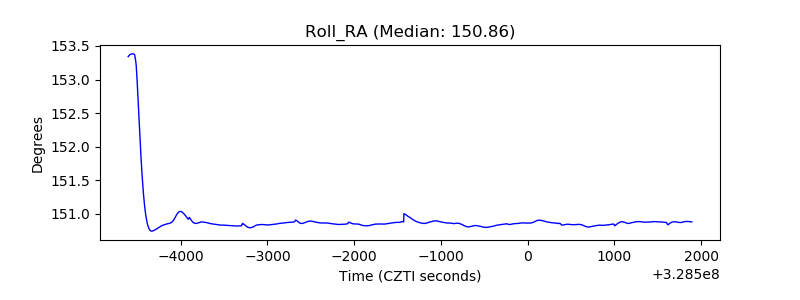 |
| Veto Counter | 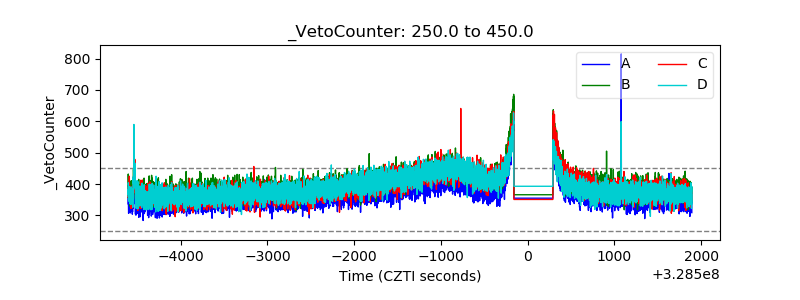 |