| Param | Original file | Final file |
|---|---|---|
| Filename | modeM0/AS1A09_027T01_9000003694_25252cztM0_level2.evt | modeM0/AS1A09_027T01_9000003694_25252cztM0_level2_quad_clean.evt |
| Size (bytes) | 1,692,668,160 | 154,751,040 |
| Size | 1.6 GB | 147.6 MB |
| Events in quadrant A | 5,862,362 | 1,164,661 |
| Events in quadrant B | 6,275,956 | 1,176,091 |
| Events in quadrant C | 6,998,372 | 1,122,426 |
| Events in quadrant D | 31,267,758 | 339,166 |
| Mode M0 | |||
|---|---|---|---|
| Quadrant | BADHDUFLAG | Total packets | Discarded packets |
| A | 0 | 25761 | 0 |
| B | 0 | 26840 | 0 |
| C | 0 | 29127 | 0 |
| D | 0 | 101696 | 0 |
| Mode M9 | |||
|---|---|---|---|
| Quadrant | BADHDUFLAG | Total packets | Discarded packets |
| A | 0 | 17 | 0 |
| B | 0 | 18 | 0 |
| C | 0 | 18 | 0 |
| D | 0 | 18 | 0 |
| Quadrant | Total seconds | Saturated seconds | Saturation percentage |
|---|---|---|---|
| A | 12744 | 77 | 0.604206% |
| B | 12744 | 149 | 1.169178% |
| C | 12744 | 190 | 1.490898% |
| D | 12744 | 11429 | 89.681419% |
Noise dominated data is calculated using 1-second bins in cleaned event files. If a bin has >2000 counts, and if more than 50% of those come from <1% of pixels, then it is considered to be noise-dominated and hence unusable.
| Quadrant | # 1 sec bins | Bins with >0 counts | Bins with >2000 counts | High rate bins dominated by noise | Noise dominated (total time) | Noise dominated (detector-on time) | Marked lightcurve |
|---|---|---|---|---|---|---|---|
| A | 14169 | 12746 | 0 | 0 | 0.00% | 0.00% | 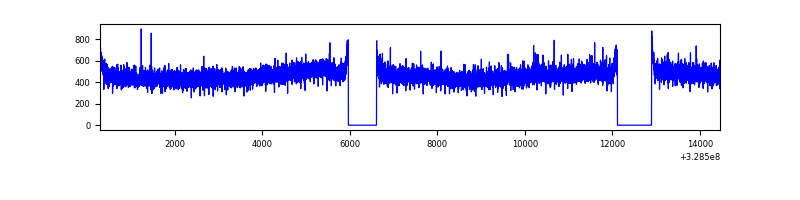 |
| B | 14169 | 12746 | 17 | 17 | 0.12% | 0.13% | 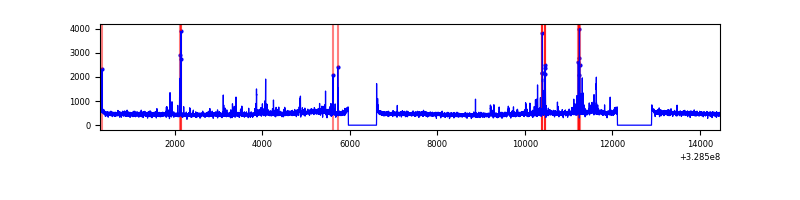 |
| C | 14169 | 12746 | 4 | 4 | 0.03% | 0.03% | 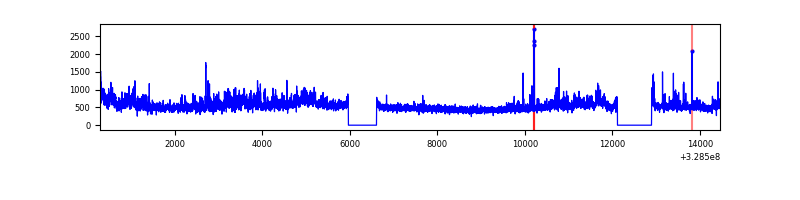 |
| D | 14168 | 12743 | 10140 | 10140 | 71.57% | 79.57% | 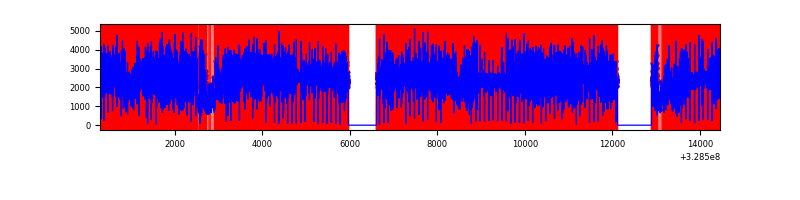 |
Top three noisy pixels from each quadrant. If the there are fewer than three noisy pixels in the level2.evt file, extra rows are filled as -1
| Pixel properties | Quadrant properties | ||||||
|---|---|---|---|---|---|---|---|
| Quadrant | DetID | PixID | Counts | Sigma | Mean | Median | Sigma |
| A | 3 | 1 | 22006 | 66.67 | 1515 | 1478 | 307.9 |
| A | 13 | 254 | 19886 | 59.79 | 1515 | 1478 | 307.9 |
| A | 3 | 137 | 13720 | 39.76 | 1515 | 1478 | 307.9 |
| B | 0 | 229 | 236326 | 830.0 | 1505 | 1466 | 283.0 |
| B | 0 | 190 | 69062 | 238.89 | 1505 | 1466 | 283.0 |
| B | 10 | 251 | 56062 | 192.94 | 1505 | 1466 | 283.0 |
| C | 7 | 247 | 795996 | 2343.53 | 1451 | 1460 | 339.0 |
| C | 14 | 238 | 232856 | 682.51 | 1451 | 1460 | 339.0 |
| C | 3 | 233 | 121365 | 353.67 | 1451 | 1460 | 339.0 |
| D | 1 | 239 | 27075258 | 184623.43 | 605 | 585 | 146.6 |
| D | 8 | 195 | 730293 | 4975.91 | 605 | 585 | 146.6 |
| D | 9 | 35 | 722769 | 4924.61 | 605 | 585 | 146.6 |
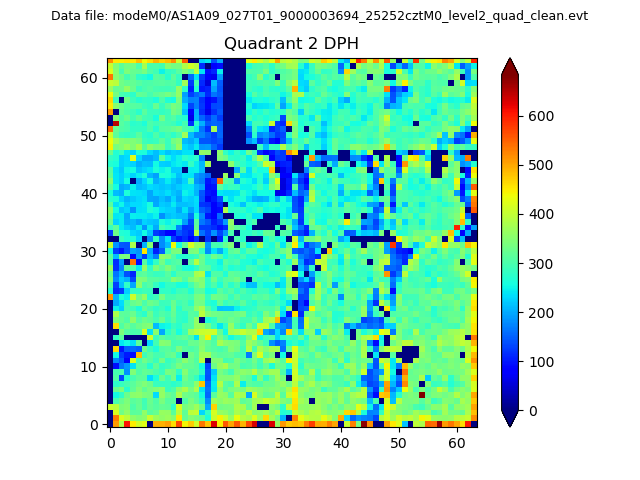
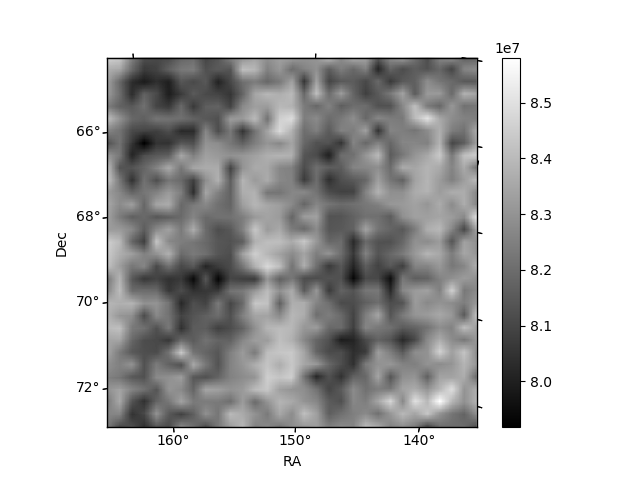
Histogram calculated using DETX and DETY for each event in the final _common_clean file
| Quadrant A | 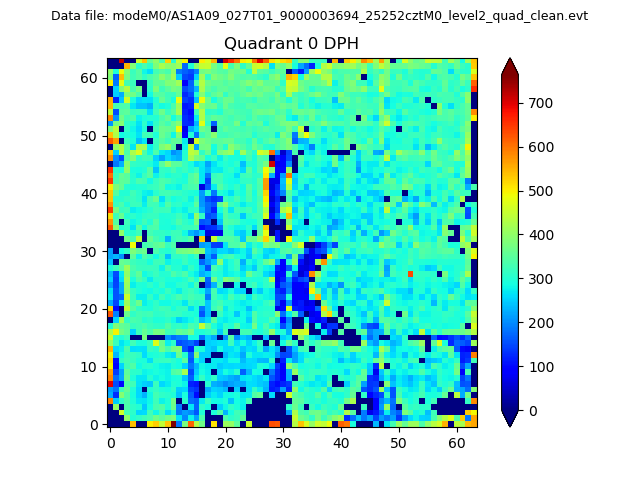 |
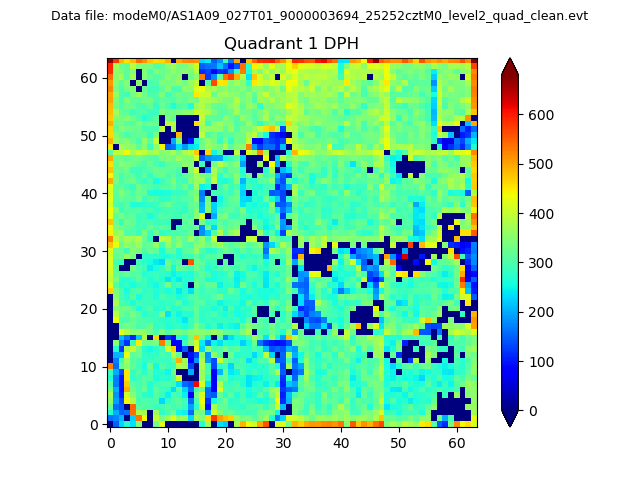 |
Quadrant B |
|---|---|---|---|
| Quadrant D | 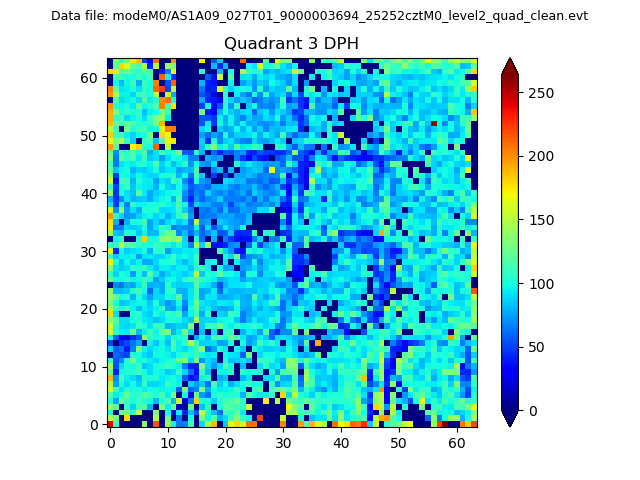 |
 |
Quadrant C |
| Plot type | Count rate plots | Images |
|---|---|---|
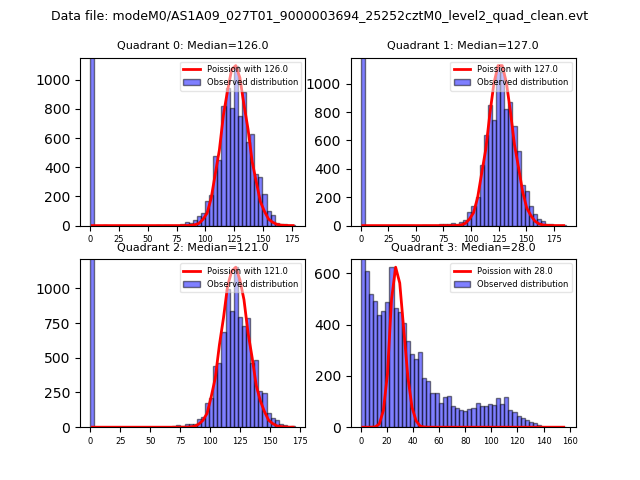
| Comparison with Poisson distribution Blue bars denote a histogram of data divided into 1 sec bins. Red curve is a Poisson curve with rate = median count rate of data. |
 |
 |
| Quadrant-wise count rates Data is divided into 100 sec bins |
 |
|
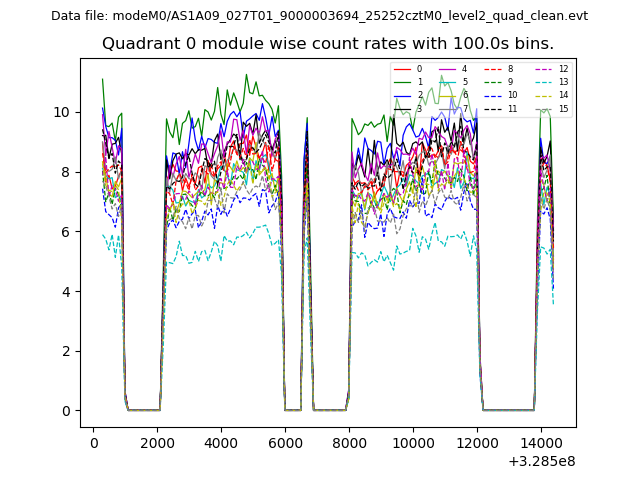
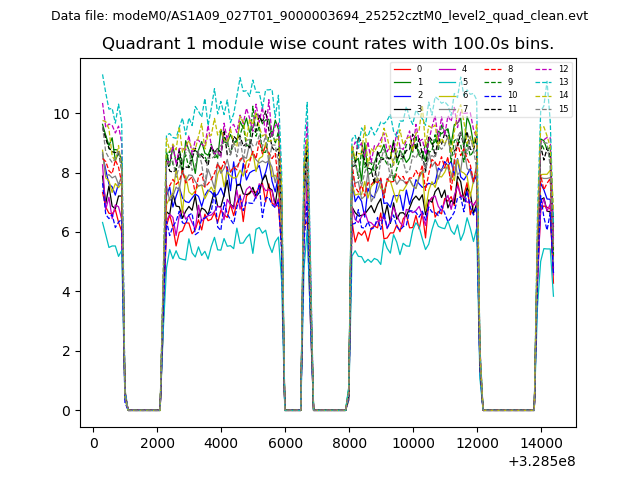
| Module-wise count rates for Quadrant A Data is divided into 100 sec bins |
 |
 |
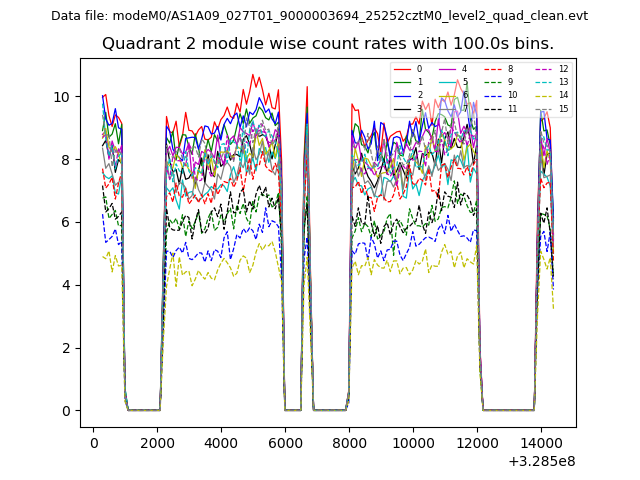
| Module-wise count rates for Quadrant B Data is divided into 100 sec bins |
 |
 |
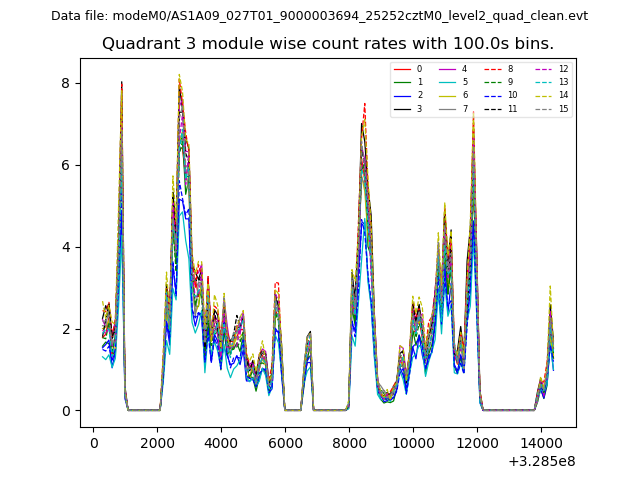
| Module-wise count rates for Quadrant C Data is divided into 100 sec bins |
 |
 |
| Module-wise count rates for Quadrant D Data is divided into 100 sec bins |
 |
 |
| Parameter | Plot |
|---|---|
| CZT HV Monitor | 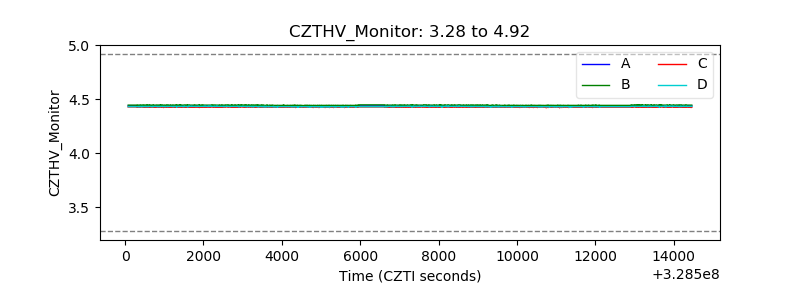 |
| D_VDD | 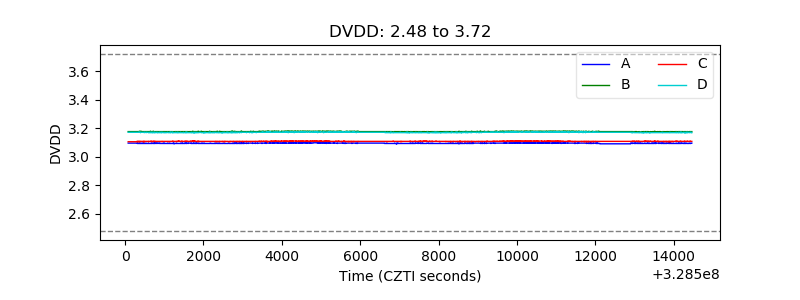 |
| Temperature 1 | 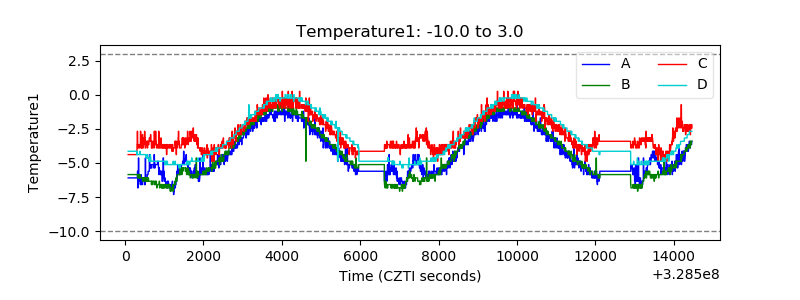 |
| Veto HV Monitor | 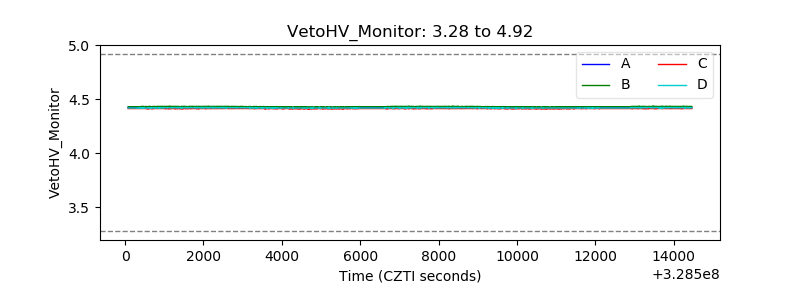 |
| Veto LLD | 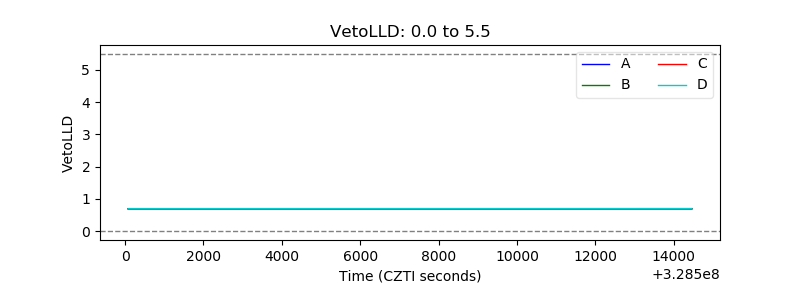 |
| Alpha Counter | 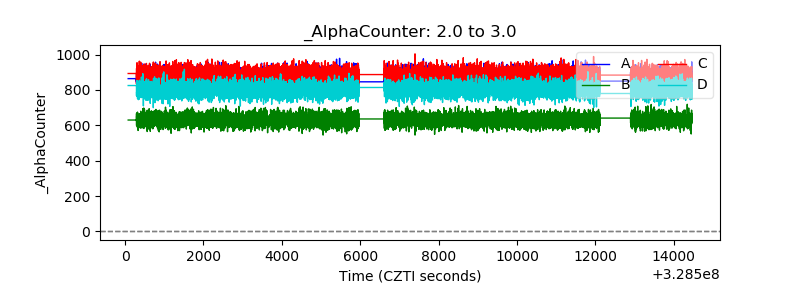 |
| _CPM_Rate | 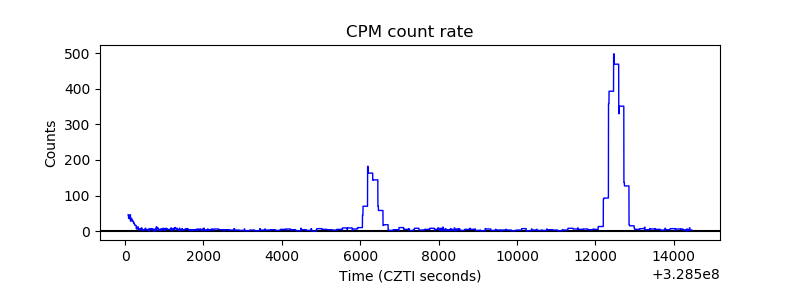 |
| CZT Counter | 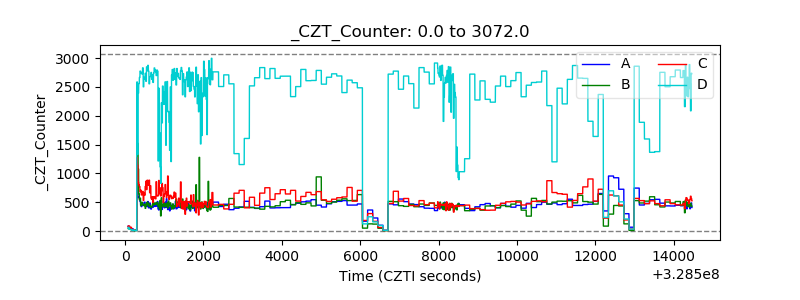 |
| +2.5 Volts monitor |  |
| +5 Volts monitor |  |
| _ROLL_ROT | 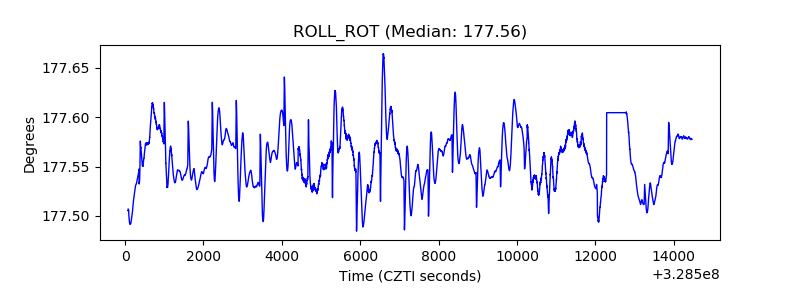 |
| _Roll_DEC | 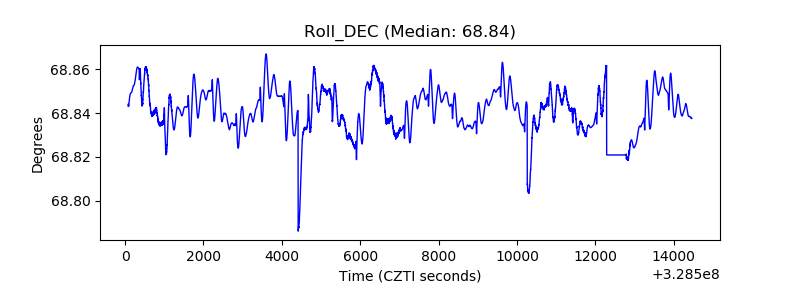 |
| _Roll_RA | 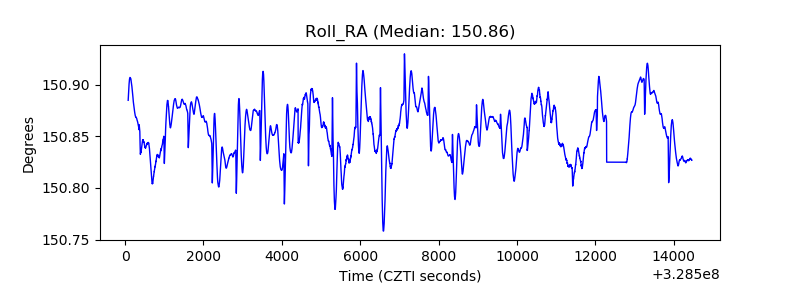 |
| Veto Counter | 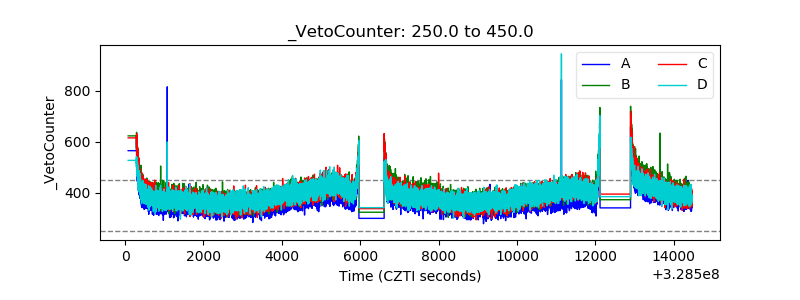 |