| Param | Original file | Final file |
|---|---|---|
| Filename | modeM0/AS1A09_027T01_9000003694_25253cztM0_level2.evt | modeM0/AS1A09_027T01_9000003694_25253cztM0_level2_quad_clean.evt |
| Size (bytes) | 870,603,840 | 84,536,640 |
| Size | 830.3 MB | 80.6 MB |
| Events in quadrant A | 3,161,332 | 663,416 |
| Events in quadrant B | 3,364,525 | 669,843 |
| Events in quadrant C | 3,405,907 | 637,663 |
| Events in quadrant D | 15,984,026 | 122,667 |
| Mode M0 | |||
|---|---|---|---|
| Quadrant | BADHDUFLAG | Total packets | Discarded packets |
| A | 0 | 13579 | 0 |
| B | 0 | 14108 | 0 |
| C | 0 | 14105 | 0 |
| D | 0 | 52121 | 0 |
| Mode M9 | |||
|---|---|---|---|
| Quadrant | BADHDUFLAG | Total packets | Discarded packets |
| A | 0 | 10 | 0 |
| B | 0 | 10 | 0 |
| C | 0 | 10 | 0 |
| D | 0 | 10 | 0 |
| Quadrant | Total seconds | Saturated seconds | Saturation percentage |
|---|---|---|---|
| A | 6658 | 49 | 0.735957% |
| B | 6659 | 67 | 1.006157% |
| C | 6659 | 67 | 1.006157% |
| D | 6658 | 6047 | 90.823070% |
Noise dominated data is calculated using 1-second bins in cleaned event files. If a bin has >2000 counts, and if more than 50% of those come from <1% of pixels, then it is considered to be noise-dominated and hence unusable.
| Quadrant | # 1 sec bins | Bins with >0 counts | Bins with >2000 counts | High rate bins dominated by noise | Noise dominated (total time) | Noise dominated (detector-on time) | Marked lightcurve |
|---|---|---|---|---|---|---|---|
| A | 7588 | 6659 | 0 | 0 | 0.00% | 0.00% | 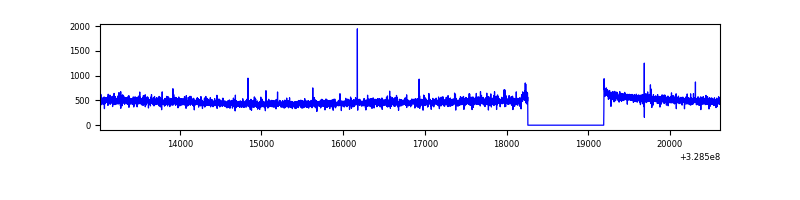 |
| B | 7589 | 6660 | 5 | 5 | 0.07% | 0.08% | 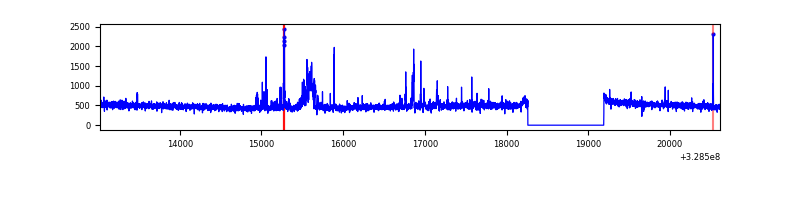 |
| C | 7589 | 6660 | 3 | 3 | 0.04% | 0.05% | 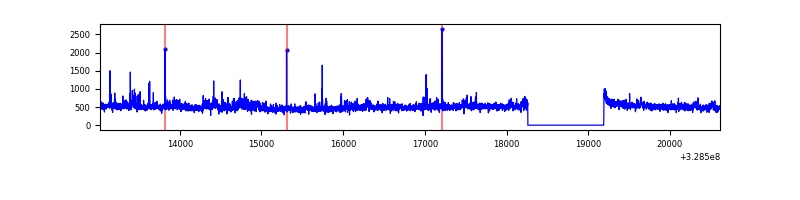 |
| D | 7587 | 6657 | 5277 | 5277 | 69.55% | 79.27% | 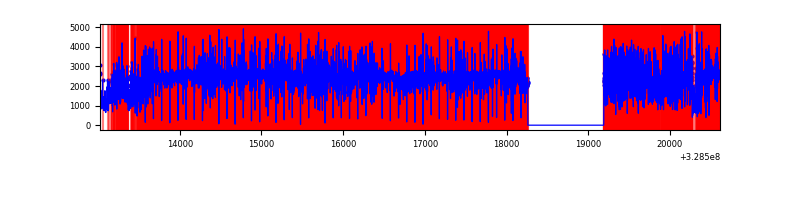 |
Top three noisy pixels from each quadrant. If the there are fewer than three noisy pixels in the level2.evt file, extra rows are filled as -1
| Pixel properties | Quadrant properties | ||||||
|---|---|---|---|---|---|---|---|
| Quadrant | DetID | PixID | Counts | Sigma | Mean | Median | Sigma |
| A | 11 | 29 | 11849 | 66.98 | 815 | 800 | 165.0 |
| A | 13 | 254 | 10868 | 61.03 | 815 | 800 | 165.0 |
| A | 3 | 137 | 7328 | 39.57 | 815 | 800 | 165.0 |
| B | 15 | 33 | 87966 | 563.08 | 807 | 783 | 154.8 |
| B | 0 | 190 | 71127 | 454.32 | 807 | 783 | 154.8 |
| B | 0 | 229 | 34920 | 220.48 | 807 | 783 | 154.8 |
| C | 14 | 238 | 125198 | 690.75 | 771 | 777 | 180.1 |
| C | 3 | 233 | 123664 | 682.23 | 771 | 777 | 180.1 |
| C | 7 | 247 | 71638 | 393.4 | 771 | 777 | 180.1 |
| D | 1 | 239 | 14674502 | 224520.05 | 265 | 256 | 65.4 |
| D | 8 | 195 | 139131 | 2124.83 | 265 | 256 | 65.4 |
| D | 1 | 52 | 51596 | 785.52 | 265 | 256 | 65.4 |
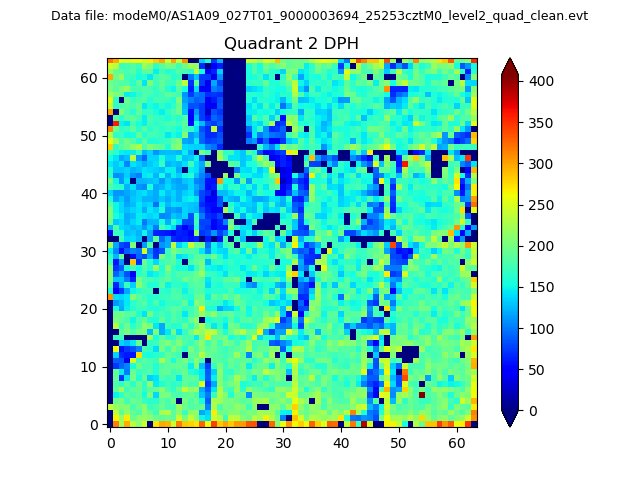
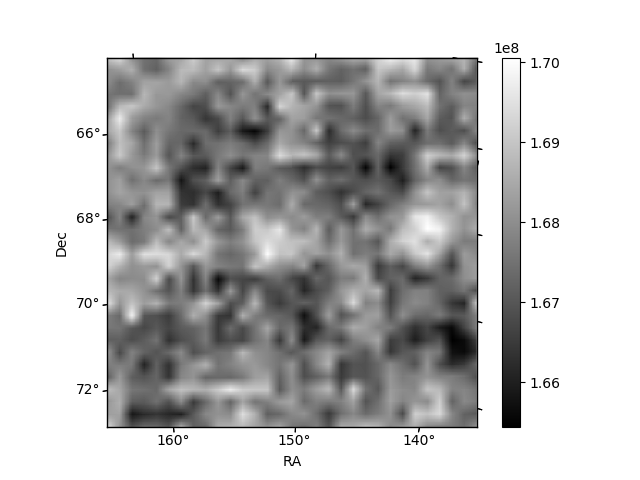
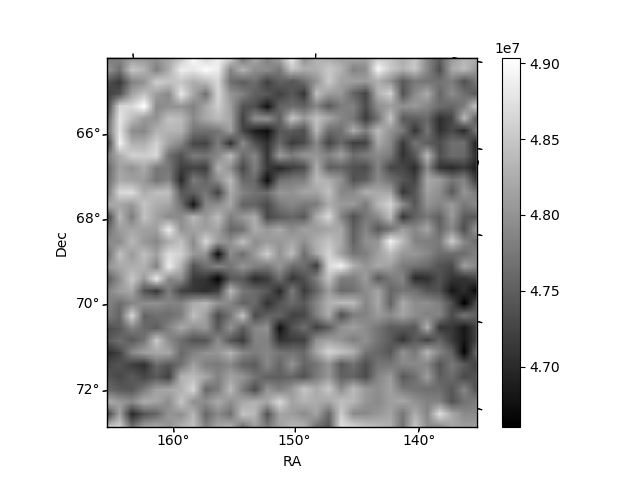
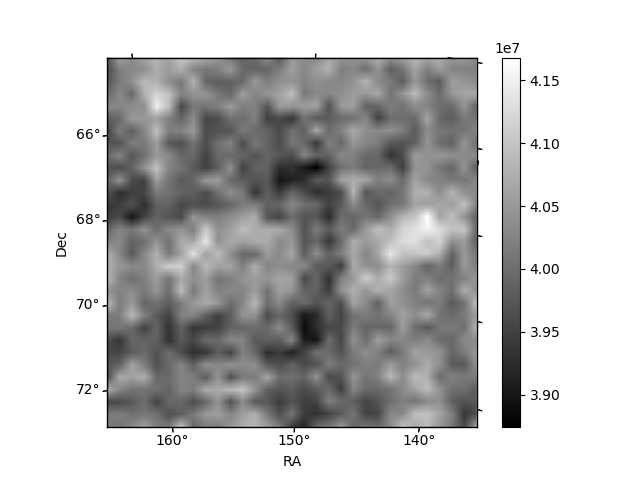
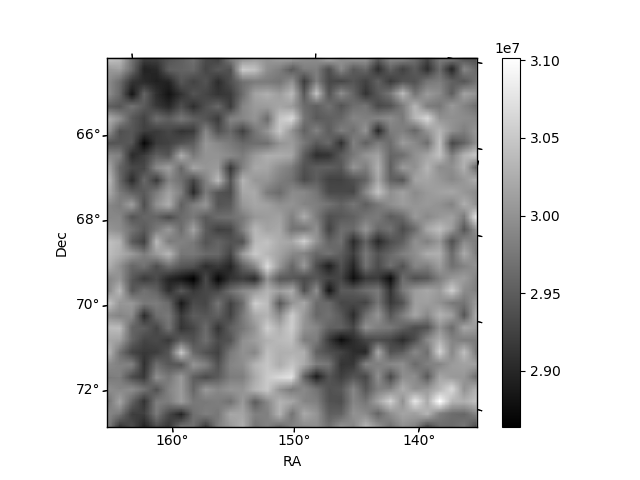
Histogram calculated using DETX and DETY for each event in the final _common_clean file
| Quadrant A | 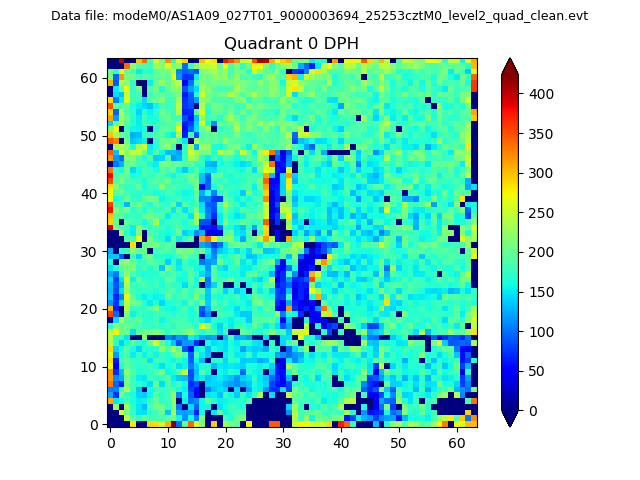 |
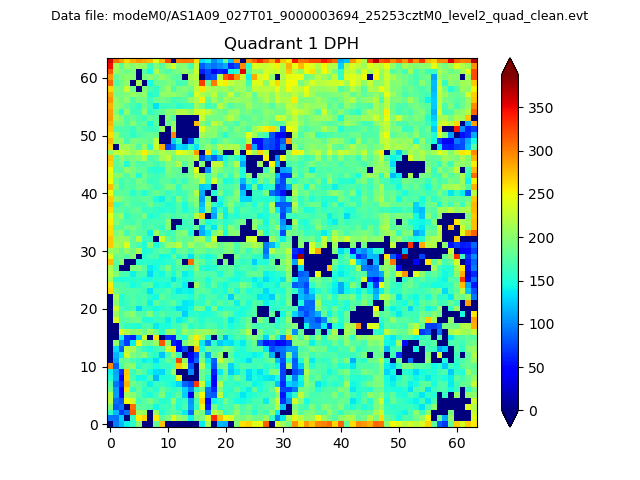 |
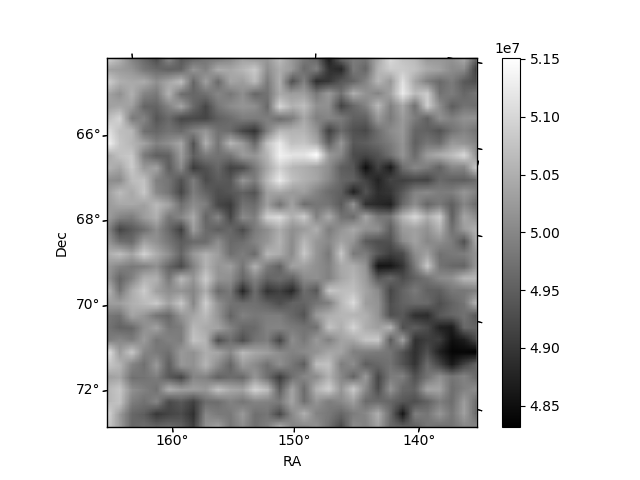
Quadrant B |
|---|---|---|---|
| Quadrant D | 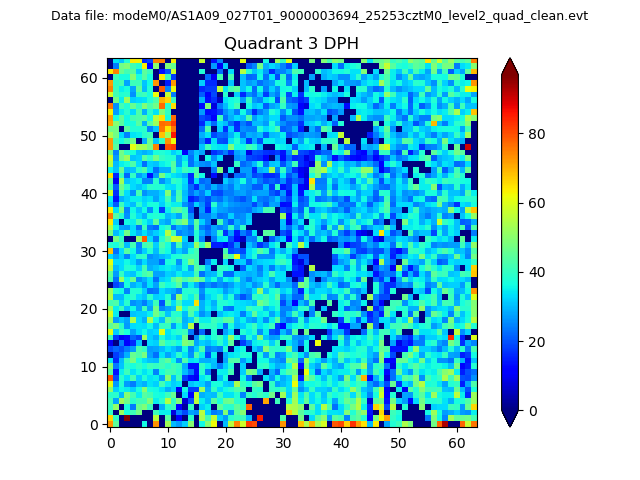 |
 |
Quadrant C |
| Plot type | Count rate plots | Images |
|---|---|---|
| Comparison with Poisson distribution Blue bars denote a histogram of data divided into 1 sec bins. Red curve is a Poisson curve with rate = median count rate of data. |
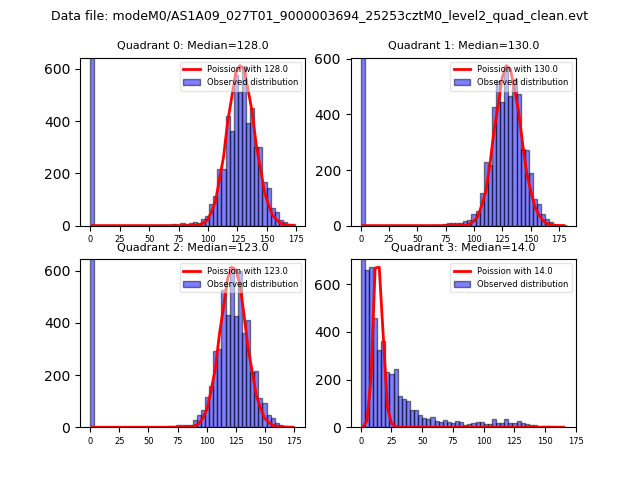 |
 |
| Quadrant-wise count rates Data is divided into 100 sec bins |
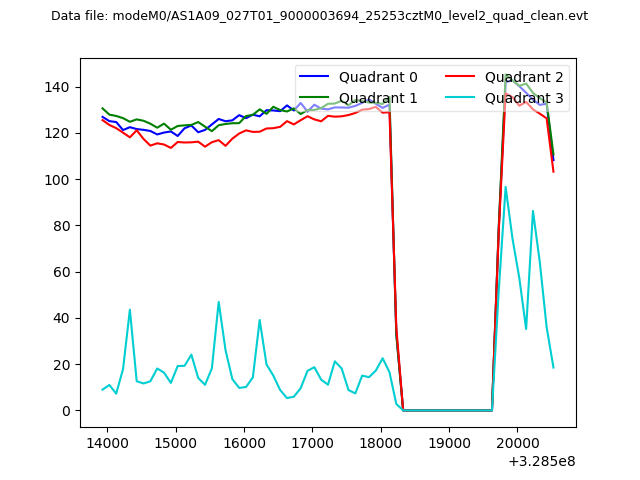 |
|
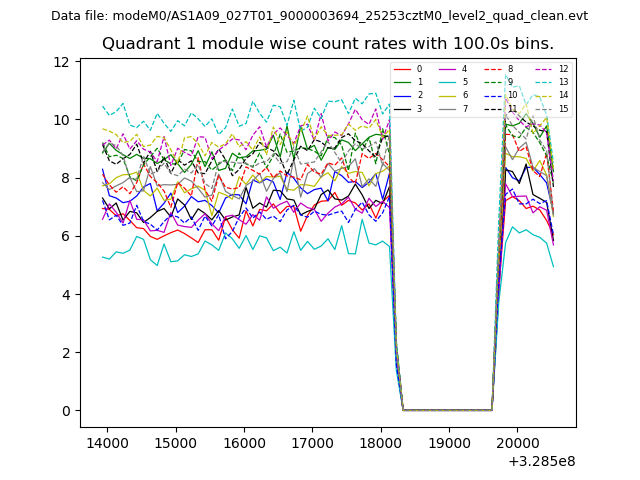
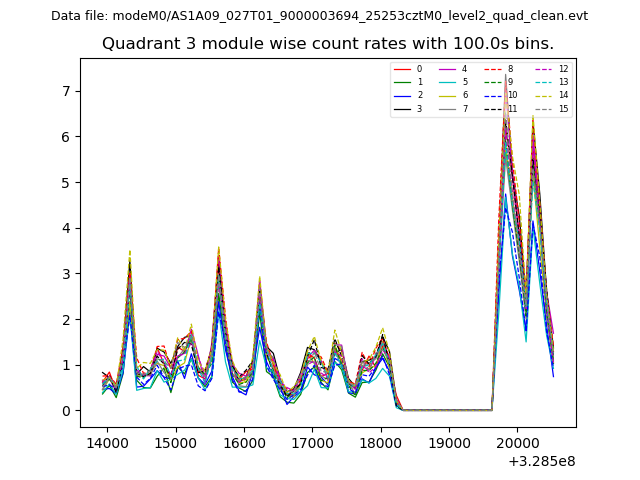
| Module-wise count rates for Quadrant A Data is divided into 100 sec bins |
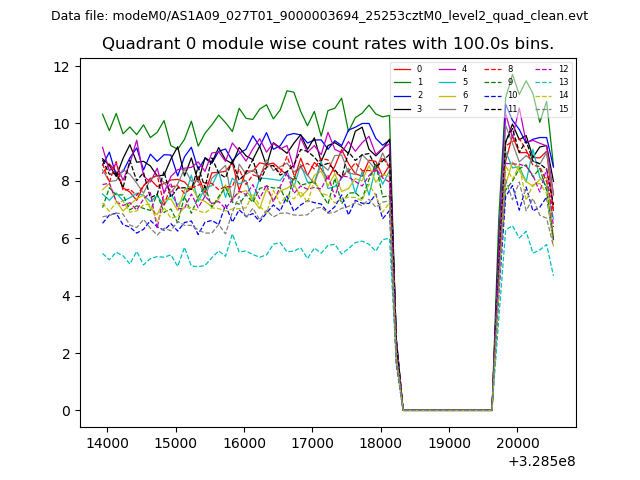 |
 |
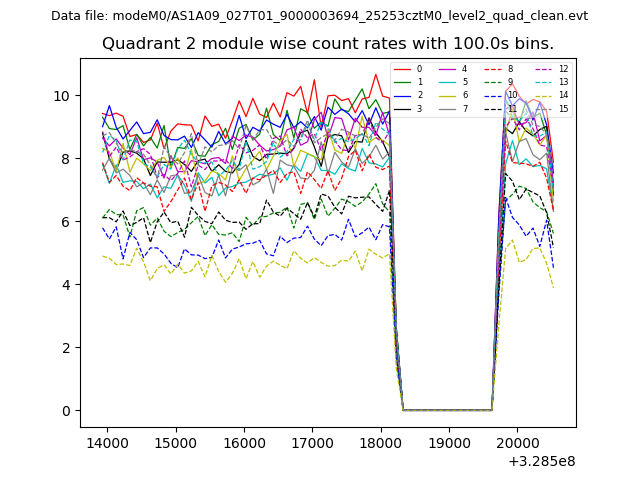
| Module-wise count rates for Quadrant B Data is divided into 100 sec bins |
 |
 |
| Module-wise count rates for Quadrant C Data is divided into 100 sec bins |
 |
 |
| Module-wise count rates for Quadrant D Data is divided into 100 sec bins |
 |
 |
| Parameter | Plot |
|---|---|
| CZT HV Monitor | 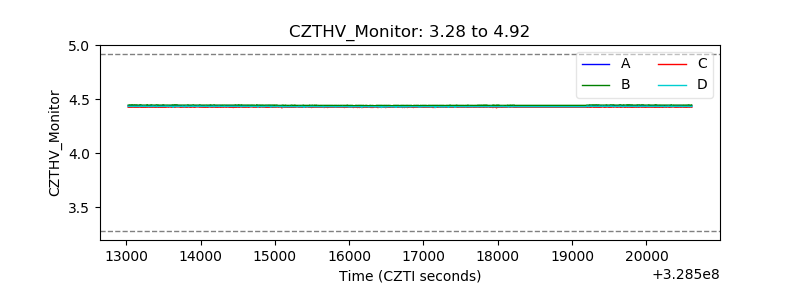 |
| D_VDD | 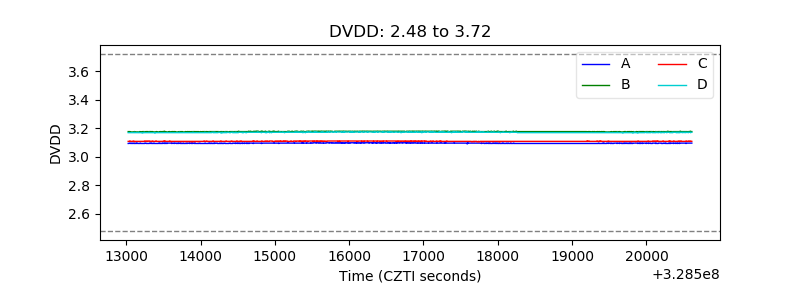 |
| Temperature 1 | 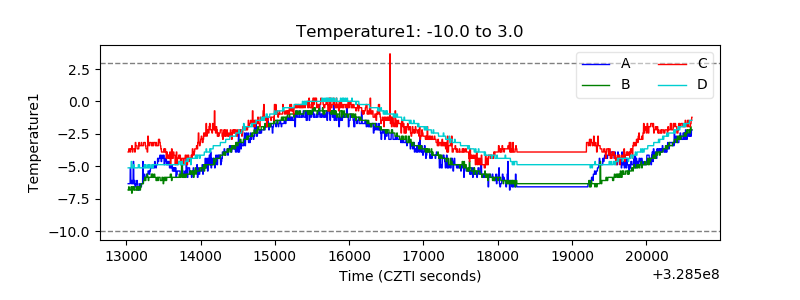 |
| Veto HV Monitor | 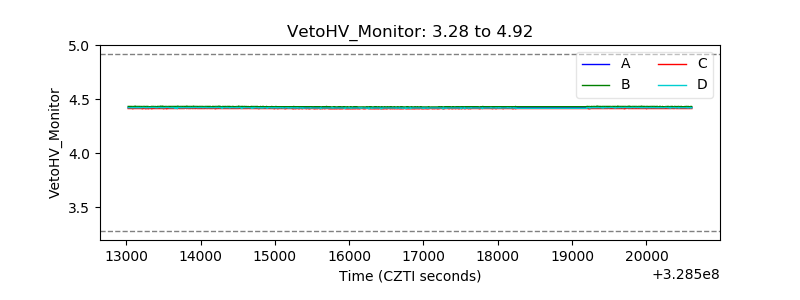 |
| Veto LLD | 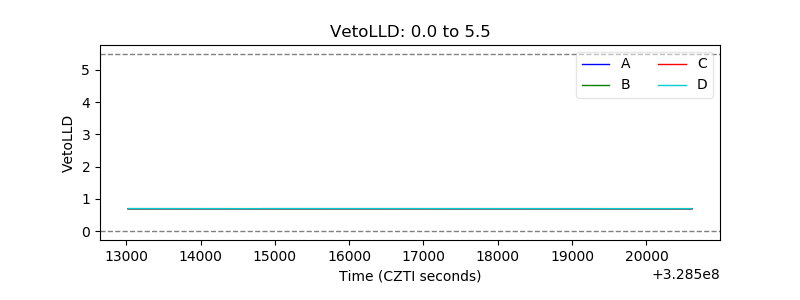 |
| Alpha Counter |  |
| _CPM_Rate | 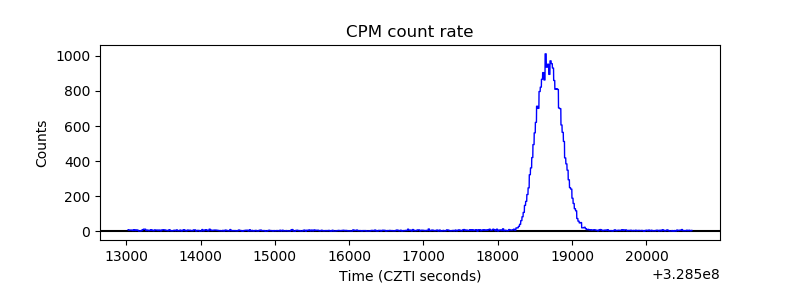 |
| CZT Counter | 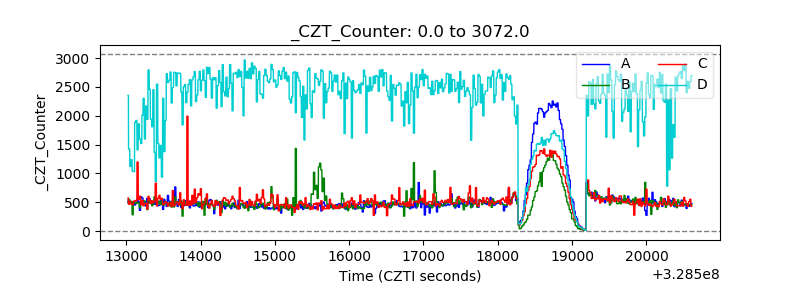 |
| +2.5 Volts monitor |  |
| +5 Volts monitor |  |
| _ROLL_ROT | 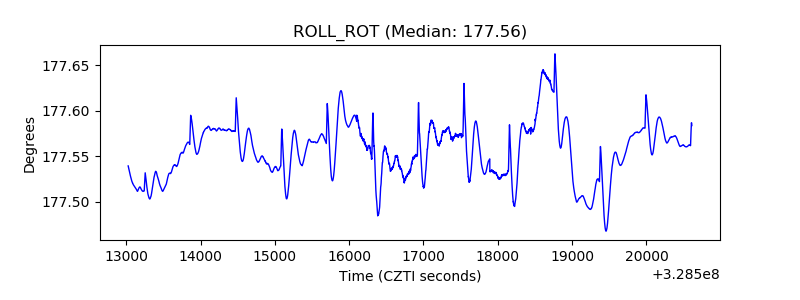 |
| _Roll_DEC | 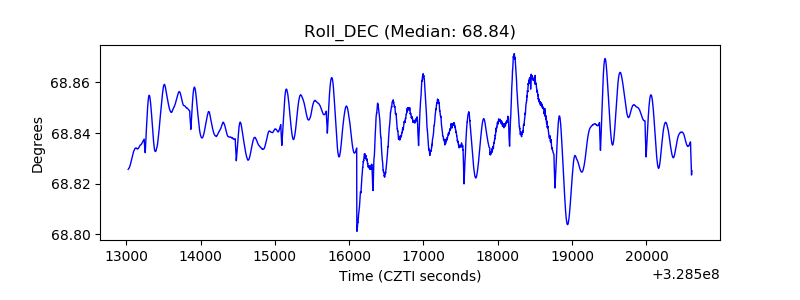 |
| _Roll_RA | 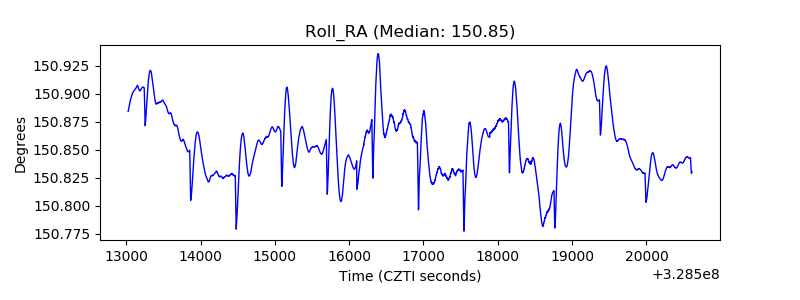 |
| Veto Counter | 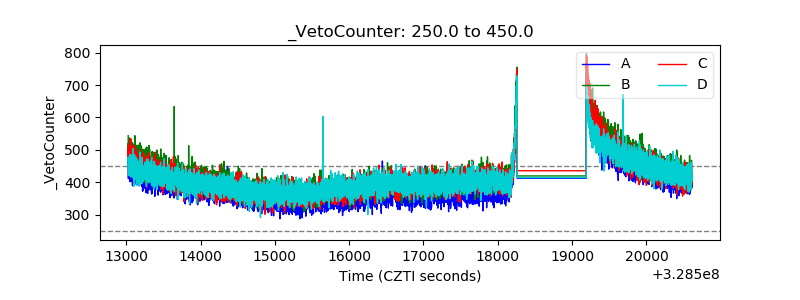 |