| Param | Original file | Final file |
|---|---|---|
| Filename | modeM0/AS1A09_027T01_9000003694_25254cztM0_level2.evt | modeM0/AS1A09_027T01_9000003694_25254cztM0_level2_quad_clean.evt |
| Size (bytes) | 734,869,440 | 99,699,840 |
| Size | 700.8 MB | 95.1 MB |
| Events in quadrant A | 2,864,120 | 771,342 |
| Events in quadrant B | 3,050,812 | 772,510 |
| Events in quadrant C | 3,099,425 | 728,197 |
| Events in quadrant D | 12,845,855 | 337,683 |
| Mode M0 | |||
|---|---|---|---|
| Quadrant | BADHDUFLAG | Total packets | Discarded packets |
| A | 0 | 12189 | 0 |
| B | 0 | 12734 | 0 |
| C | 0 | 12692 | 0 |
| D | 0 | 42205 | 0 |
| Mode M9 | |||
|---|---|---|---|
| Quadrant | BADHDUFLAG | Total packets | Discarded packets |
| A | 0 | 10 | 0 |
| B | 0 | 10 | 0 |
| C | 0 | 10 | 0 |
| D | 0 | 10 | 0 |
| Quadrant | Total seconds | Saturated seconds | Saturation percentage |
|---|---|---|---|
| A | 5827 | 64 | 1.098335% |
| B | 5828 | 94 | 1.612903% |
| C | 5828 | 106 | 1.818806% |
| D | 5827 | 4681 | 80.332933% |
Noise dominated data is calculated using 1-second bins in cleaned event files. If a bin has >2000 counts, and if more than 50% of those come from <1% of pixels, then it is considered to be noise-dominated and hence unusable.
| Quadrant | # 1 sec bins | Bins with >0 counts | Bins with >2000 counts | High rate bins dominated by noise | Noise dominated (total time) | Noise dominated (detector-on time) | Marked lightcurve |
|---|---|---|---|---|---|---|---|
| A | 6882 | 5828 | 0 | 0 | 0.00% | 0.00% | 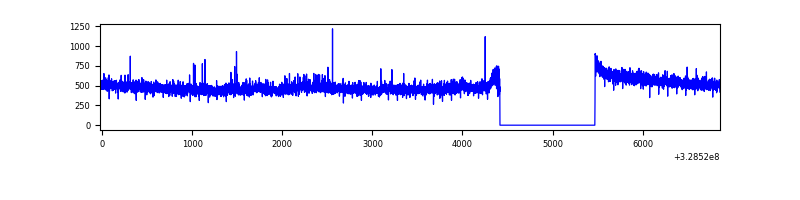 |
| B | 6883 | 5829 | 10 | 10 | 0.15% | 0.17% | 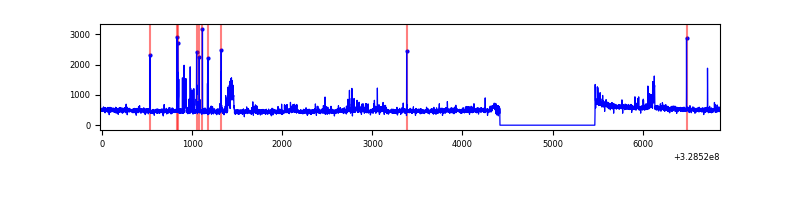 |
| C | 6883 | 5829 | 2 | 2 | 0.03% | 0.03% | 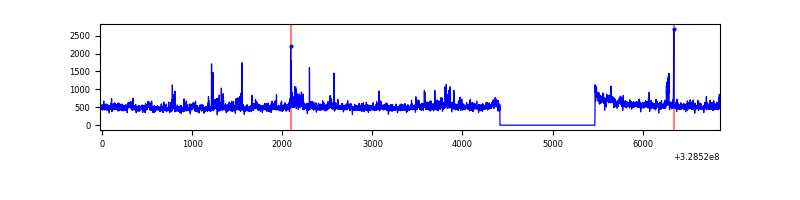 |
| D | 6882 | 5828 | 3791 | 3791 | 55.09% | 65.05% | 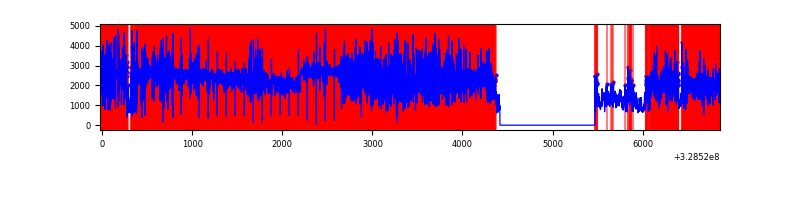 |
Top three noisy pixels from each quadrant. If the there are fewer than three noisy pixels in the level2.evt file, extra rows are filled as -1
| Pixel properties | Quadrant properties | ||||||
|---|---|---|---|---|---|---|---|
| Quadrant | DetID | PixID | Counts | Sigma | Mean | Median | Sigma |
| A | 3 | 1 | 29251 | 195.49 | 729 | 715 | 146.0 |
| A | 4 | 2 | 15827 | 103.53 | 729 | 715 | 146.0 |
| A | 13 | 254 | 10875 | 69.6 | 729 | 715 | 146.0 |
| B | 15 | 33 | 49723 | 361.27 | 717 | 699 | 135.7 |
| B | 10 | 251 | 49326 | 358.35 | 717 | 699 | 135.7 |
| B | 0 | 229 | 40665 | 294.52 | 717 | 699 | 135.7 |
| C | 0 | 239 | 141450 | 882.98 | 686 | 688 | 159.4 |
| C | 14 | 238 | 112802 | 703.27 | 686 | 688 | 159.4 |
| C | 2 | 16 | 82164 | 511.09 | 686 | 688 | 159.4 |
| D | 1 | 239 | 8804806 | 95610.29 | 380 | 369 | 92.1 |
| D | 9 | 35 | 1672936 | 18162.96 | 380 | 369 | 92.1 |
| D | 8 | 195 | 715795 | 7769.05 | 380 | 369 | 92.1 |
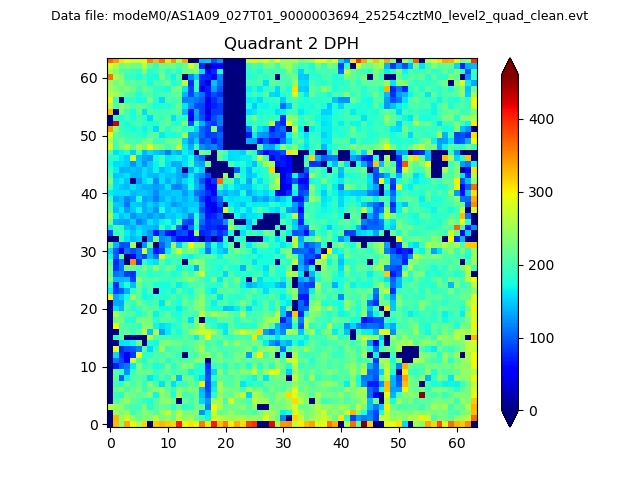
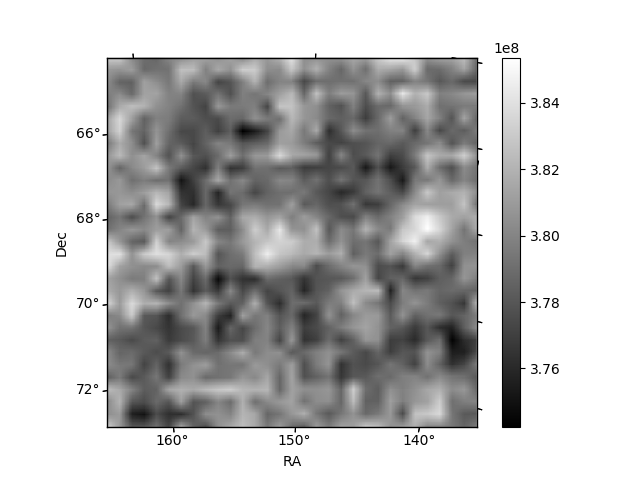
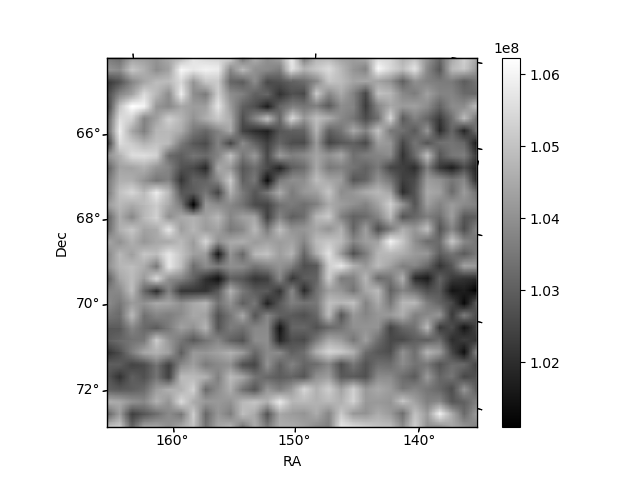
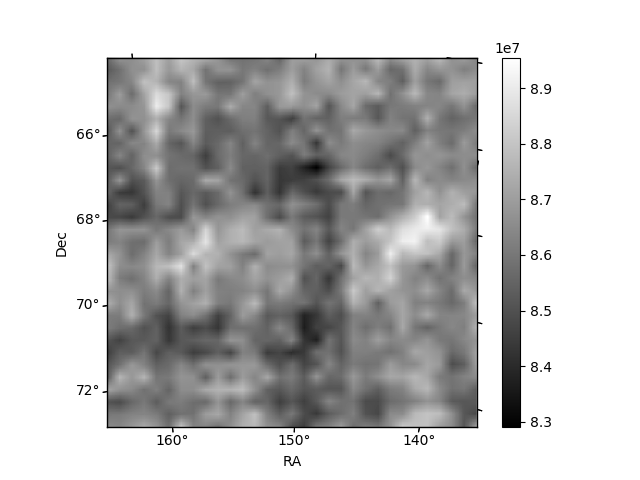
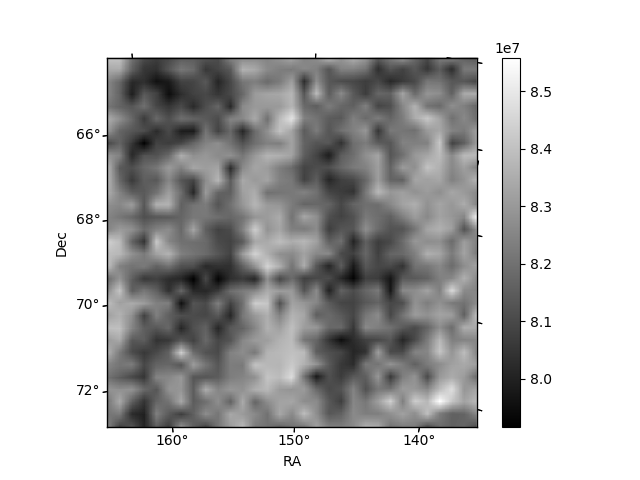
Histogram calculated using DETX and DETY for each event in the final _common_clean file
| Quadrant A | 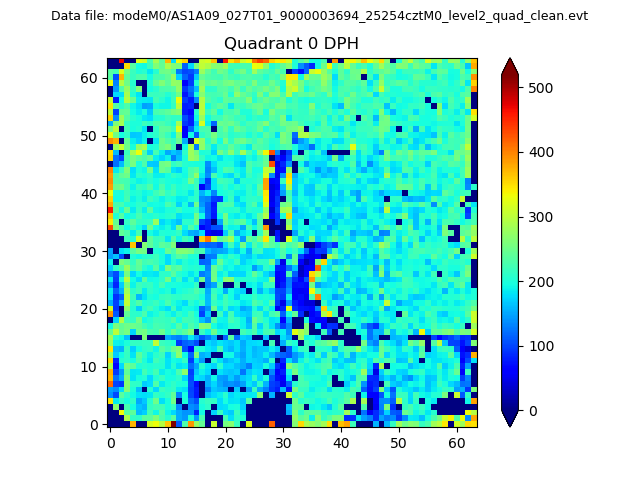 |
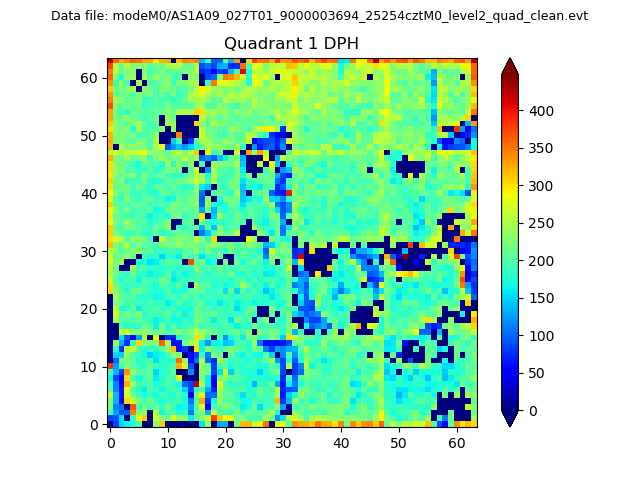 |
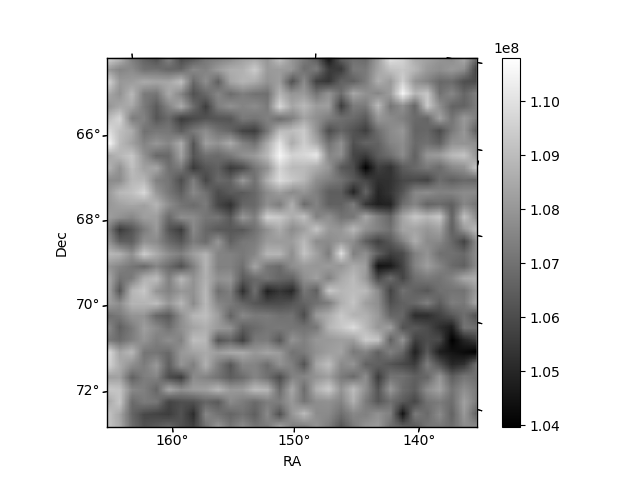
Quadrant B |
|---|---|---|---|
| Quadrant D | 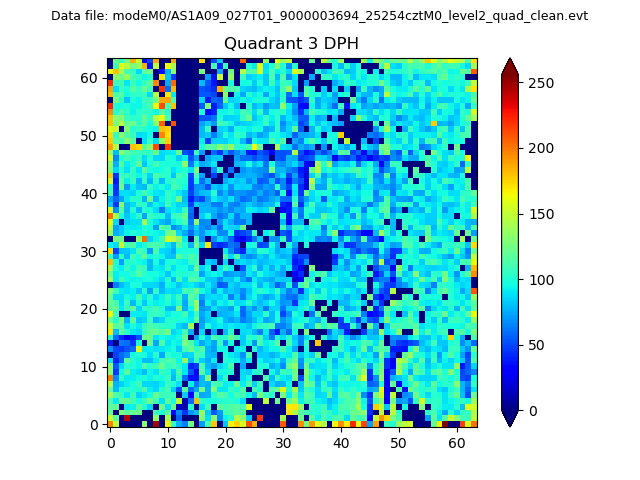 |
 |
Quadrant C |
| Plot type | Count rate plots | Images |
|---|---|---|
| Comparison with Poisson distribution Blue bars denote a histogram of data divided into 1 sec bins. Red curve is a Poisson curve with rate = median count rate of data. |
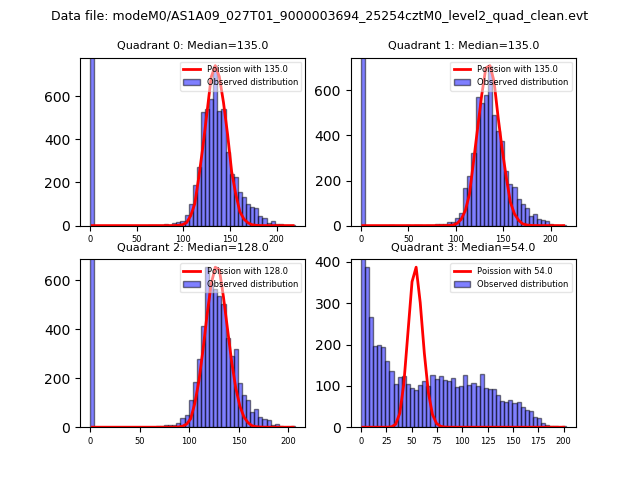 |
 |
| Quadrant-wise count rates Data is divided into 100 sec bins |
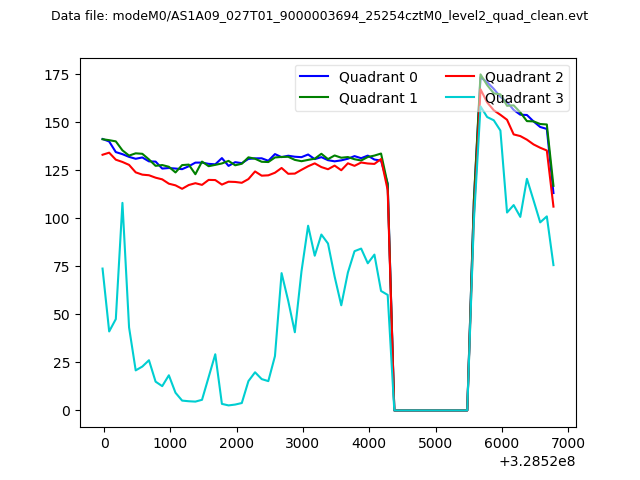 |
|
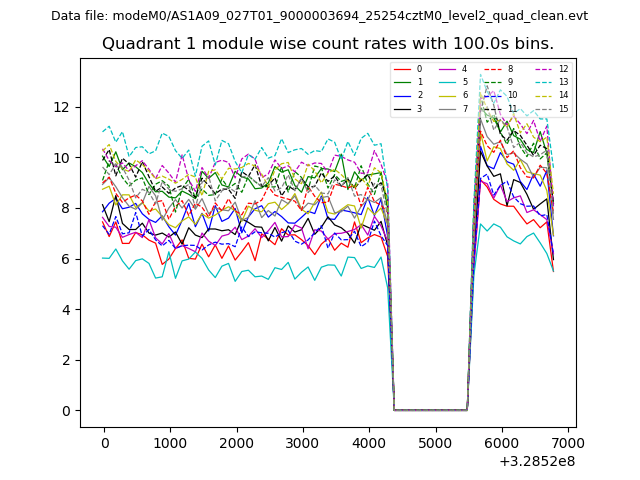
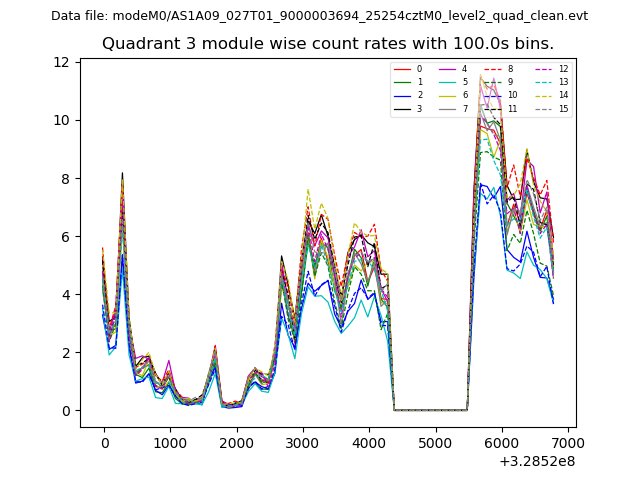
| Module-wise count rates for Quadrant A Data is divided into 100 sec bins |
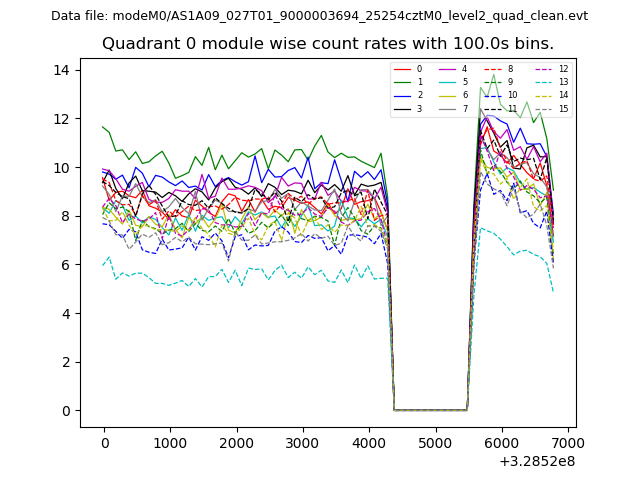 |
 |
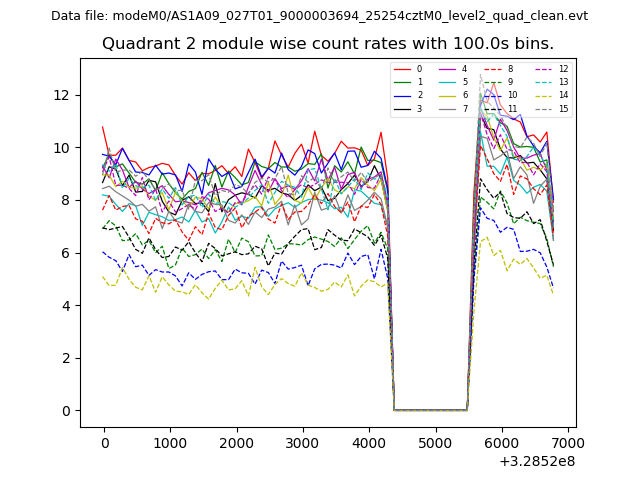
| Module-wise count rates for Quadrant B Data is divided into 100 sec bins |
 |
 |
| Module-wise count rates for Quadrant C Data is divided into 100 sec bins |
 |
 |
| Module-wise count rates for Quadrant D Data is divided into 100 sec bins |
 |
 |
| Parameter | Plot |
|---|---|
| CZT HV Monitor | 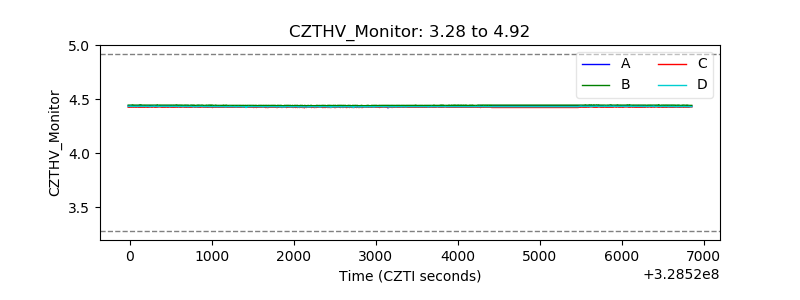 |
| D_VDD | 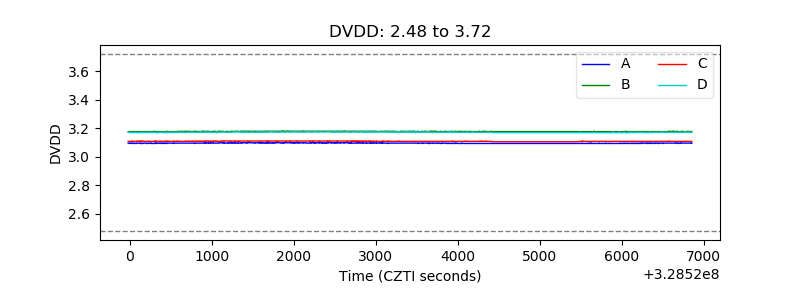 |
| Temperature 1 | 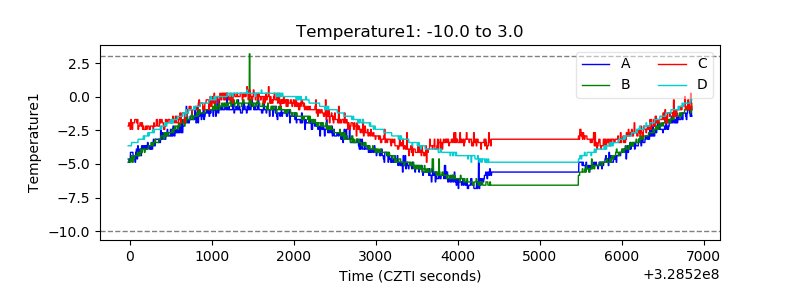 |
| Veto HV Monitor | 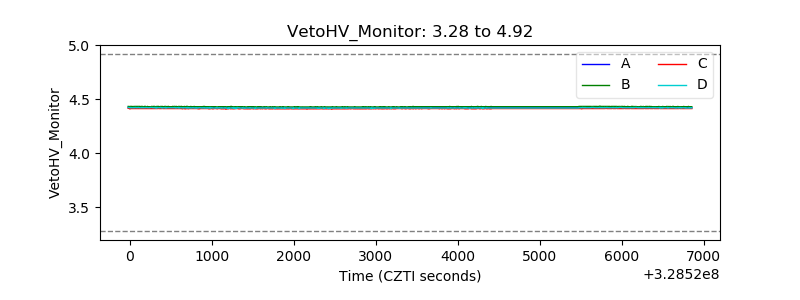 |
| Veto LLD | 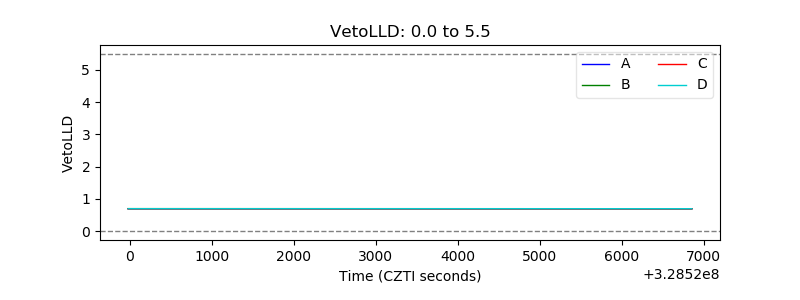 |
| Alpha Counter | 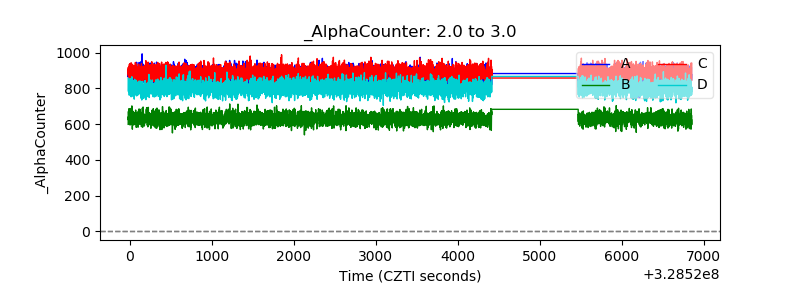 |
| _CPM_Rate | 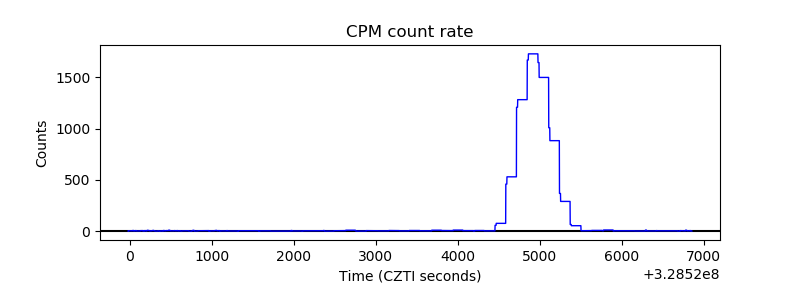 |
| CZT Counter | 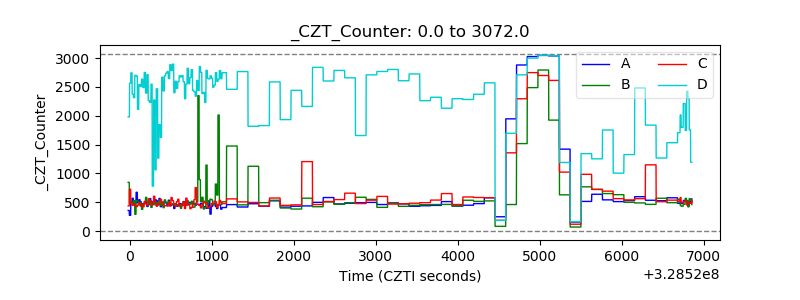 |
| +2.5 Volts monitor | 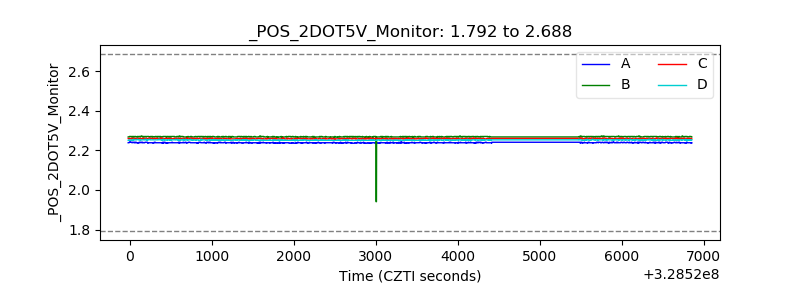 |
| +5 Volts monitor |  |
| _ROLL_ROT | 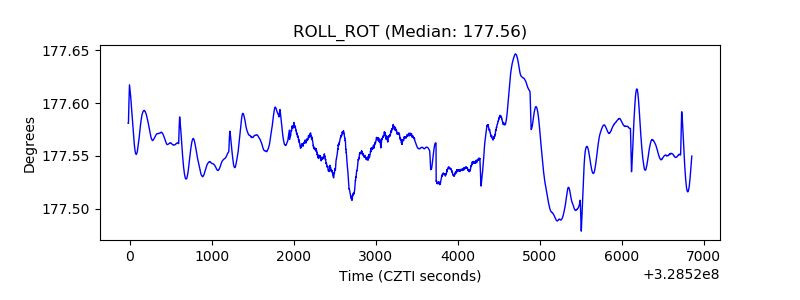 |
| _Roll_DEC | 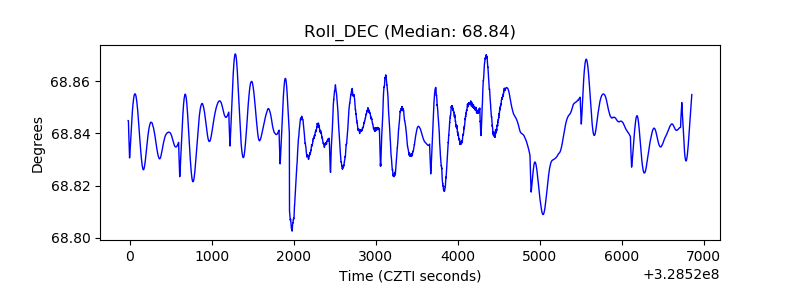 |
| _Roll_RA | 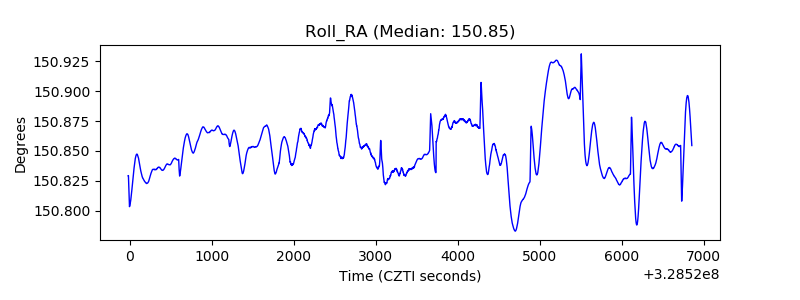 |
| Veto Counter | 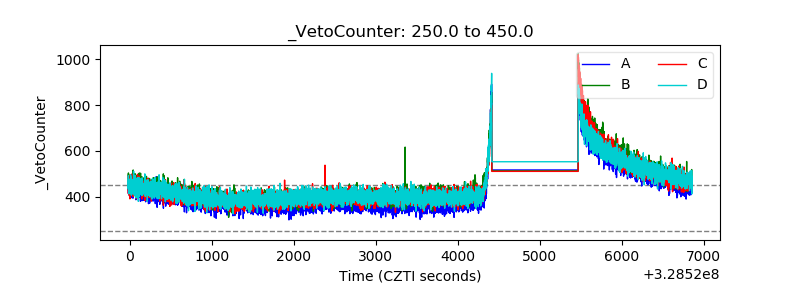 |