| Param | Original file | Final file |
|---|---|---|
| Filename | modeM0/AS1A09_027T01_9000003694_25256cztM0_level2.evt | modeM0/AS1A09_027T01_9000003694_25256cztM0_level2_quad_clean.evt |
| Size (bytes) | 655,799,040 | 109,952,640 |
| Size | 625.4 MB | 104.9 MB |
| Events in quadrant A | 2,848,268 | 790,984 |
| Events in quadrant B | 2,966,927 | 788,621 |
| Events in quadrant C | 3,615,013 | 729,514 |
| Events in quadrant D | 10,047,170 | 623,306 |
| Mode M0 | |||
|---|---|---|---|
| Quadrant | BADHDUFLAG | Total packets | Discarded packets |
| A | 0 | 12095 | 0 |
| B | 0 | 12378 | 0 |
| C | 0 | 14232 | 0 |
| D | 0 | 33798 | 0 |
| Mode M9 | |||
|---|---|---|---|
| Quadrant | BADHDUFLAG | Total packets | Discarded packets |
| A | 0 | 12 | 0 |
| B | 0 | 12 | 0 |
| C | 0 | 12 | 0 |
| D | 0 | 12 | 0 |
| Quadrant | Total seconds | Saturated seconds | Saturation percentage |
|---|---|---|---|
| A | 5667 | 50 | 0.882301% |
| B | 5668 | 61 | 1.076217% |
| C | 5668 | 208 | 3.669725% |
| D | 5668 | 2383 | 42.043049% |
Noise dominated data is calculated using 1-second bins in cleaned event files. If a bin has >2000 counts, and if more than 50% of those come from <1% of pixels, then it is considered to be noise-dominated and hence unusable.
| Quadrant | # 1 sec bins | Bins with >0 counts | Bins with >2000 counts | High rate bins dominated by noise | Noise dominated (total time) | Noise dominated (detector-on time) | Marked lightcurve |
|---|---|---|---|---|---|---|---|
| A | 6872 | 5668 | 0 | 0 | 0.00% | 0.00% | 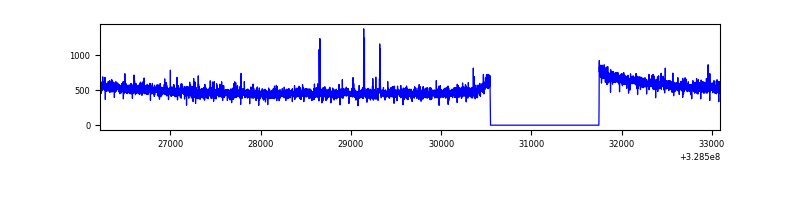 |
| B | 6873 | 5669 | 4 | 4 | 0.06% | 0.07% | 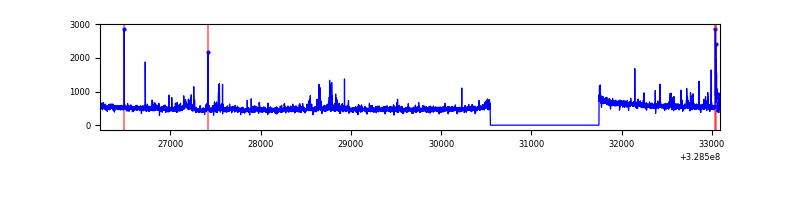 |
| C | 6873 | 5669 | 69 | 69 | 1.00% | 1.22% | 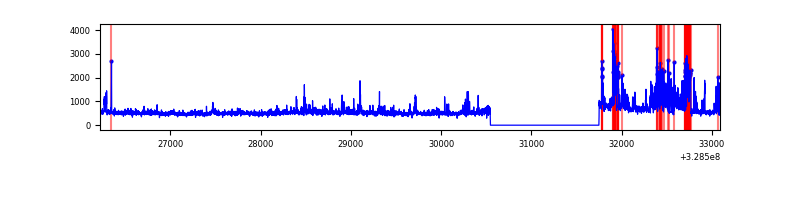 |
| D | 6873 | 5669 | 2063 | 2063 | 30.02% | 36.39% | 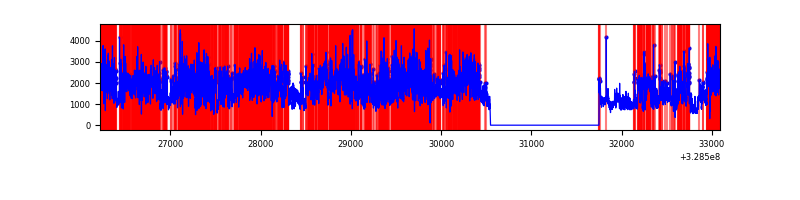 |
Top three noisy pixels from each quadrant. If the there are fewer than three noisy pixels in the level2.evt file, extra rows are filled as -1
| Pixel properties | Quadrant properties | ||||||
|---|---|---|---|---|---|---|---|
| Quadrant | DetID | PixID | Counts | Sigma | Mean | Median | Sigma |
| A | 3 | 1 | 21048 | 140.17 | 729 | 715 | 145.1 |
| A | 11 | 29 | 12536 | 81.49 | 729 | 715 | 145.1 |
| A | 13 | 254 | 9601 | 61.26 | 729 | 715 | 145.1 |
| B | 0 | 190 | 53704 | 395.49 | 717 | 701 | 134.0 |
| B | 0 | 229 | 53617 | 394.85 | 717 | 701 | 134.0 |
| B | 12 | 111 | 15013 | 106.79 | 717 | 701 | 134.0 |
| C | 2 | 16 | 635691 | 4048.58 | 682 | 689 | 156.8 |
| C | 14 | 238 | 110345 | 699.13 | 682 | 689 | 156.8 |
| C | 3 | 233 | 101402 | 642.12 | 682 | 689 | 156.8 |
| D | 1 | 239 | 3081735 | 20509.16 | 630 | 612 | 150.2 |
| D | 9 | 35 | 2101654 | 13985.35 | 630 | 612 | 150.2 |
| D | 8 | 195 | 1936662 | 12887.1 | 630 | 612 | 150.2 |
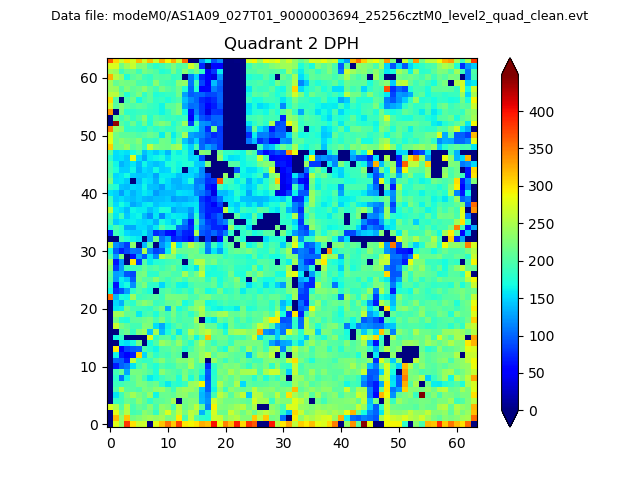
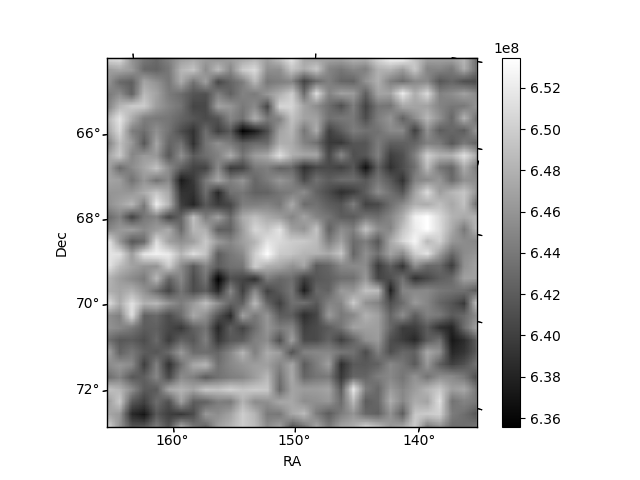
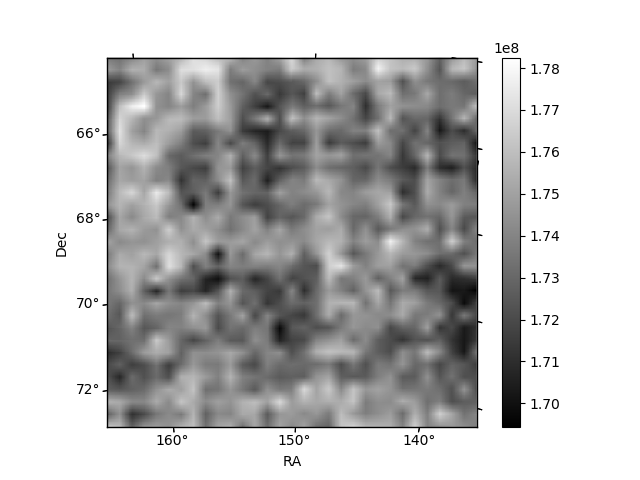
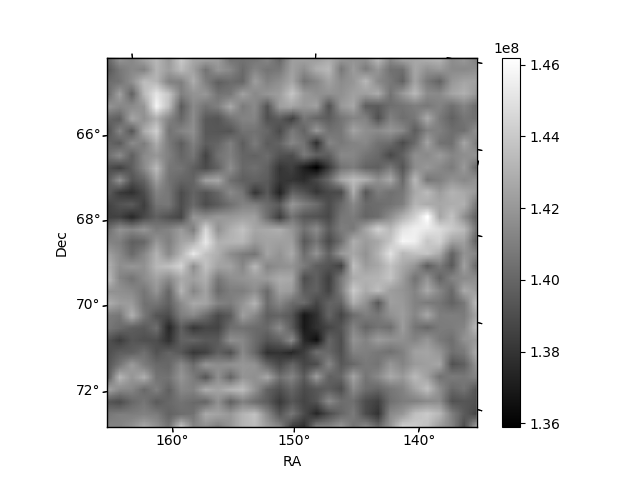
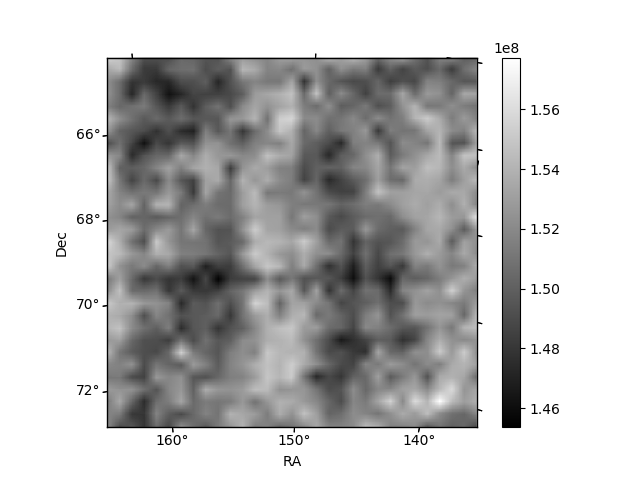
Histogram calculated using DETX and DETY for each event in the final _common_clean file
| Quadrant A | 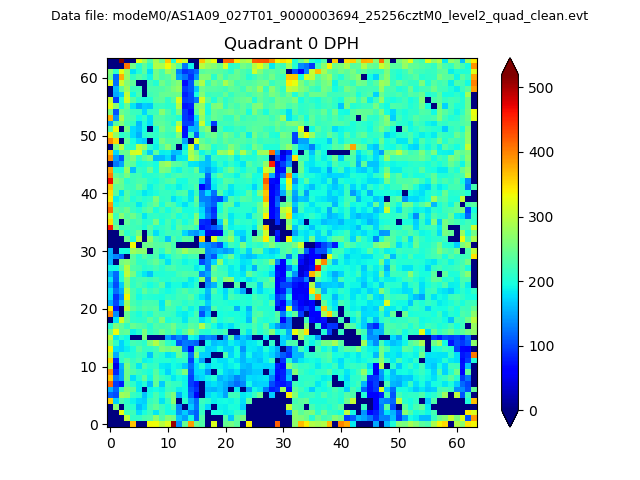 |
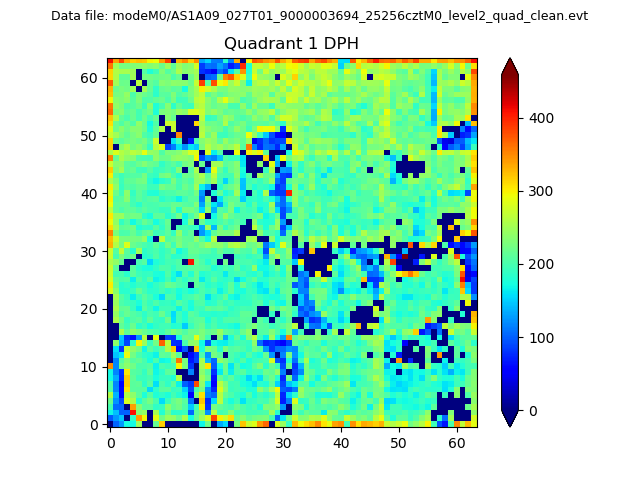 |
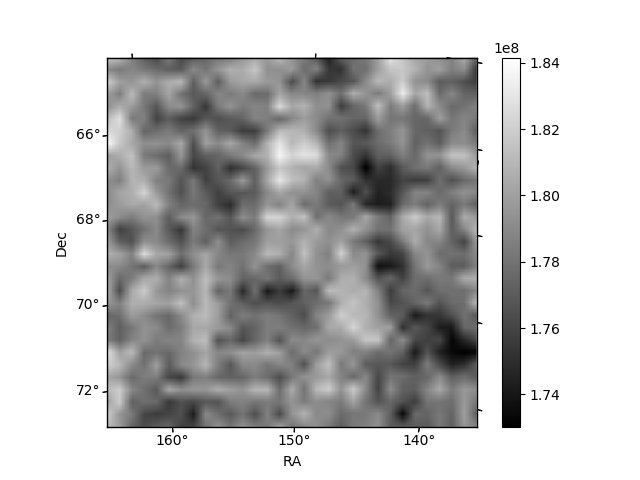
Quadrant B |
|---|---|---|---|
| Quadrant D | 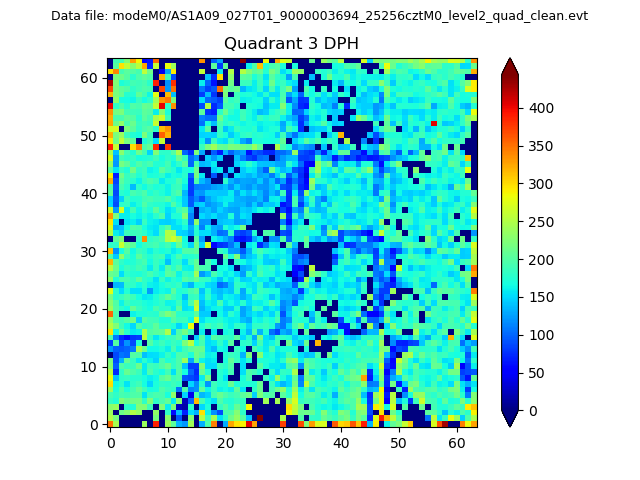 |
 |
Quadrant C |
| Plot type | Count rate plots | Images |
|---|---|---|
| Comparison with Poisson distribution Blue bars denote a histogram of data divided into 1 sec bins. Red curve is a Poisson curve with rate = median count rate of data. |
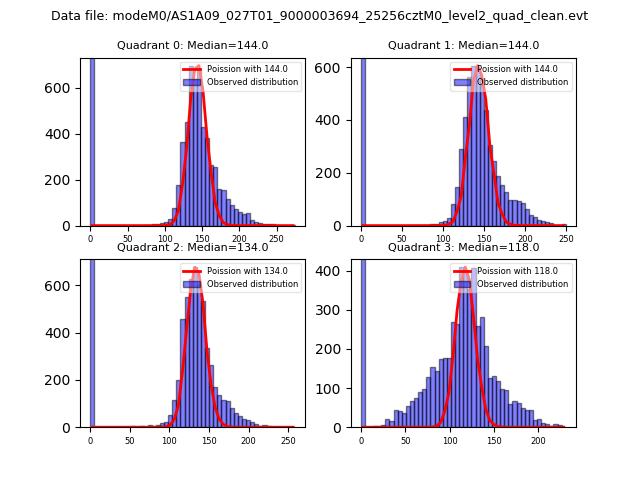 |
 |
| Quadrant-wise count rates Data is divided into 100 sec bins |
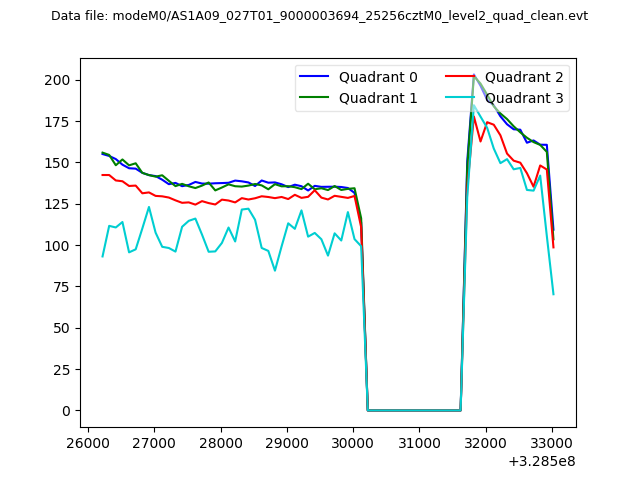 |
|
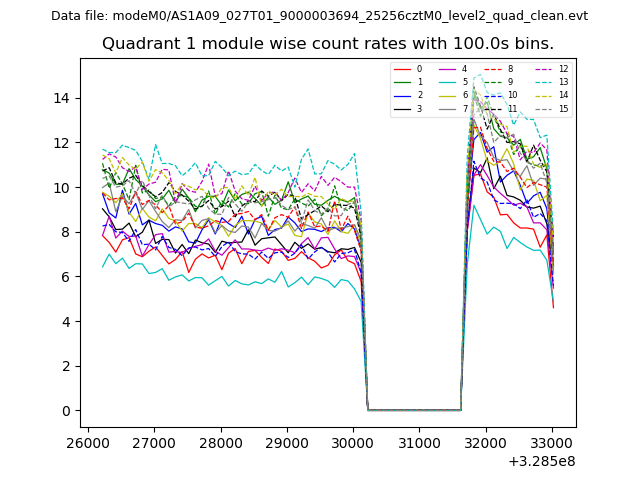
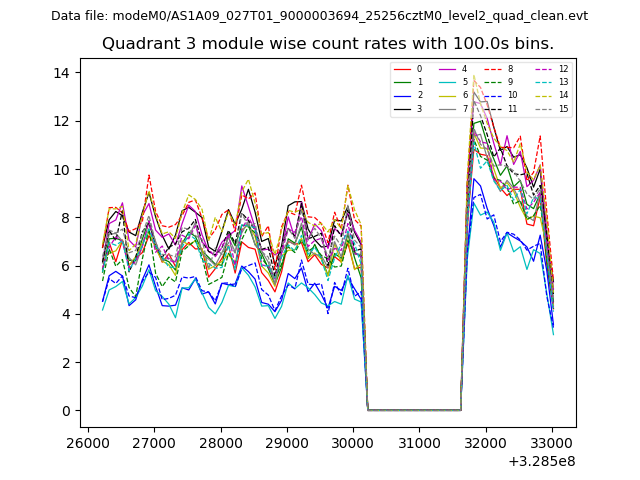
| Module-wise count rates for Quadrant A Data is divided into 100 sec bins |
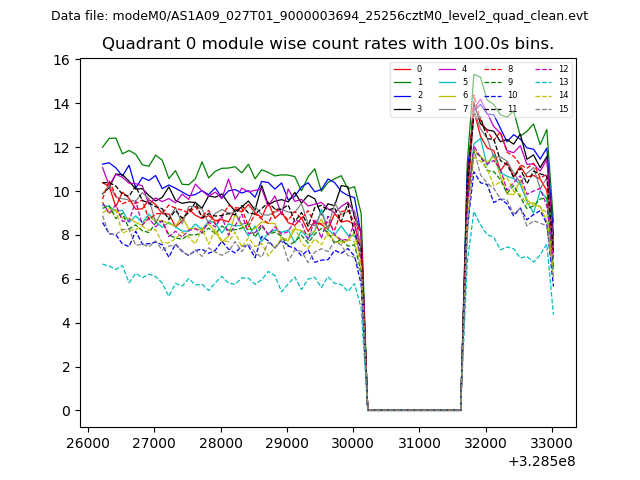 |
 |
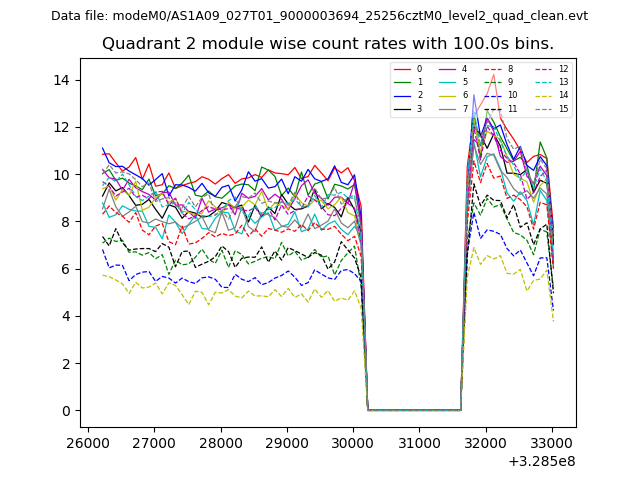
| Module-wise count rates for Quadrant B Data is divided into 100 sec bins |
 |
 |
| Module-wise count rates for Quadrant C Data is divided into 100 sec bins |
 |
 |
| Module-wise count rates for Quadrant D Data is divided into 100 sec bins |
 |
 |
| Parameter | Plot |
|---|---|
| CZT HV Monitor | 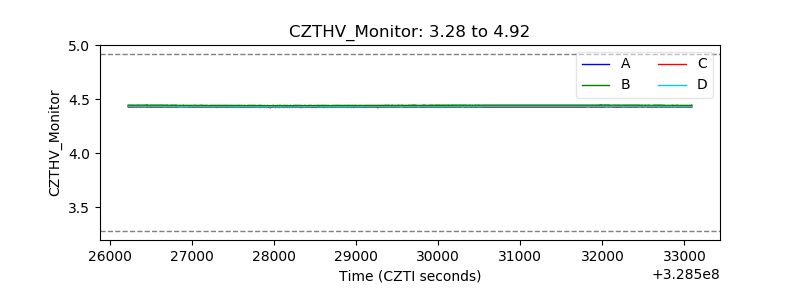 |
| D_VDD | 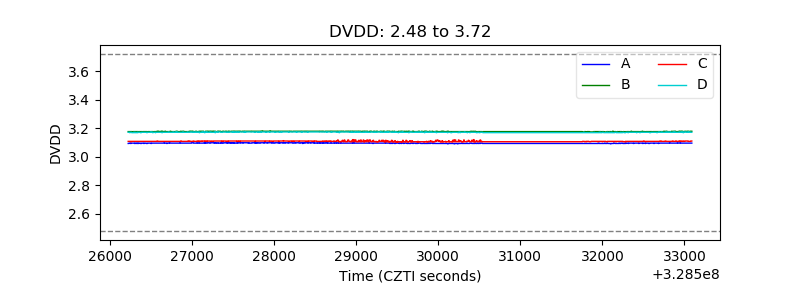 |
| Temperature 1 | 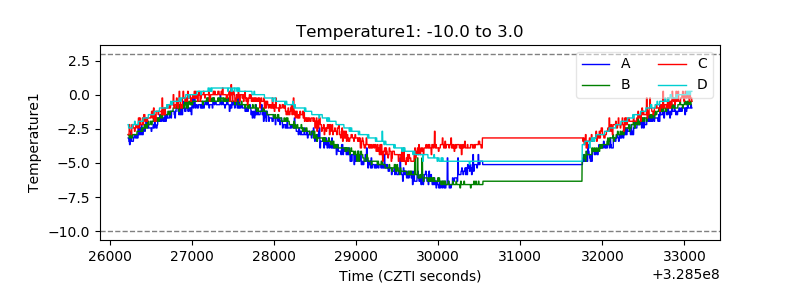 |
| Veto HV Monitor | 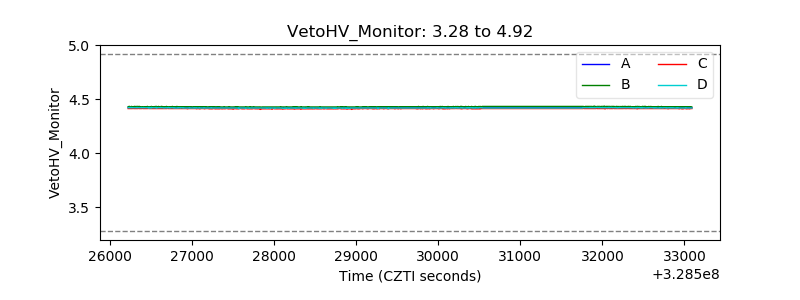 |
| Veto LLD | 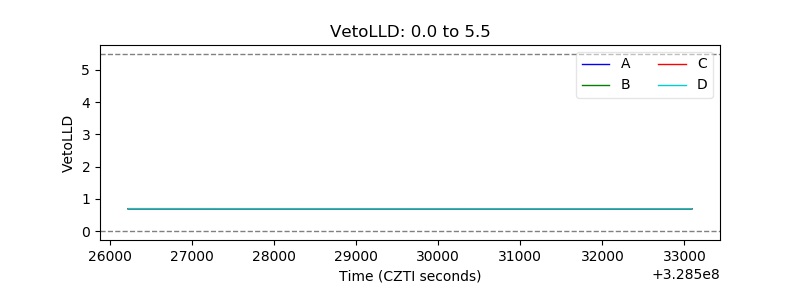 |
| Alpha Counter | 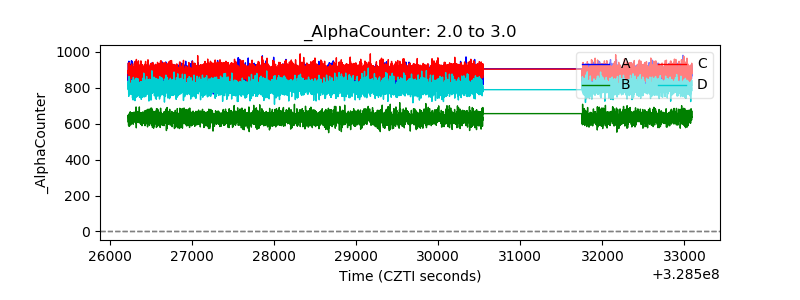 |
| _CPM_Rate |  |
| CZT Counter | 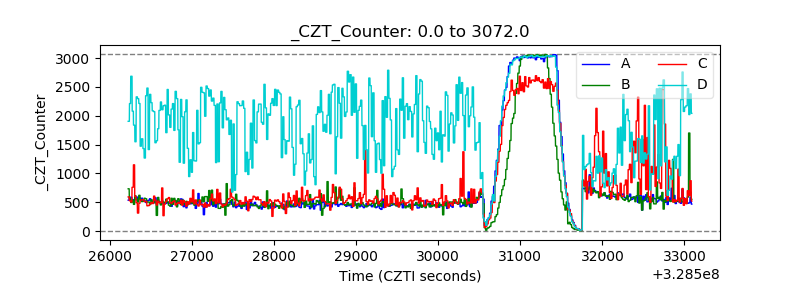 |
| +2.5 Volts monitor | 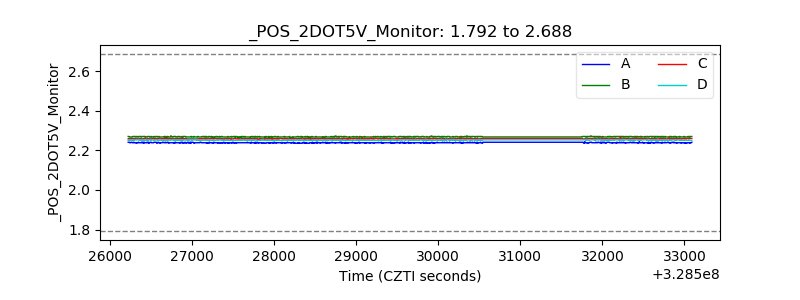 |
| +5 Volts monitor |  |
| _ROLL_ROT | 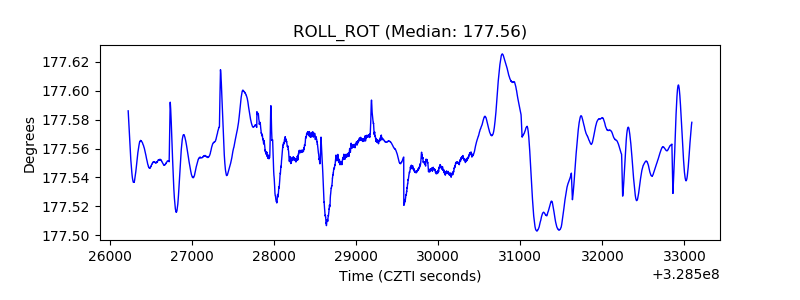 |
| _Roll_DEC | 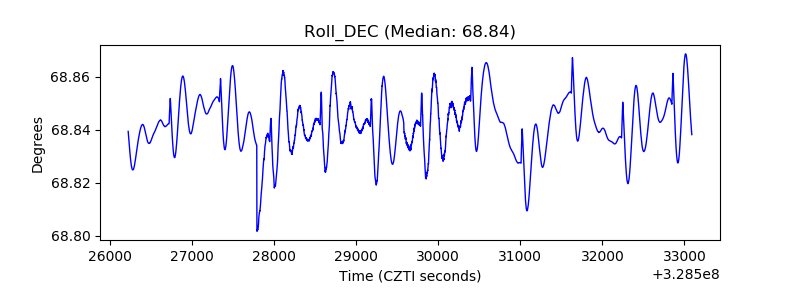 |
| _Roll_RA | 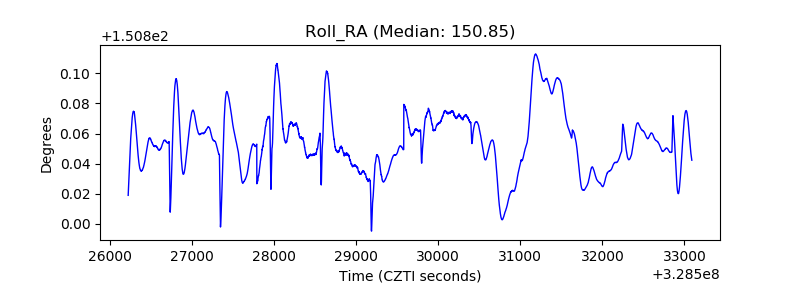 |
| Veto Counter | 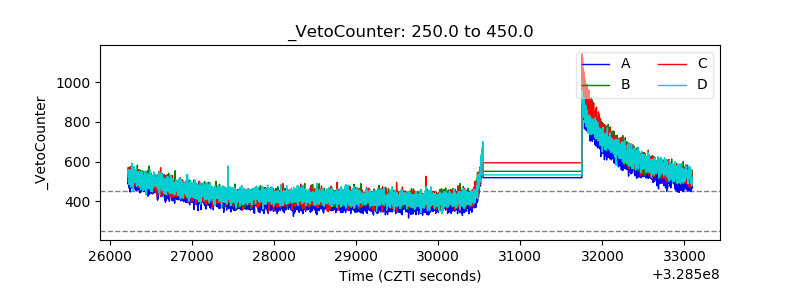 |