| Param | Original file | Final file |
|---|---|---|
| Filename | modeM0/AS1A09_027T01_9000003694_25257cztM0_level2.evt | modeM0/AS1A09_027T01_9000003694_25257cztM0_level2_quad_clean.evt |
| Size (bytes) | 754,940,160 | 125,193,600 |
| Size | 720.0 MB | 119.4 MB |
| Events in quadrant A | 3,347,918 | 908,602 |
| Events in quadrant B | 3,479,153 | 902,006 |
| Events in quadrant C | 4,140,131 | 845,788 |
| Events in quadrant D | 11,466,669 | 690,478 |
| Mode M0 | |||
|---|---|---|---|
| Quadrant | BADHDUFLAG | Total packets | Discarded packets |
| A | 0 | 13976 | 0 |
| B | 0 | 14380 | 0 |
| C | 0 | 16432 | 0 |
| D | 0 | 38478 | 0 |
| Mode M9 | |||
|---|---|---|---|
| Quadrant | BADHDUFLAG | Total packets | Discarded packets |
| A | 0 | 12 | 0 |
| B | 0 | 12 | 0 |
| C | 0 | 12 | 0 |
| D | 0 | 12 | 0 |
| Quadrant | Total seconds | Saturated seconds | Saturation percentage |
|---|---|---|---|
| A | 6357 | 66 | 1.038226% |
| B | 6358 | 89 | 1.399811% |
| C | 6358 | 227 | 3.570305% |
| D | 6357 | 2983 | 46.924650% |
Noise dominated data is calculated using 1-second bins in cleaned event files. If a bin has >2000 counts, and if more than 50% of those come from <1% of pixels, then it is considered to be noise-dominated and hence unusable.
| Quadrant | # 1 sec bins | Bins with >0 counts | Bins with >2000 counts | High rate bins dominated by noise | Noise dominated (total time) | Noise dominated (detector-on time) | Marked lightcurve |
|---|---|---|---|---|---|---|---|
| A | 7612 | 6358 | 0 | 0 | 0.00% | 0.00% | 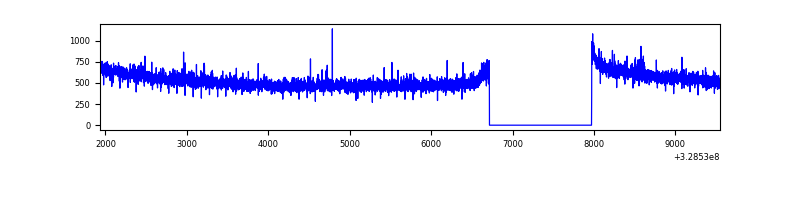 |
| B | 7613 | 6359 | 8 | 8 | 0.11% | 0.13% | 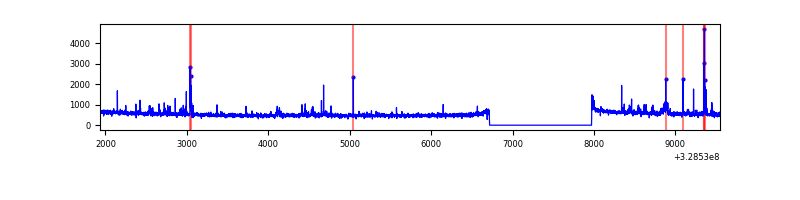 |
| C | 7613 | 6359 | 68 | 68 | 0.89% | 1.07% | 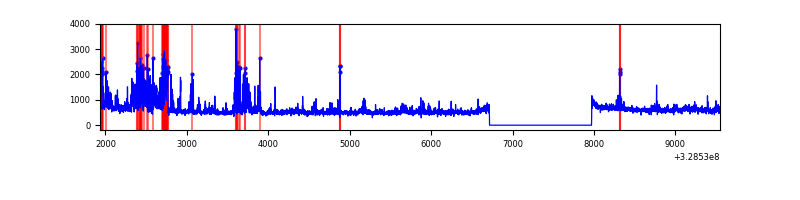 |
| D | 7612 | 6358 | 2733 | 2733 | 35.90% | 42.99% | 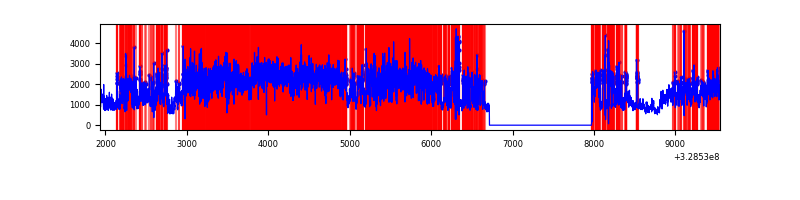 |
Top three noisy pixels from each quadrant. If the there are fewer than three noisy pixels in the level2.evt file, extra rows are filled as -1
| Pixel properties | Quadrant properties | ||||||
|---|---|---|---|---|---|---|---|
| Quadrant | DetID | PixID | Counts | Sigma | Mean | Median | Sigma |
| A | 3 | 1 | 28603 | 163.15 | 859 | 844 | 170.1 |
| A | 13 | 254 | 10870 | 58.93 | 859 | 844 | 170.1 |
| A | 0 | 226 | 7584 | 39.61 | 859 | 844 | 170.1 |
| B | 0 | 190 | 54968 | 352.1 | 839 | 818 | 153.8 |
| B | 0 | 229 | 49317 | 315.36 | 839 | 818 | 153.8 |
| B | 15 | 33 | 34637 | 219.9 | 839 | 818 | 153.8 |
| C | 2 | 16 | 657682 | 3554.92 | 806 | 812 | 184.8 |
| C | 3 | 233 | 132499 | 712.68 | 806 | 812 | 184.8 |
| C | 14 | 238 | 130542 | 702.09 | 806 | 812 | 184.8 |
| D | 1 | 239 | 4726627 | 27690.39 | 721 | 702 | 170.7 |
| D | 9 | 35 | 2234882 | 13090.63 | 721 | 702 | 170.7 |
| D | 8 | 195 | 1331129 | 7795.31 | 721 | 702 | 170.7 |
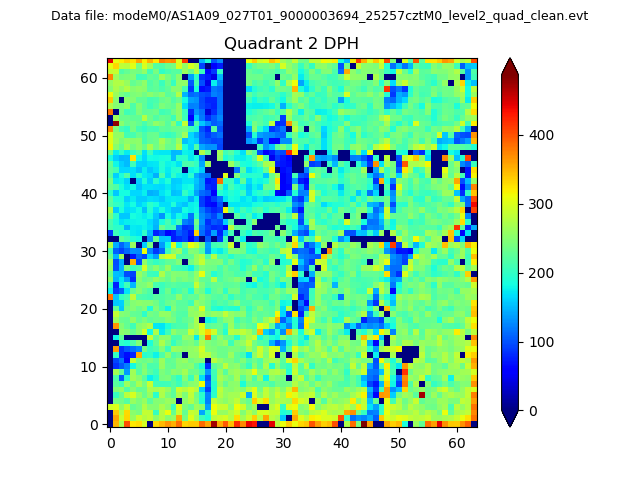
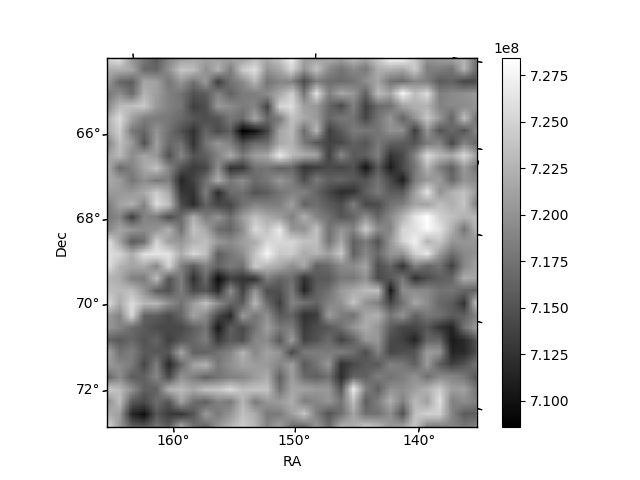
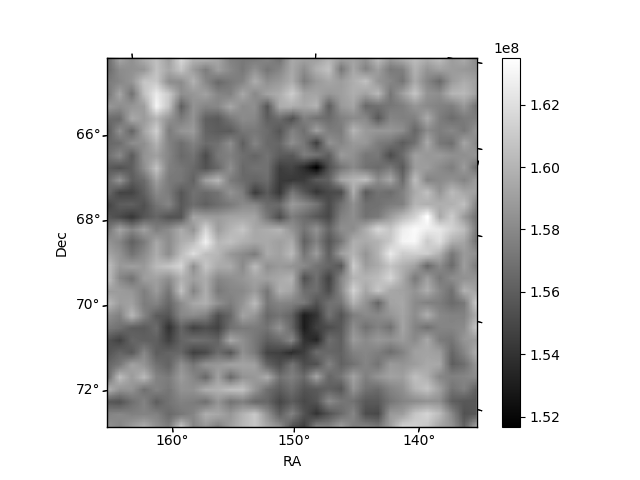
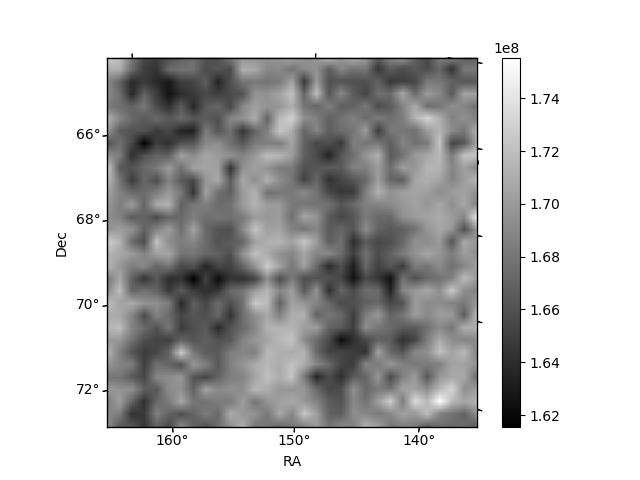
Histogram calculated using DETX and DETY for each event in the final _common_clean file
| Quadrant A | 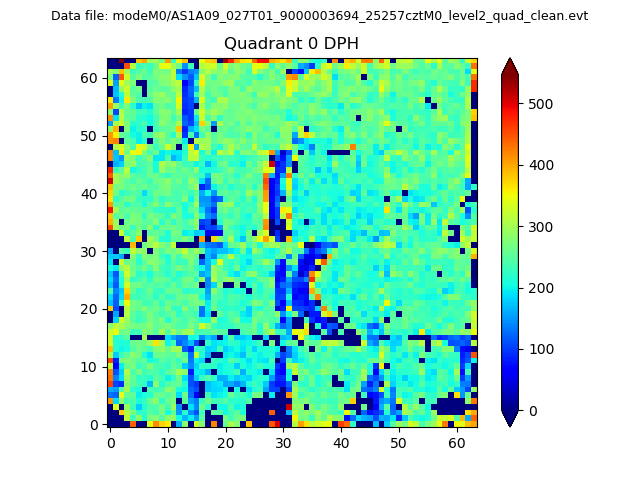 |
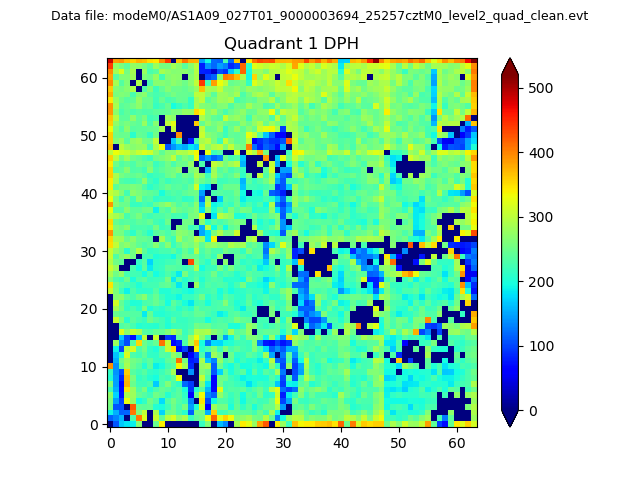 |
Quadrant B |
|---|---|---|---|
| Quadrant D | 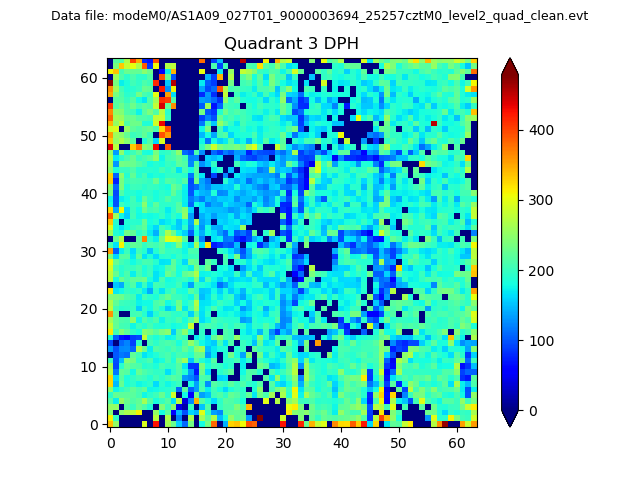 |
 |
Quadrant C |
| Plot type | Count rate plots | Images |
|---|---|---|
| Comparison with Poisson distribution Blue bars denote a histogram of data divided into 1 sec bins. Red curve is a Poisson curve with rate = median count rate of data. |
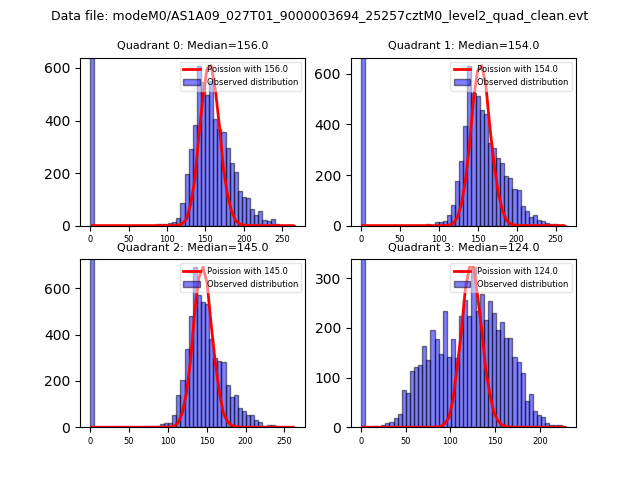 |
 |
| Quadrant-wise count rates Data is divided into 100 sec bins |
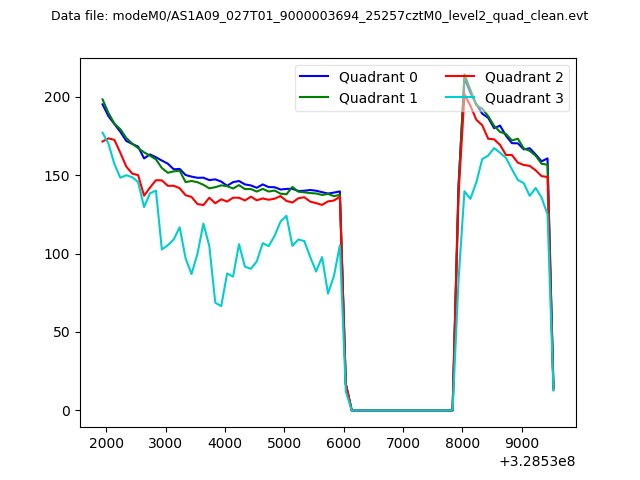 |
|
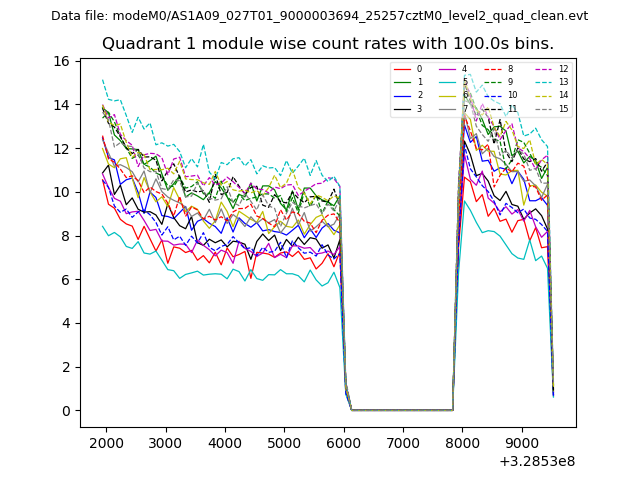
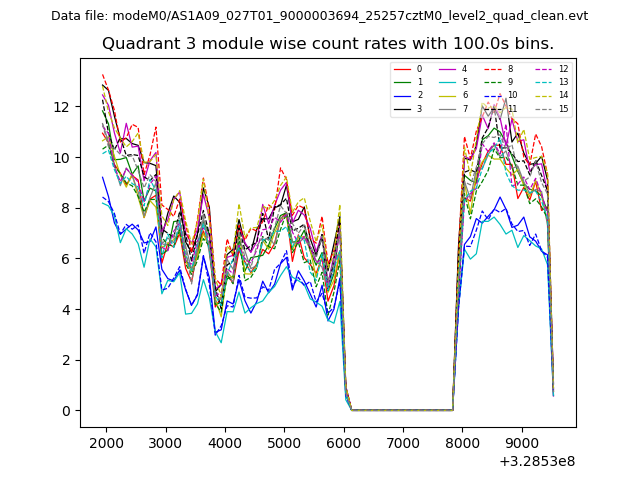
| Module-wise count rates for Quadrant A Data is divided into 100 sec bins |
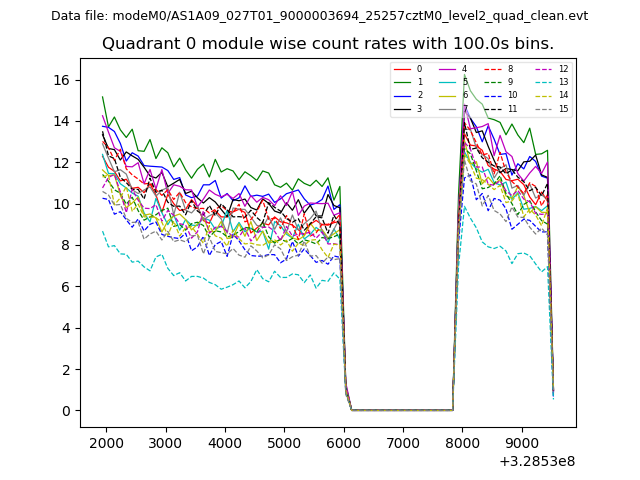 |
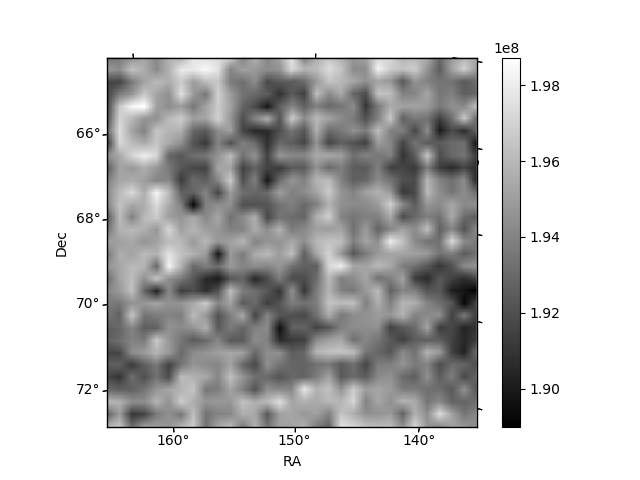 |
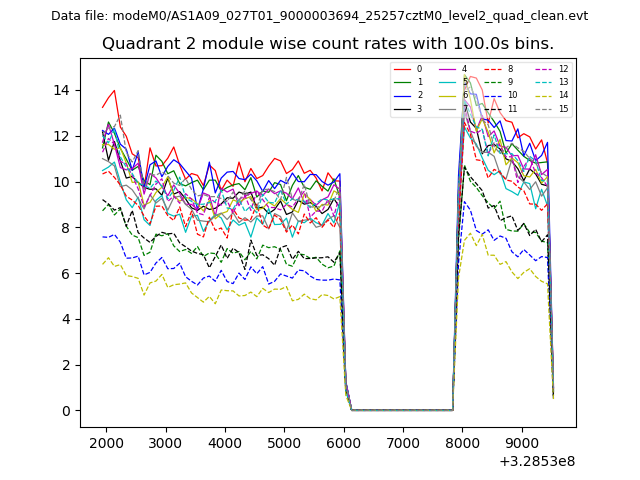
| Module-wise count rates for Quadrant B Data is divided into 100 sec bins |
 |
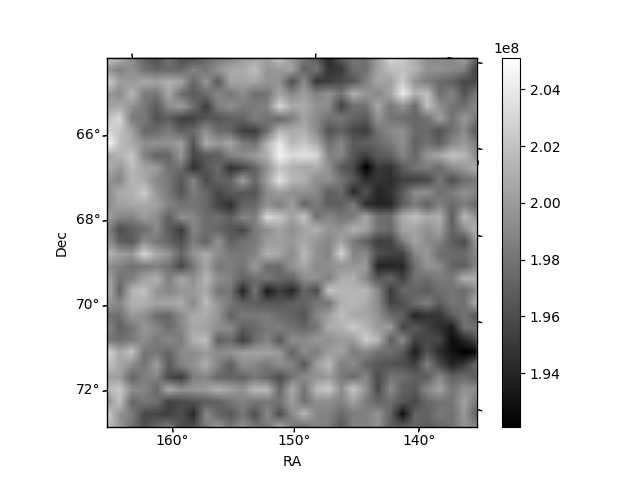 |
| Module-wise count rates for Quadrant C Data is divided into 100 sec bins |
 |
 |
| Module-wise count rates for Quadrant D Data is divided into 100 sec bins |
 |
 |
| Parameter | Plot |
|---|---|
| CZT HV Monitor | 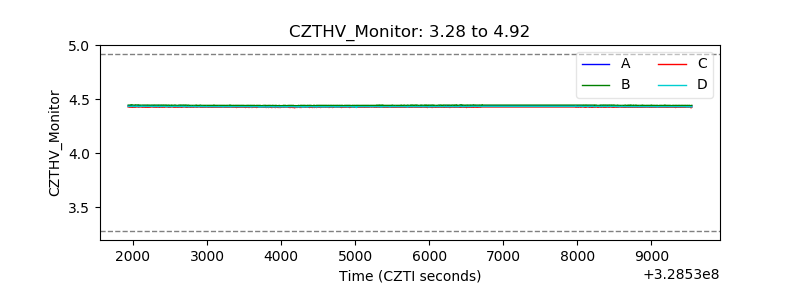 |
| D_VDD | 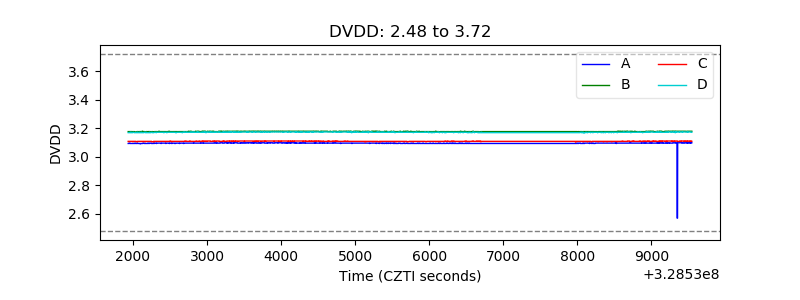 |
| Temperature 1 | 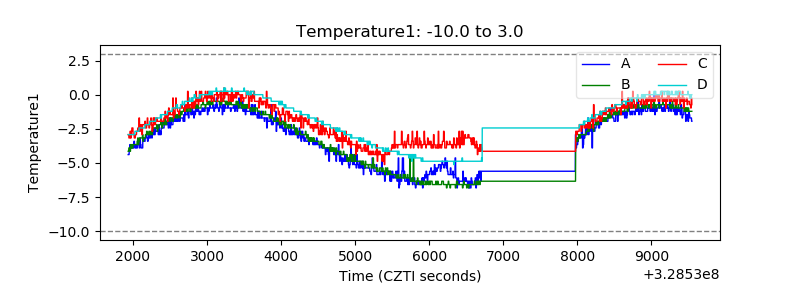 |
| Veto HV Monitor | 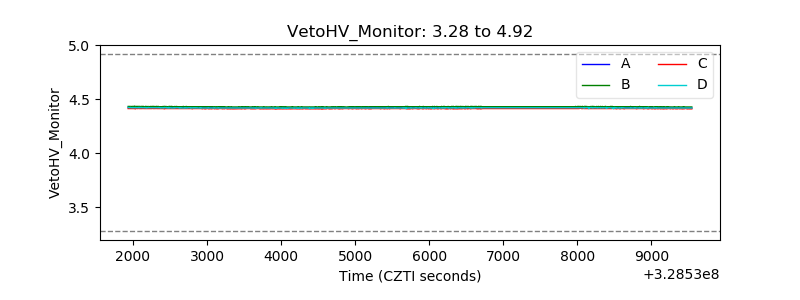 |
| Veto LLD | 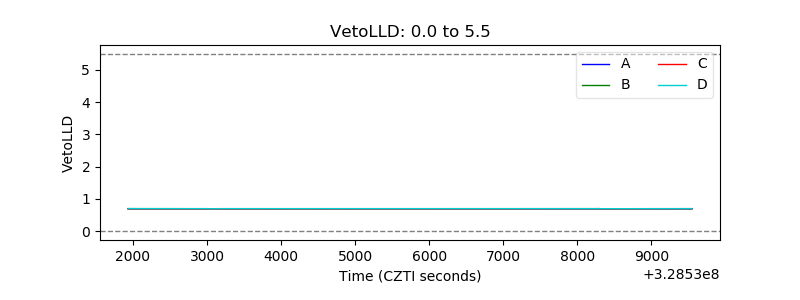 |
| Alpha Counter | 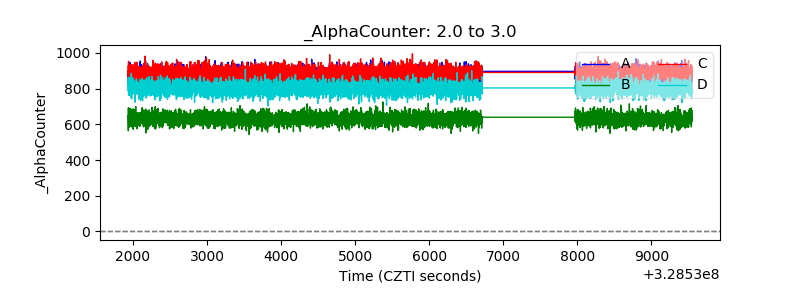 |
| _CPM_Rate | 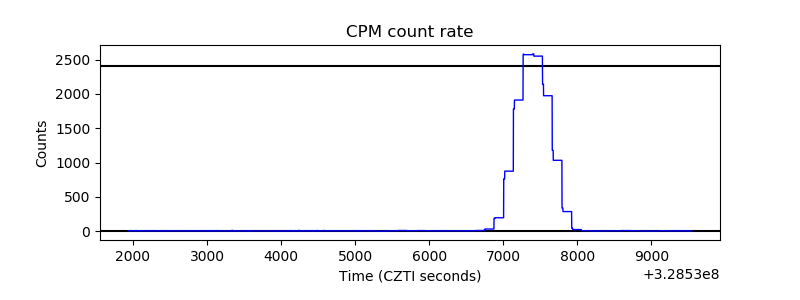 |
| CZT Counter | 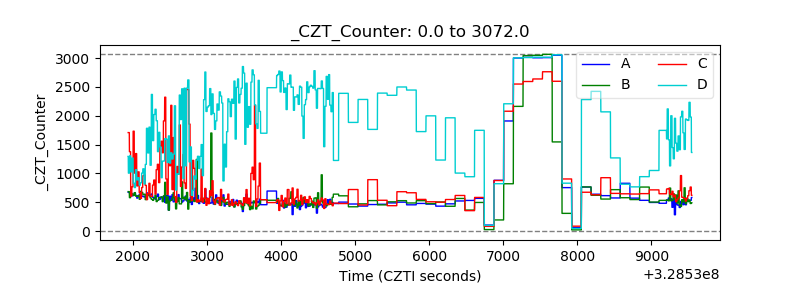 |
| +2.5 Volts monitor |  |
| +5 Volts monitor | 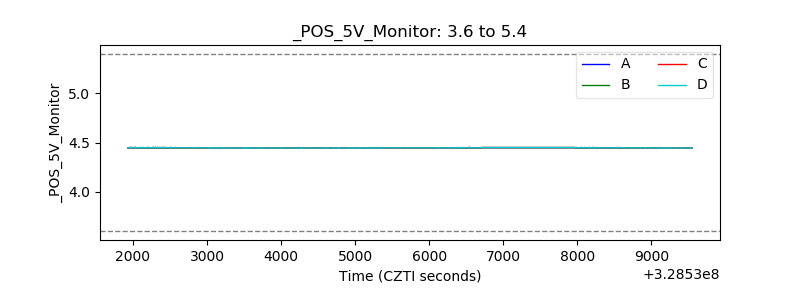 |
| _ROLL_ROT | 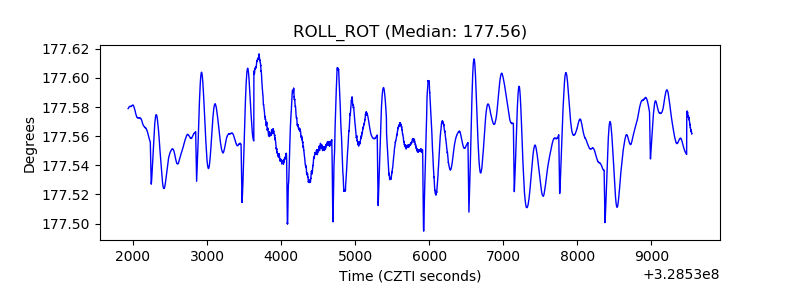 |
| _Roll_DEC | 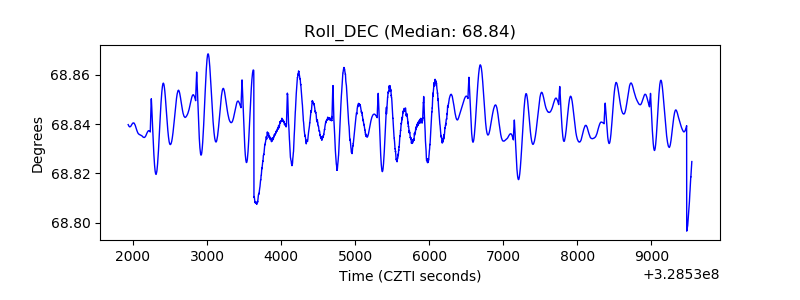 |
| _Roll_RA | 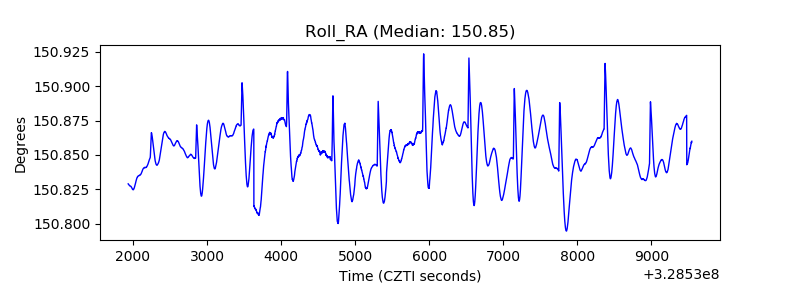 |
| Veto Counter | 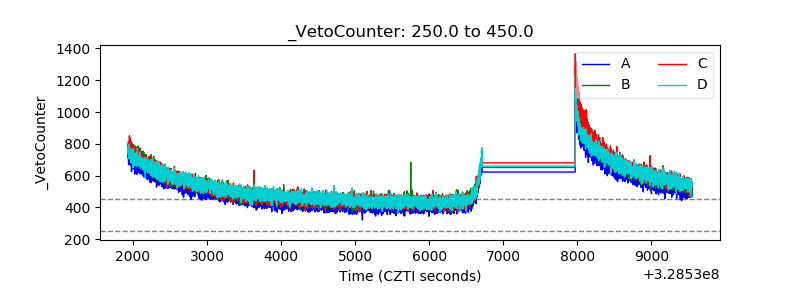 |