| Param | Original file | Final file |
|---|---|---|
| Filename | modeM0/AS1A09_027T01_9000003694_25258cztM0_level2.evt | modeM0/AS1A09_027T01_9000003694_25258cztM0_level2_quad_clean.evt |
| Size (bytes) | 707,644,800 | 116,887,680 |
| Size | 674.9 MB | 111.5 MB |
| Events in quadrant A | 3,204,526 | 830,030 |
| Events in quadrant B | 3,549,198 | 824,507 |
| Events in quadrant C | 4,304,674 | 771,811 |
| Events in quadrant D | 9,958,349 | 684,631 |
| Mode M0 | |||
|---|---|---|---|
| Quadrant | BADHDUFLAG | Total packets | Discarded packets |
| A | 0 | 13375 | 0 |
| B | 0 | 14439 | 0 |
| C | 0 | 16938 | 0 |
| D | 0 | 33893 | 0 |
| Mode M9 | |||
|---|---|---|---|
| Quadrant | BADHDUFLAG | Total packets | Discarded packets |
| A | 0 | 13 | 0 |
| B | 0 | 13 | 0 |
| C | 0 | 13 | 0 |
| D | 0 | 13 | 0 |
| Quadrant | Total seconds | Saturated seconds | Saturation percentage |
|---|---|---|---|
| A | 6137 | 58 | 0.945087% |
| B | 6137 | 85 | 1.385042% |
| C | 6137 | 396 | 6.452664% |
| D | 6137 | 1788 | 29.134756% |
Noise dominated data is calculated using 1-second bins in cleaned event files. If a bin has >2000 counts, and if more than 50% of those come from <1% of pixels, then it is considered to be noise-dominated and hence unusable.
| Quadrant | # 1 sec bins | Bins with >0 counts | Bins with >2000 counts | High rate bins dominated by noise | Noise dominated (total time) | Noise dominated (detector-on time) | Marked lightcurve |
|---|---|---|---|---|---|---|---|
| A | 7472 | 6138 | 0 | 0 | 0.00% | 0.00% | 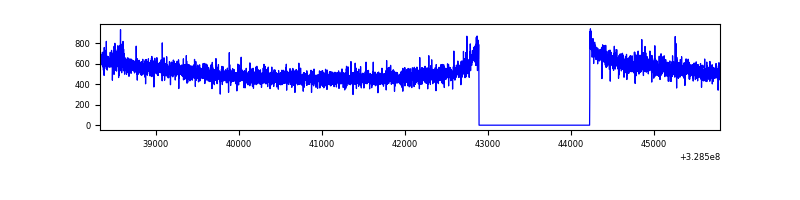 |
| B | 7472 | 6138 | 17 | 17 | 0.23% | 0.28% | 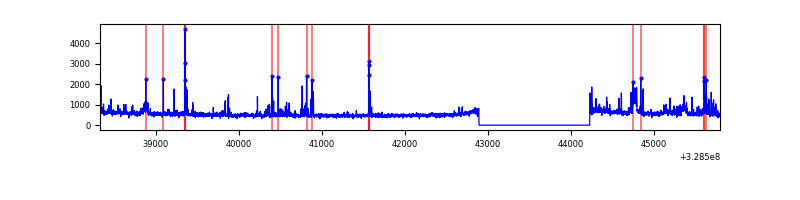 |
| C | 7472 | 6138 | 161 | 161 | 2.15% | 2.62% | 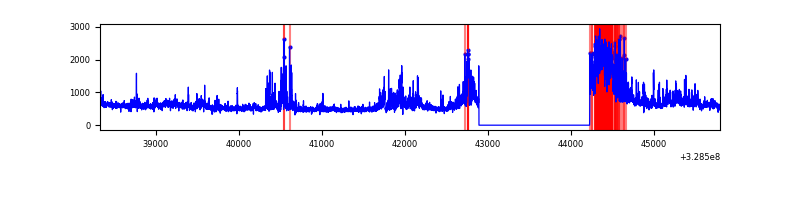 |
| D | 7472 | 6138 | 1677 | 1677 | 22.44% | 27.32% | 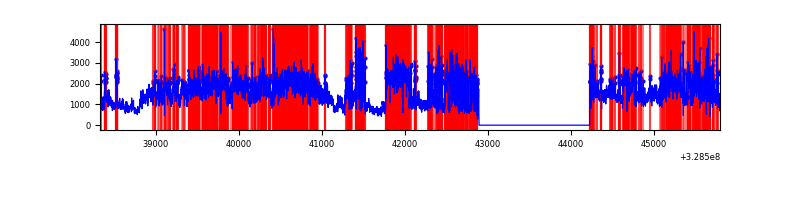 |
Top three noisy pixels from each quadrant. If the there are fewer than three noisy pixels in the level2.evt file, extra rows are filled as -1
| Pixel properties | Quadrant properties | ||||||
|---|---|---|---|---|---|---|---|
| Quadrant | DetID | PixID | Counts | Sigma | Mean | Median | Sigma |
| A | 3 | 1 | 22198 | 132.11 | 824 | 810 | 161.9 |
| A | 13 | 254 | 10322 | 58.75 | 824 | 810 | 161.9 |
| A | 0 | 226 | 7348 | 40.38 | 824 | 810 | 161.9 |
| B | 3 | 64 | 124332 | 842.46 | 807 | 792 | 146.6 |
| B | 15 | 33 | 116946 | 792.1 | 807 | 792 | 146.6 |
| B | 0 | 190 | 58621 | 394.36 | 807 | 792 | 146.6 |
| C | 0 | 239 | 823118 | 4644.53 | 777 | 785 | 177.1 |
| C | 3 | 233 | 306897 | 1728.92 | 777 | 785 | 177.1 |
| C | 14 | 238 | 125675 | 705.38 | 777 | 785 | 177.1 |
| D | 1 | 239 | 3351473 | 19239.64 | 732 | 715 | 174.2 |
| D | 9 | 35 | 2048099 | 11755.83 | 732 | 715 | 174.2 |
| D | 8 | 195 | 1338653 | 7682.28 | 732 | 715 | 174.2 |
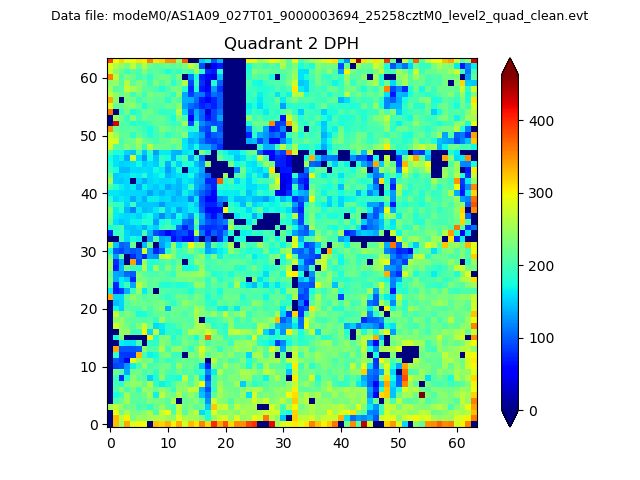
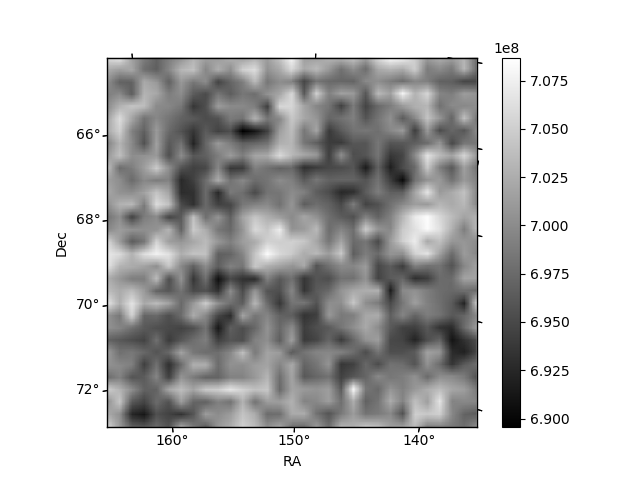
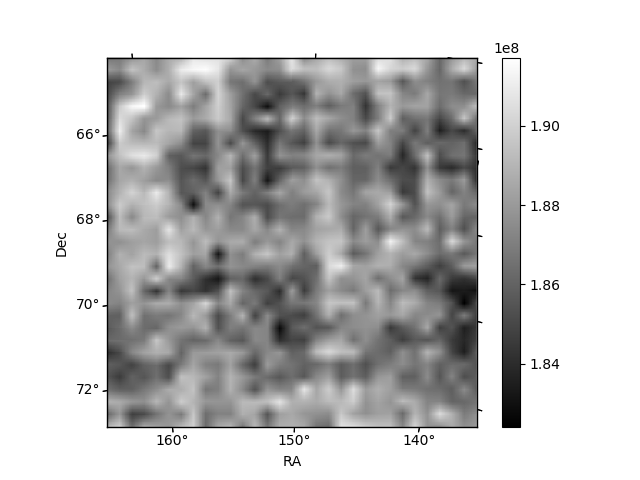
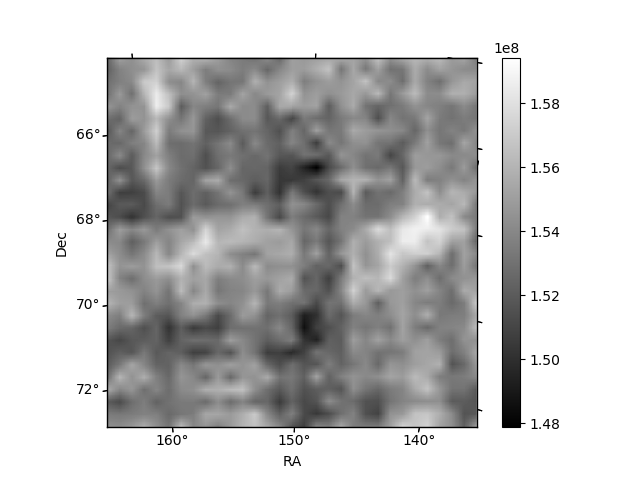
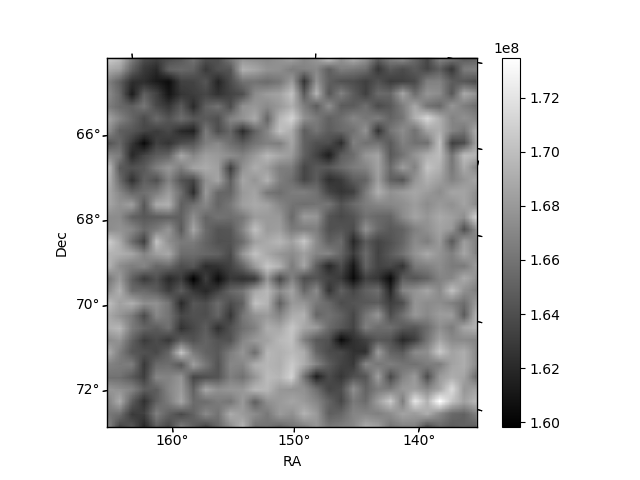
Histogram calculated using DETX and DETY for each event in the final _common_clean file
| Quadrant A | 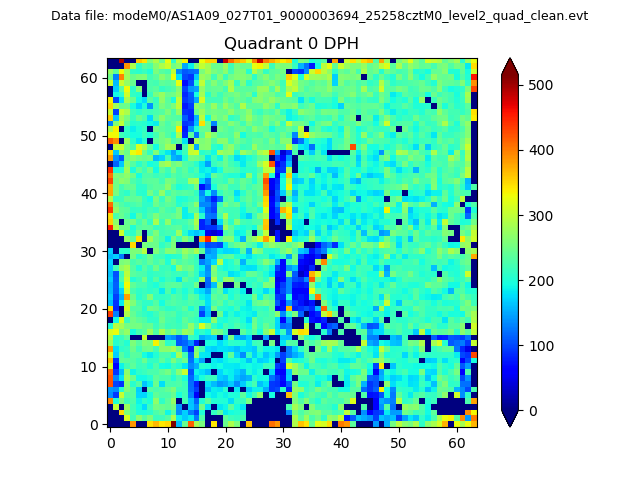 |
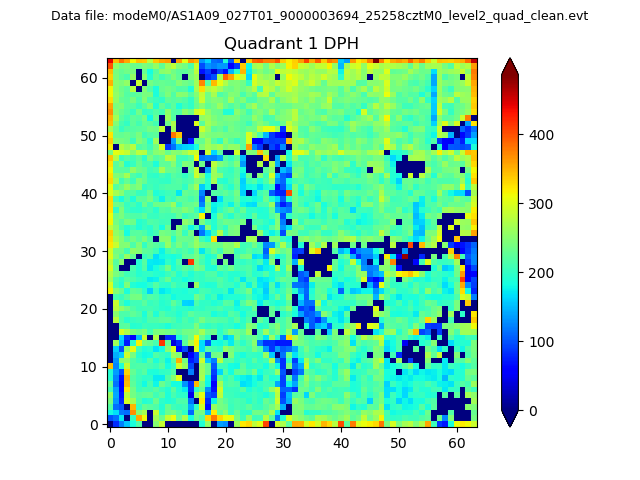 |
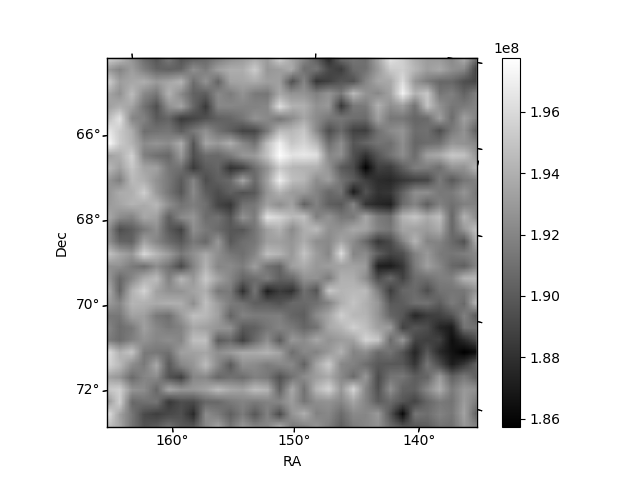
Quadrant B |
|---|---|---|---|
| Quadrant D | 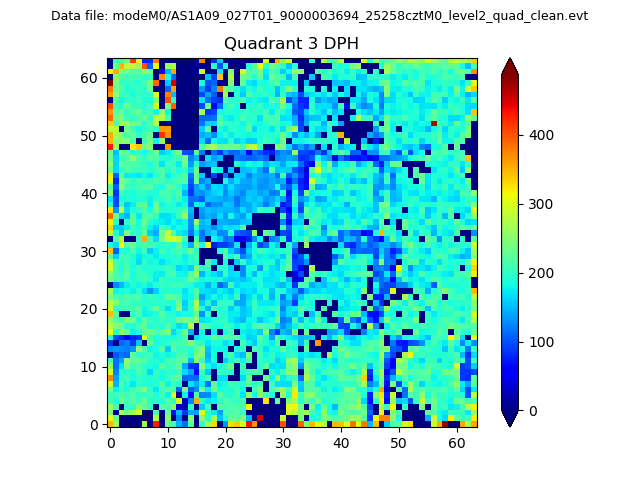 |
 |
Quadrant C |
| Plot type | Count rate plots | Images |
|---|---|---|
| Comparison with Poisson distribution Blue bars denote a histogram of data divided into 1 sec bins. Red curve is a Poisson curve with rate = median count rate of data. |
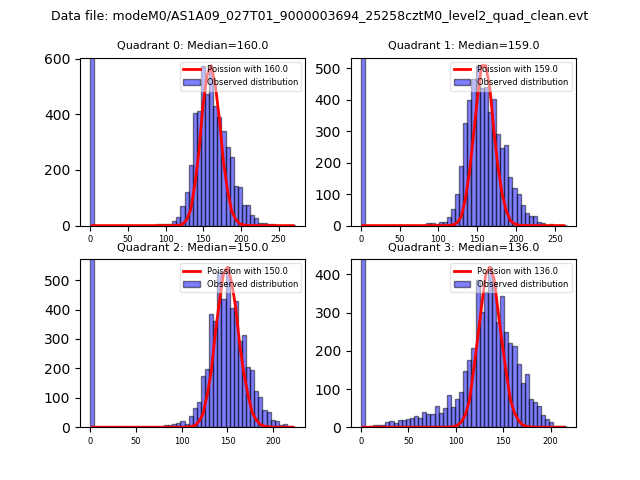 |
 |
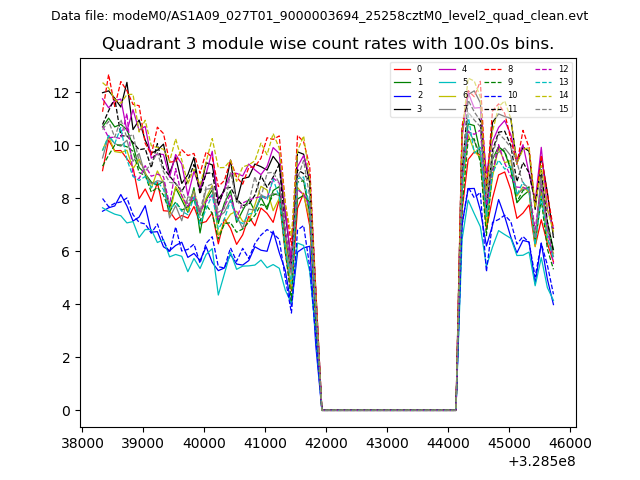
| Quadrant-wise count rates Data is divided into 100 sec bins |
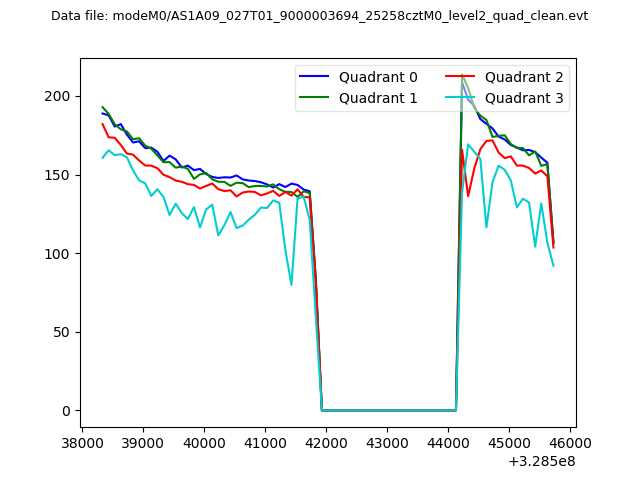 |
|
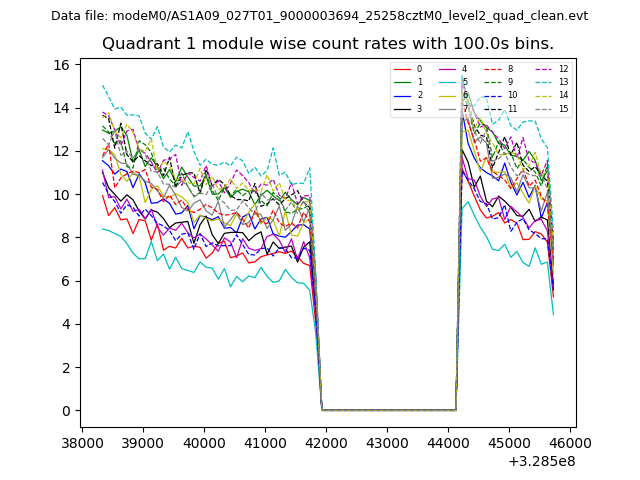
| Module-wise count rates for Quadrant A Data is divided into 100 sec bins |
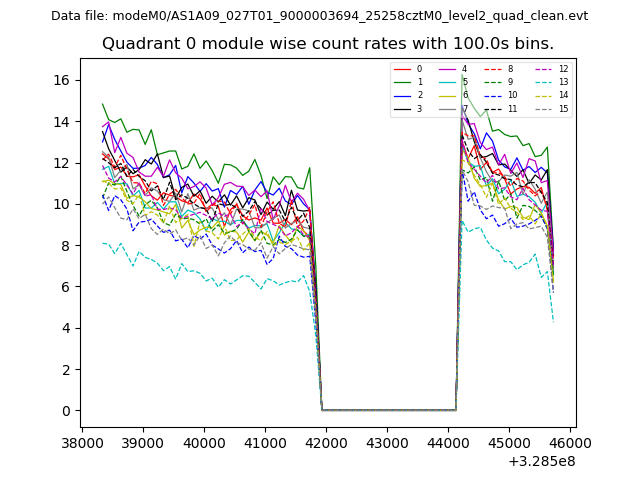 |
 |
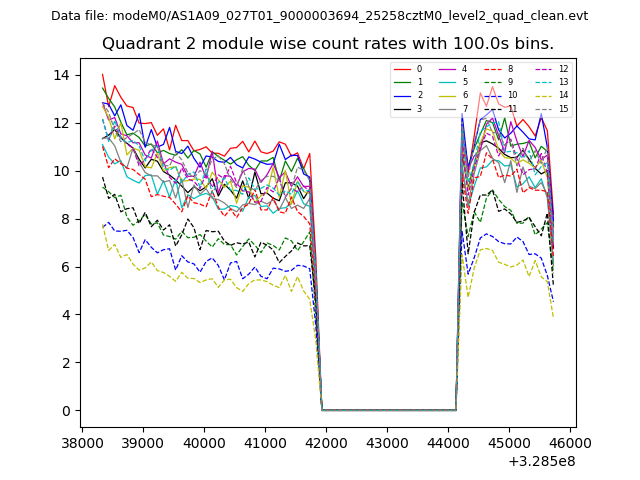
| Module-wise count rates for Quadrant B Data is divided into 100 sec bins |
 |
 |
| Module-wise count rates for Quadrant C Data is divided into 100 sec bins |
 |
 |
| Module-wise count rates for Quadrant D Data is divided into 100 sec bins |
 |
 |
| Parameter | Plot |
|---|---|
| CZT HV Monitor | 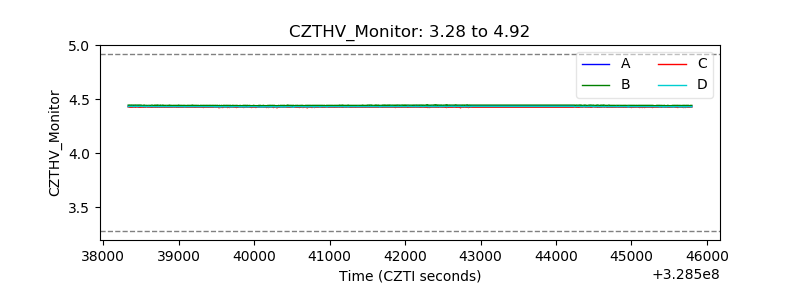 |
| D_VDD | 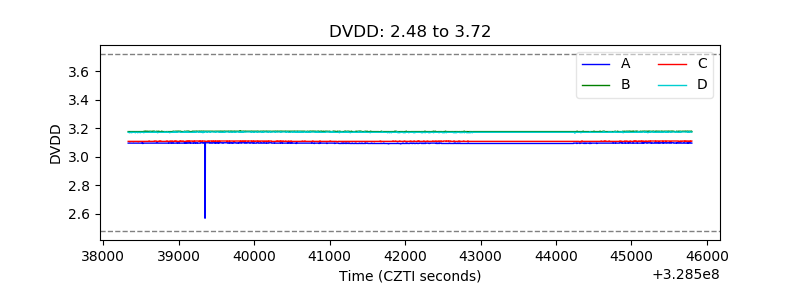 |
| Temperature 1 | 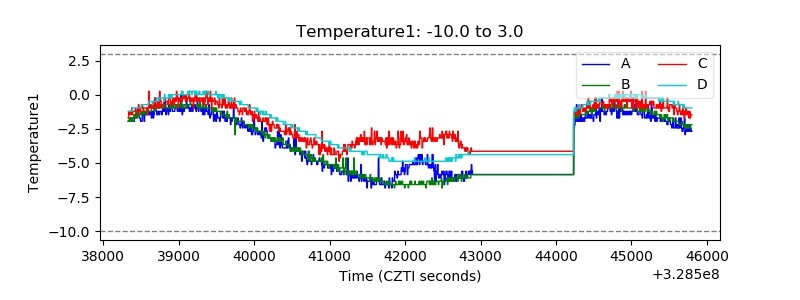 |
| Veto HV Monitor | 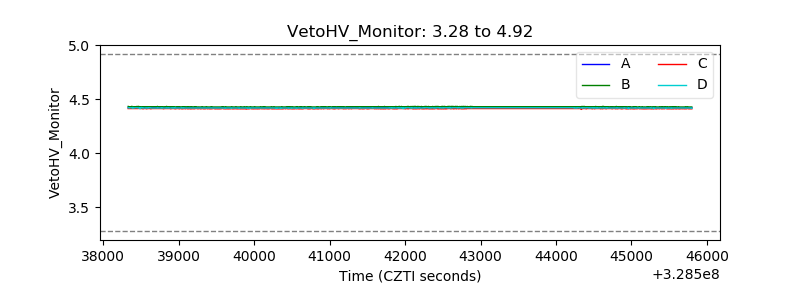 |
| Veto LLD | 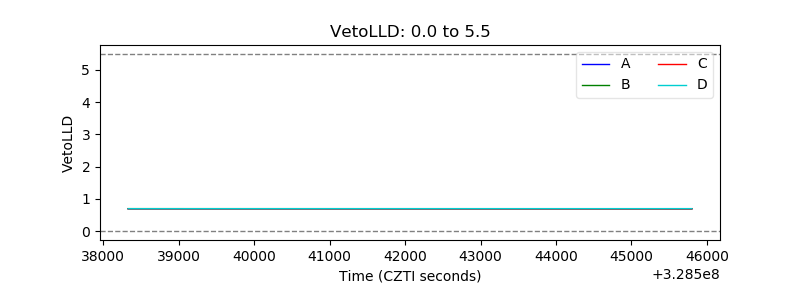 |
| Alpha Counter | 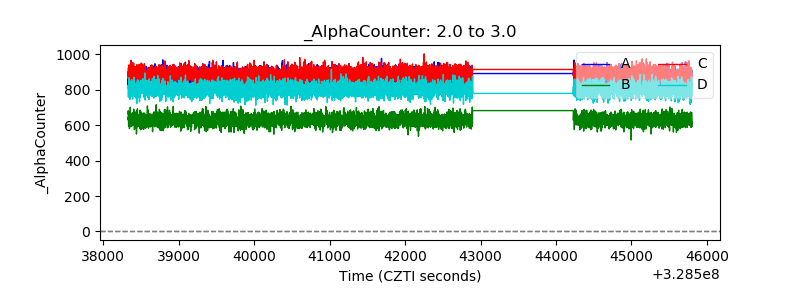 |
| _CPM_Rate | 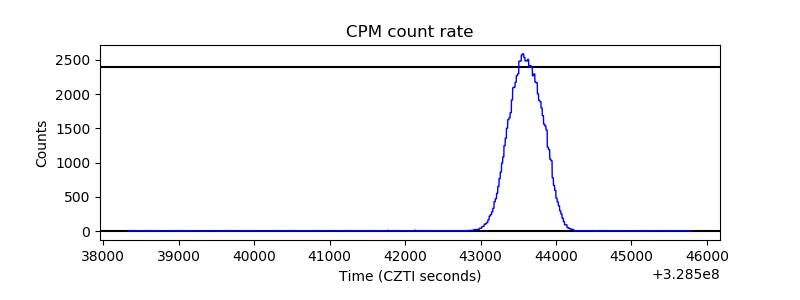 |
| CZT Counter | 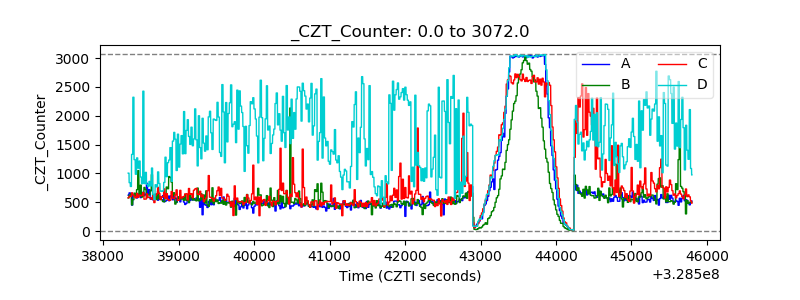 |
| +2.5 Volts monitor | 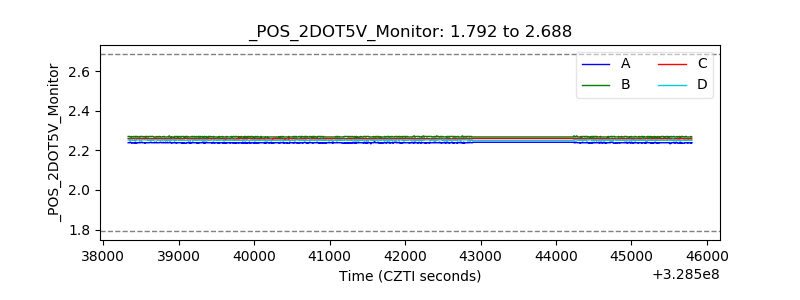 |
| +5 Volts monitor |  |
| _ROLL_ROT |  |
| _Roll_DEC | 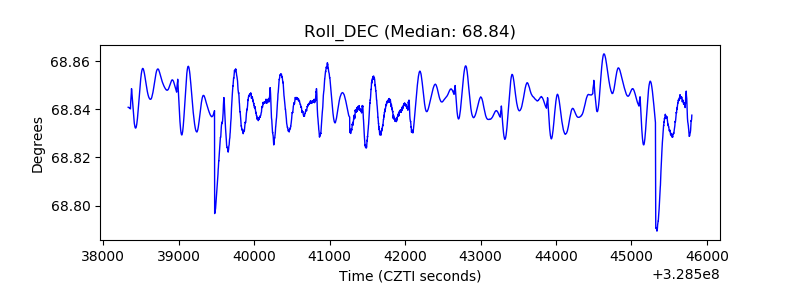 |
| _Roll_RA | 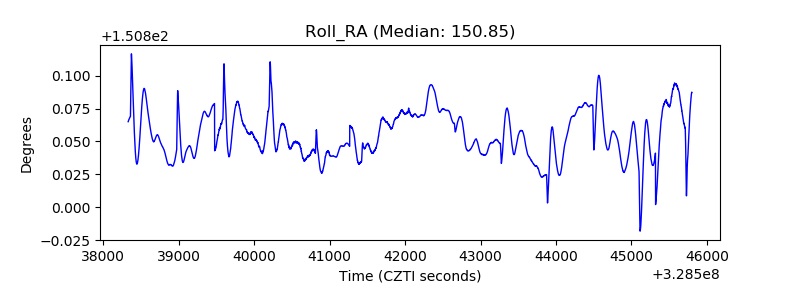 |
| Veto Counter | 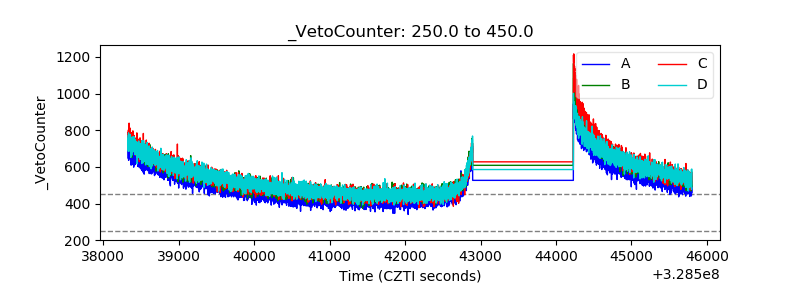 |