| Param | Original file | Final file |
|---|---|---|
| Filename | modeM0/AS1A09_027T01_9000003694_25259cztM0_level2.evt | modeM0/AS1A09_027T01_9000003694_25259cztM0_level2_quad_clean.evt |
| Size (bytes) | 661,190,400 | 99,639,360 |
| Size | 630.6 MB | 95.0 MB |
| Events in quadrant A | 3,129,689 | 692,434 |
| Events in quadrant B | 3,480,011 | 693,893 |
| Events in quadrant C | 3,584,257 | 667,099 |
| Events in quadrant D | 9,440,029 | 559,564 |
| Mode M0 | |||
|---|---|---|---|
| Quadrant | BADHDUFLAG | Total packets | Discarded packets |
| A | 0 | 12942 | 0 |
| B | 0 | 13997 | 0 |
| C | 0 | 14485 | 0 |
| D | 0 | 32021 | 0 |
| Mode M9 | |||
|---|---|---|---|
| Quadrant | BADHDUFLAG | Total packets | Discarded packets |
| A | 0 | 13 | 0 |
| B | 0 | 13 | 0 |
| C | 0 | 13 | 0 |
| D | 0 | 13 | 0 |
| Quadrant | Total seconds | Saturated seconds | Saturation percentage |
|---|---|---|---|
| A | 5777 | 54 | 0.934741% |
| B | 5778 | 131 | 2.267220% |
| C | 5778 | 145 | 2.509519% |
| D | 5777 | 1711 | 29.617449% |
Noise dominated data is calculated using 1-second bins in cleaned event files. If a bin has >2000 counts, and if more than 50% of those come from <1% of pixels, then it is considered to be noise-dominated and hence unusable.
| Quadrant | # 1 sec bins | Bins with >0 counts | Bins with >2000 counts | High rate bins dominated by noise | Noise dominated (total time) | Noise dominated (detector-on time) | Marked lightcurve |
|---|---|---|---|---|---|---|---|
| A | 7102 | 5778 | 2 | 2 | 0.03% | 0.03% | 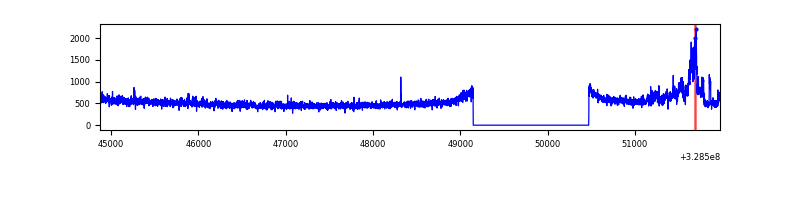 |
| B | 7103 | 5779 | 46 | 46 | 0.65% | 0.80% | 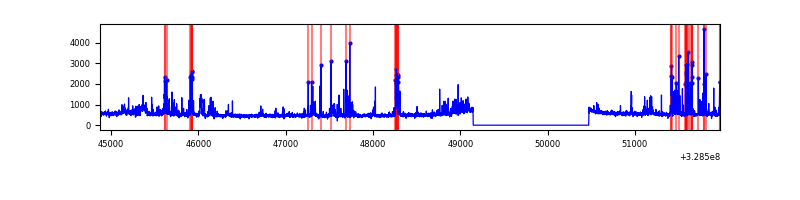 |
| C | 7103 | 5779 | 14 | 14 | 0.20% | 0.24% | 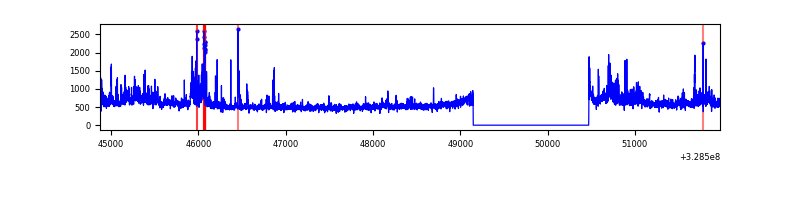 |
| D | 7102 | 5778 | 1619 | 1619 | 22.80% | 28.02% | 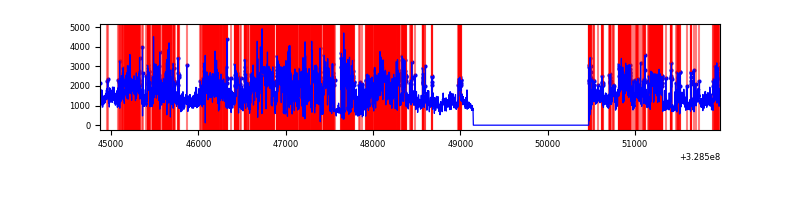 |
Top three noisy pixels from each quadrant. If the there are fewer than three noisy pixels in the level2.evt file, extra rows are filled as -1
| Pixel properties | Quadrant properties | ||||||
|---|---|---|---|---|---|---|---|
| Quadrant | DetID | PixID | Counts | Sigma | Mean | Median | Sigma |
| A | 6 | 16 | 231469 | 1560.9 | 744 | 728 | 147.8 |
| A | 3 | 1 | 22404 | 146.63 | 744 | 728 | 147.8 |
| A | 13 | 254 | 9159 | 57.03 | 744 | 728 | 147.8 |
| B | 3 | 64 | 450147 | 3329.34 | 734 | 717 | 135.0 |
| B | 15 | 33 | 70451 | 516.58 | 734 | 717 | 135.0 |
| B | 0 | 190 | 37676 | 273.79 | 734 | 717 | 135.0 |
| C | 0 | 239 | 391453 | 2354.51 | 723 | 729 | 165.9 |
| C | 3 | 233 | 203568 | 1222.31 | 723 | 729 | 165.9 |
| C | 14 | 238 | 116040 | 694.87 | 723 | 729 | 165.9 |
| D | 1 | 239 | 3393562 | 21204.44 | 665 | 648 | 160.0 |
| D | 9 | 35 | 1584063 | 9895.75 | 665 | 648 | 160.0 |
| D | 8 | 195 | 1170131 | 7308.83 | 665 | 648 | 160.0 |
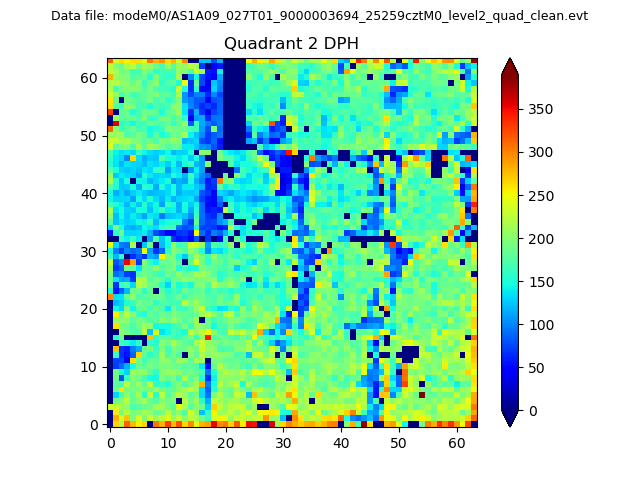
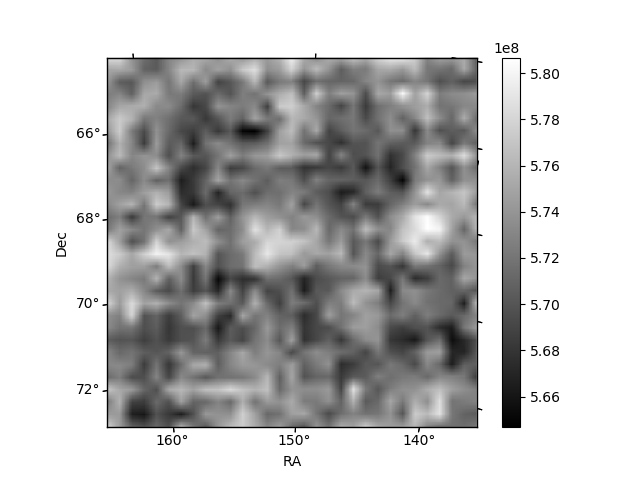
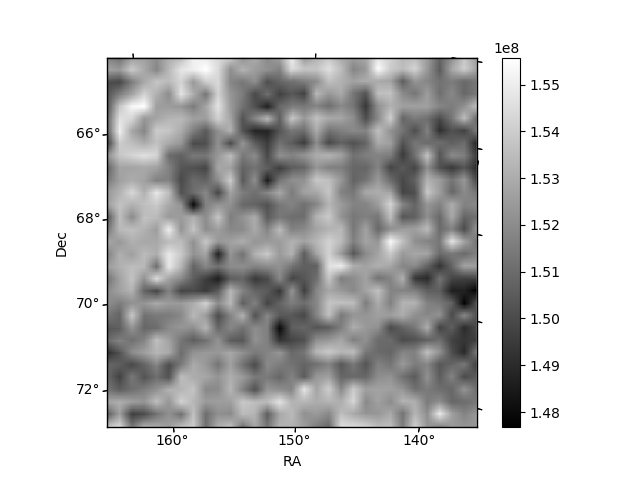
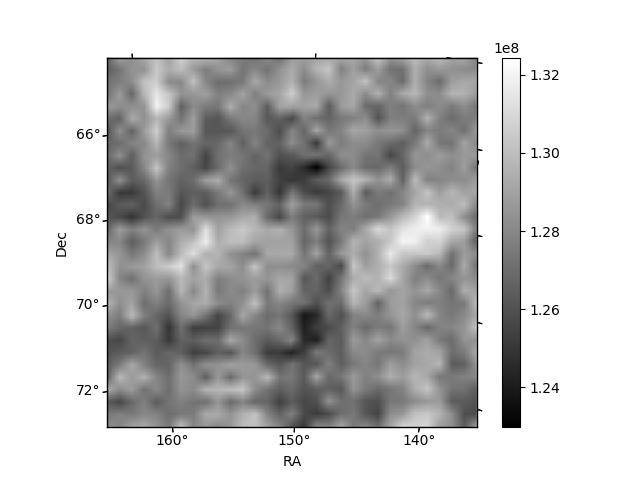
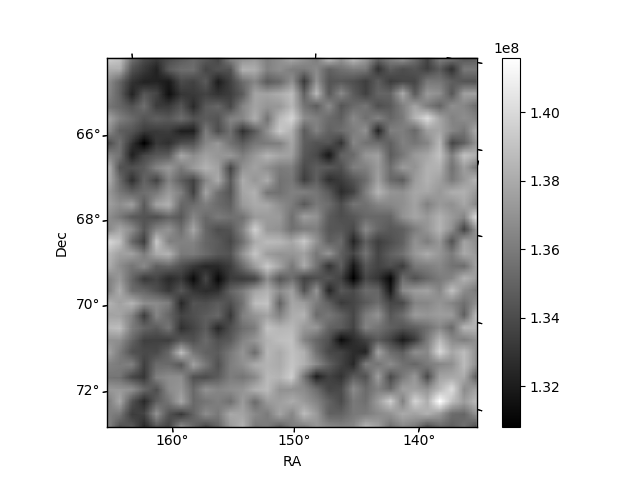
Histogram calculated using DETX and DETY for each event in the final _common_clean file
| Quadrant A | 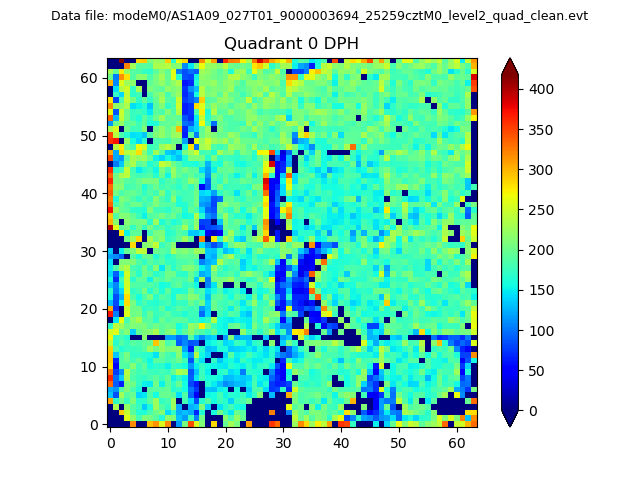 |
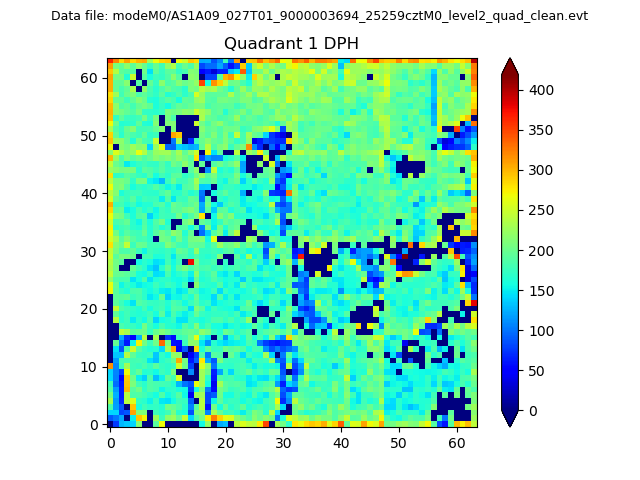 |
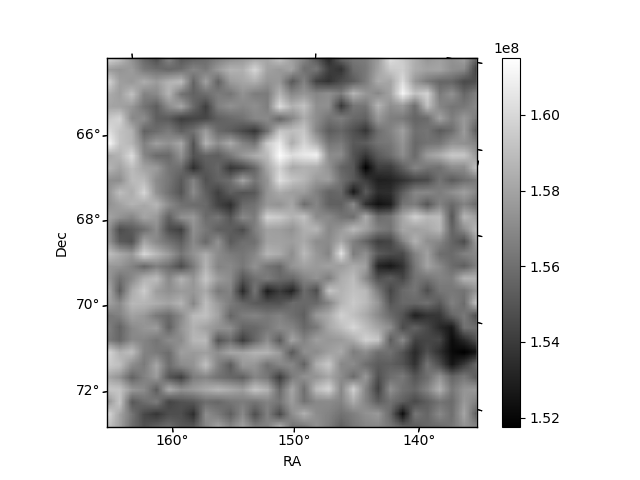
Quadrant B |
|---|---|---|---|
| Quadrant D | 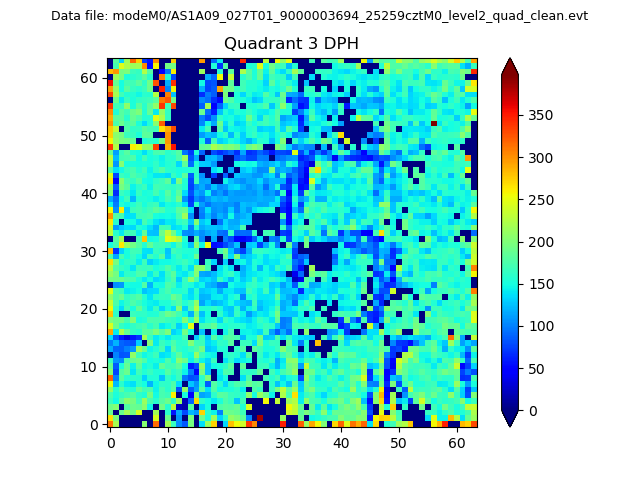 |
 |
Quadrant C |
| Plot type | Count rate plots | Images |
|---|---|---|
| Comparison with Poisson distribution Blue bars denote a histogram of data divided into 1 sec bins. Red curve is a Poisson curve with rate = median count rate of data. |
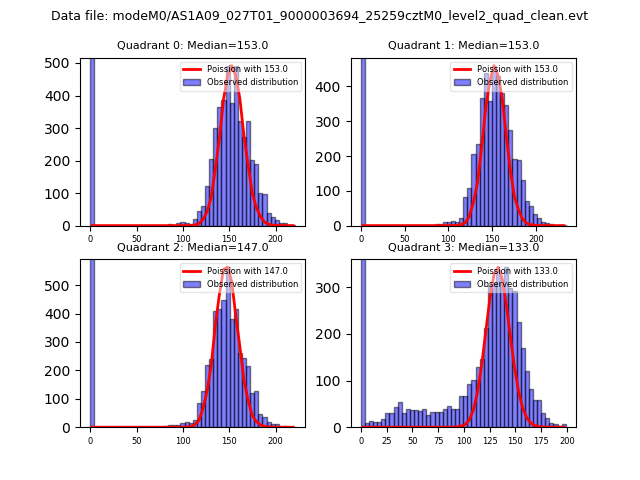 |
 |
| Quadrant-wise count rates Data is divided into 100 sec bins |
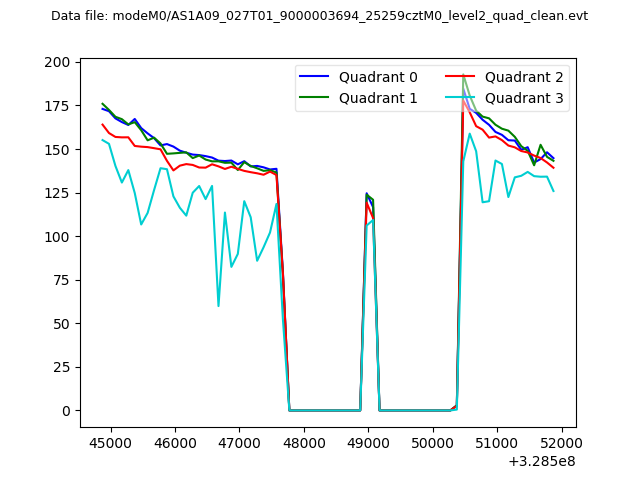 |
|
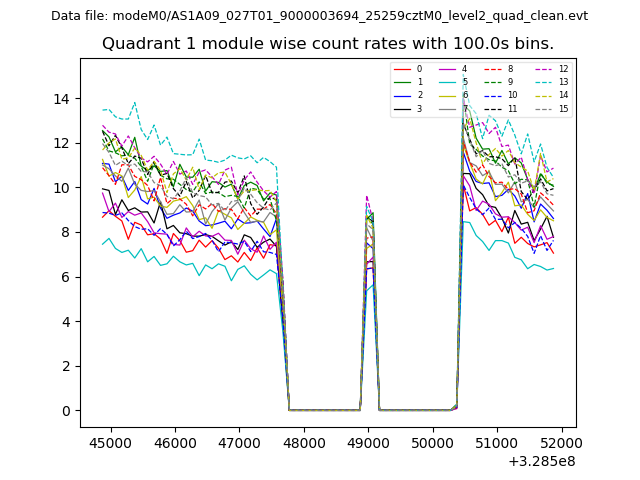
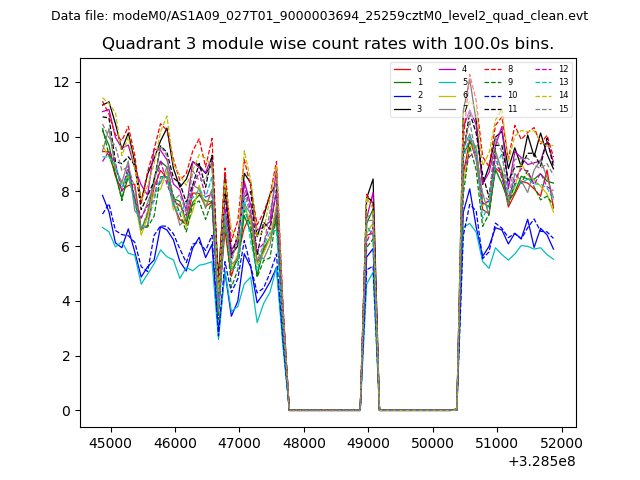
| Module-wise count rates for Quadrant A Data is divided into 100 sec bins |
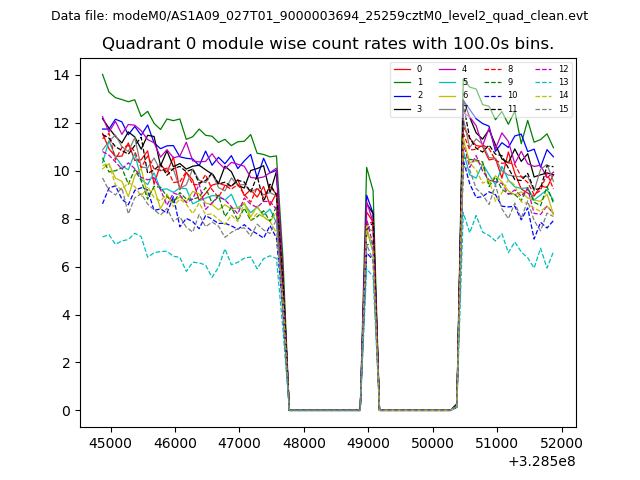 |
 |
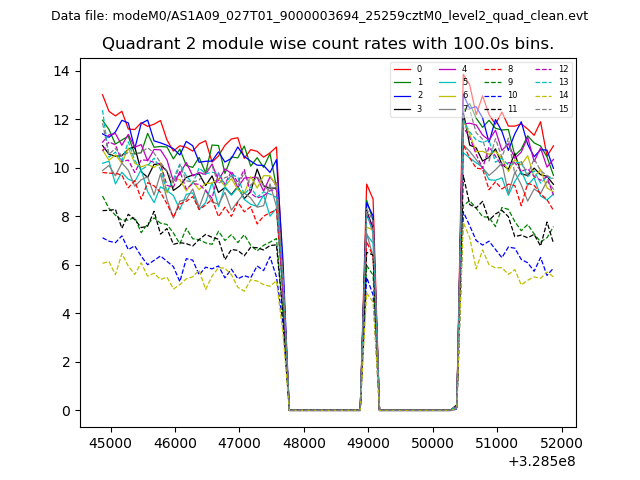
| Module-wise count rates for Quadrant B Data is divided into 100 sec bins |
 |
 |
| Module-wise count rates for Quadrant C Data is divided into 100 sec bins |
 |
 |
| Module-wise count rates for Quadrant D Data is divided into 100 sec bins |
 |
 |
| Parameter | Plot |
|---|---|
| CZT HV Monitor | 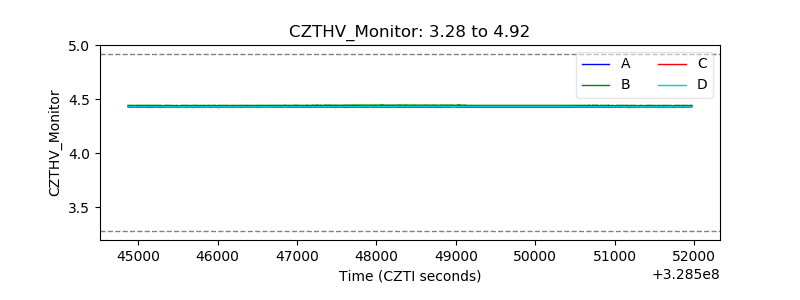 |
| D_VDD | 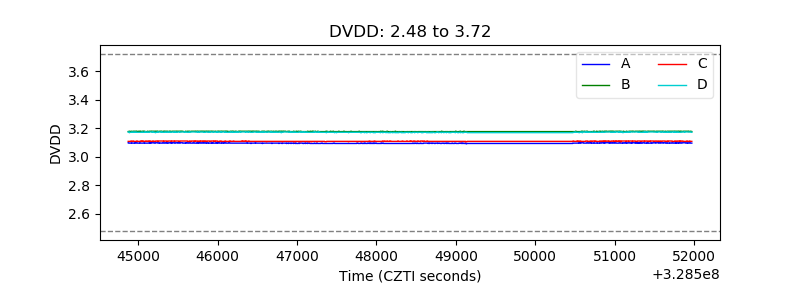 |
| Temperature 1 | 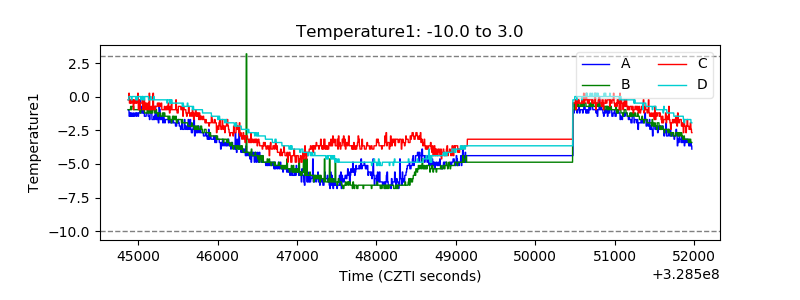 |
| Veto HV Monitor | 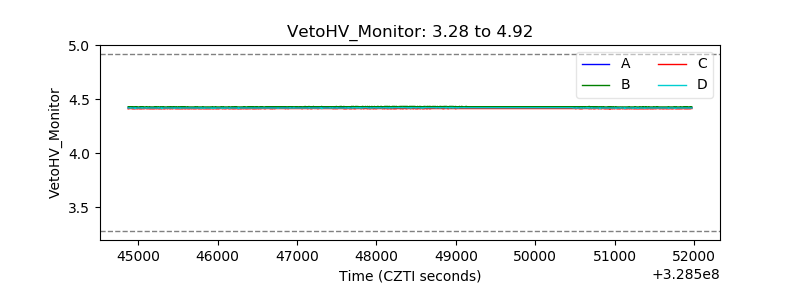 |
| Veto LLD | 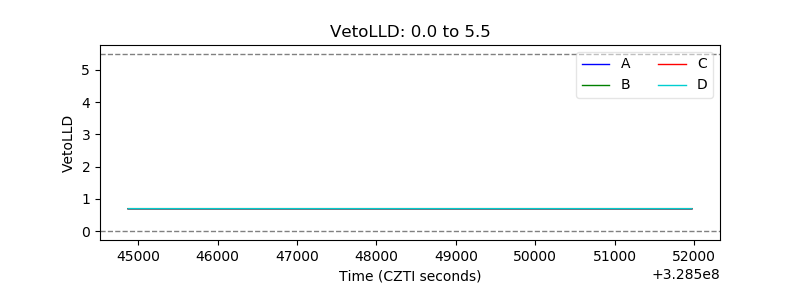 |
| Alpha Counter | 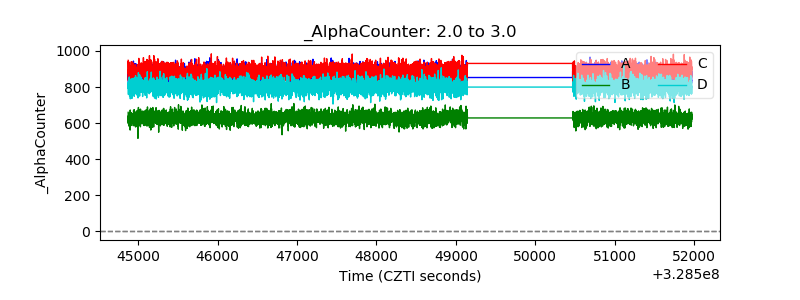 |
| _CPM_Rate | 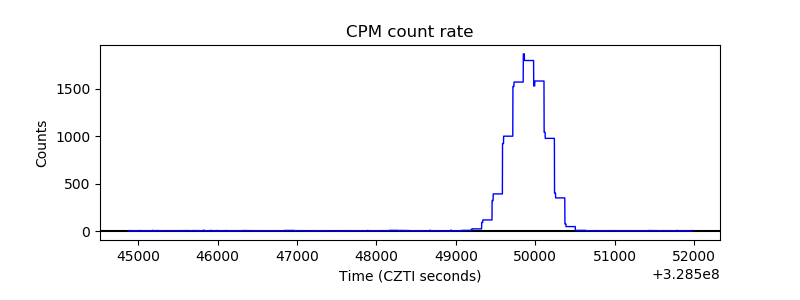 |
| CZT Counter | 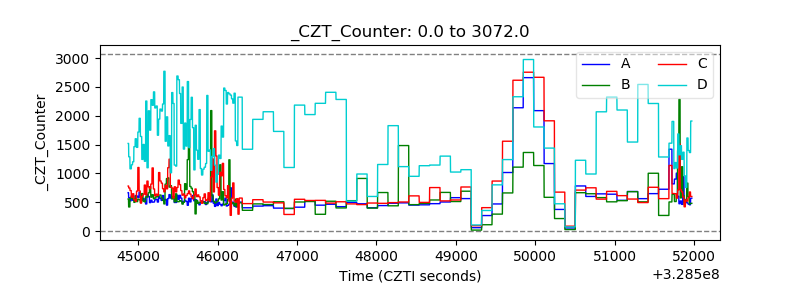 |
| +2.5 Volts monitor |  |
| +5 Volts monitor |  |
| _ROLL_ROT | 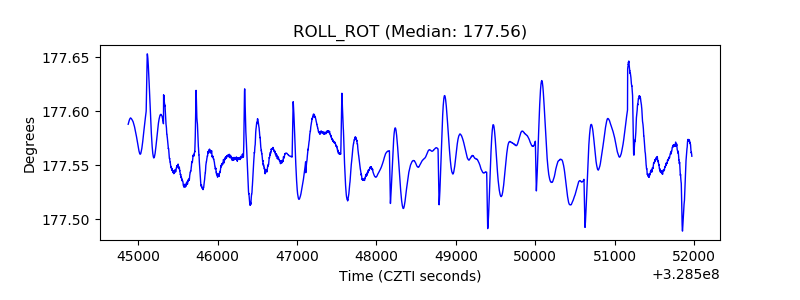 |
| _Roll_DEC | 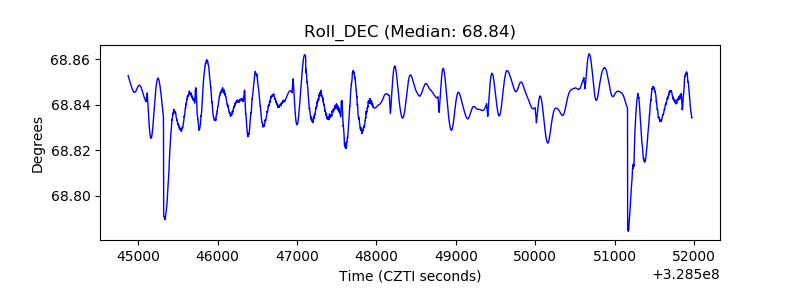 |
| _Roll_RA | 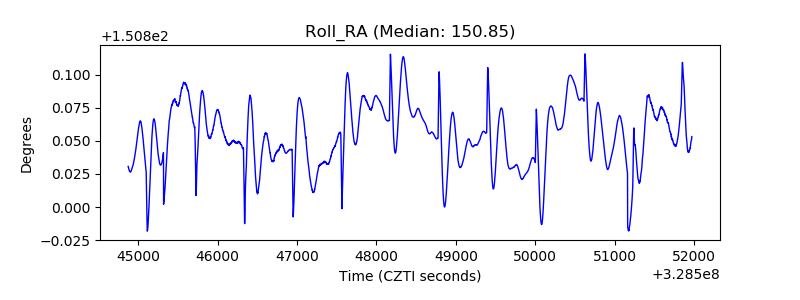 |
| Veto Counter | 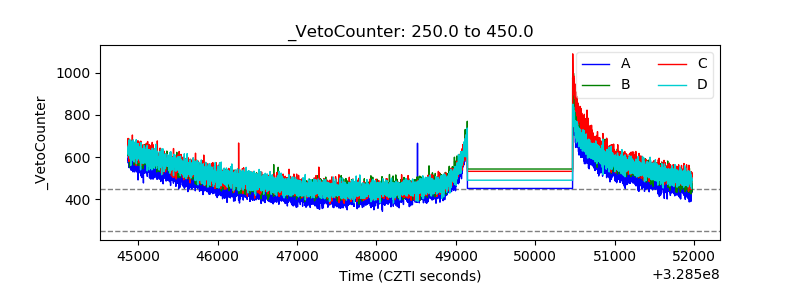 |