| Param | Original file | Final file |
|---|---|---|
| Filename | modeM0/AS1A09_027T01_9000003694_25260cztM0_level2.evt | modeM0/AS1A09_027T01_9000003694_25260cztM0_level2_quad_clean.evt |
| Size (bytes) | 658,036,800 | 103,343,040 |
| Size | 627.6 MB | 98.6 MB |
| Events in quadrant A | 3,412,413 | 713,615 |
| Events in quadrant B | 3,868,174 | 709,912 |
| Events in quadrant C | 5,224,079 | 630,861 |
| Events in quadrant D | 7,005,019 | 641,659 |
| Mode M0 | |||
|---|---|---|---|
| Quadrant | BADHDUFLAG | Total packets | Discarded packets |
| A | 0 | 14131 | 0 |
| B | 0 | 15535 | 0 |
| C | 0 | 19655 | 0 |
| D | 0 | 25236 | 0 |
| Mode M9 | |||
|---|---|---|---|
| Quadrant | BADHDUFLAG | Total packets | Discarded packets |
| A | 0 | 12 | 0 |
| B | 0 | 12 | 0 |
| C | 0 | 12 | 0 |
| D | 0 | 12 | 0 |
| Quadrant | Total seconds | Saturated seconds | Saturation percentage |
|---|---|---|---|
| A | 6205 | 36 | 0.580177% |
| B | 6205 | 231 | 3.722804% |
| C | 6205 | 748 | 12.054795% |
| D | 6204 | 827 | 13.330110% |
Noise dominated data is calculated using 1-second bins in cleaned event files. If a bin has >2000 counts, and if more than 50% of those come from <1% of pixels, then it is considered to be noise-dominated and hence unusable.
| Quadrant | # 1 sec bins | Bins with >0 counts | Bins with >2000 counts | High rate bins dominated by noise | Noise dominated (total time) | Noise dominated (detector-on time) | Marked lightcurve |
|---|---|---|---|---|---|---|---|
| A | 7385 | 6206 | 2 | 2 | 0.03% | 0.03% |  |
| B | 7385 | 6206 | 98 | 98 | 1.33% | 1.58% |  |
| C | 7385 | 6205 | 524 | 524 | 7.10% | 8.44% |  |
| D | 7384 | 6205 | 600 | 600 | 8.13% | 9.67% |  |
Top three noisy pixels from each quadrant. If the there are fewer than three noisy pixels in the level2.evt file, extra rows are filled as -1
| Pixel properties | Quadrant properties | ||||||
|---|---|---|---|---|---|---|---|
| Quadrant | DetID | PixID | Counts | Sigma | Mean | Median | Sigma |
| A | 6 | 16 | 399030 | 2589.59 | 774 | 759 | 153.8 |
| A | 13 | 254 | 10555 | 63.69 | 774 | 759 | 153.8 |
| A | 3 | 1 | 10512 | 63.41 | 774 | 759 | 153.8 |
| B | 3 | 64 | 626056 | 4457.74 | 761 | 743 | 140.3 |
| B | 15 | 33 | 122477 | 867.82 | 761 | 743 | 140.3 |
| B | 0 | 229 | 39529 | 276.5 | 761 | 743 | 140.3 |
| C | 0 | 239 | 2201110 | 13724.47 | 698 | 706 | 160.3 |
| C | 3 | 233 | 157247 | 976.39 | 698 | 706 | 160.3 |
| C | 14 | 238 | 110874 | 687.15 | 698 | 706 | 160.3 |
| D | 8 | 195 | 1345521 | 7530.74 | 740 | 719 | 178.6 |
| D | 9 | 35 | 1097035 | 6139.25 | 740 | 719 | 178.6 |
| D | 1 | 239 | 851001 | 4761.48 | 740 | 719 | 178.6 |
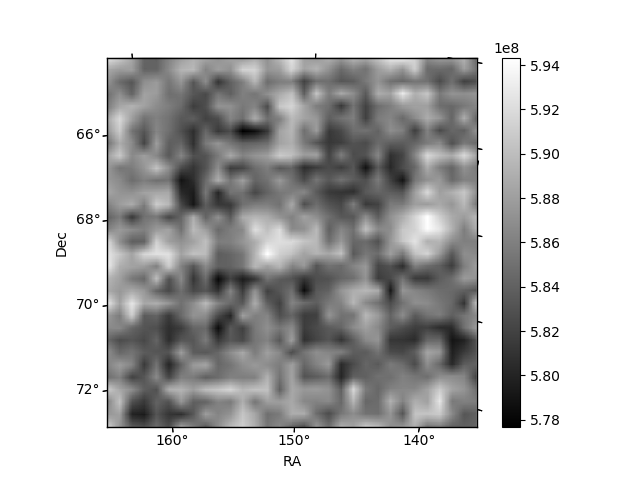
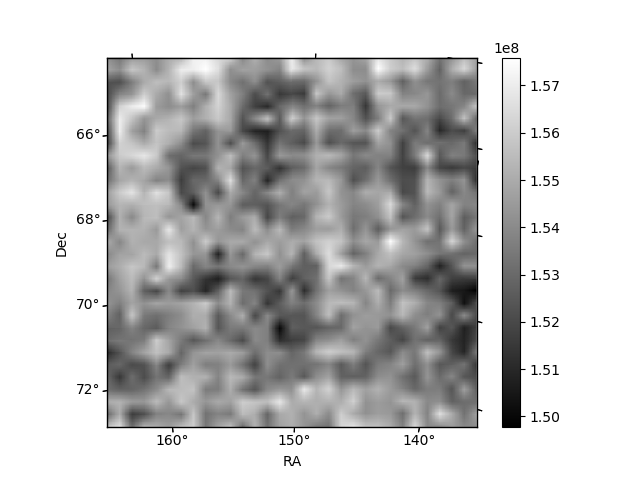
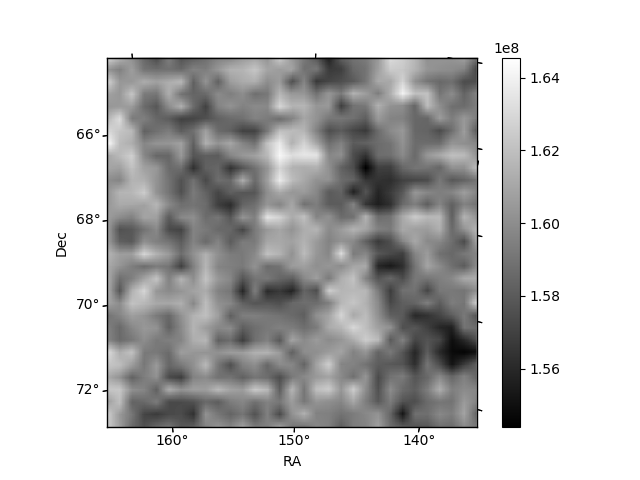
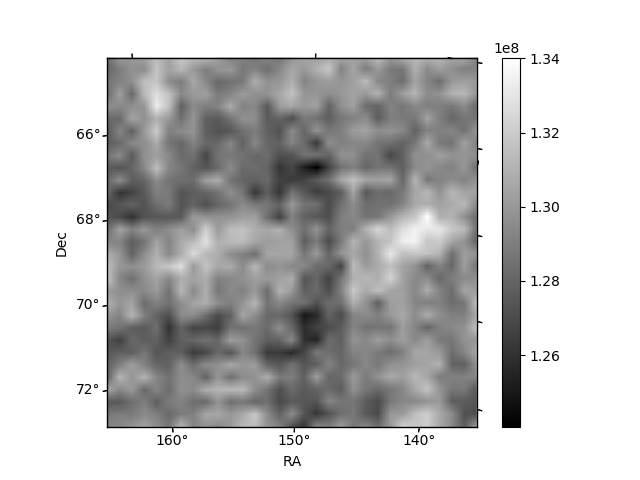
Histogram calculated using DETX and DETY for each event in the final _common_clean file
| Quadrant A | 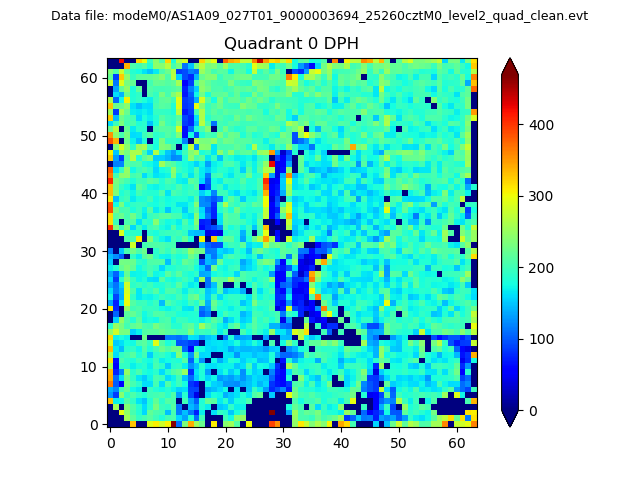 |
 |
Quadrant B |
|---|---|---|---|
| Quadrant D | 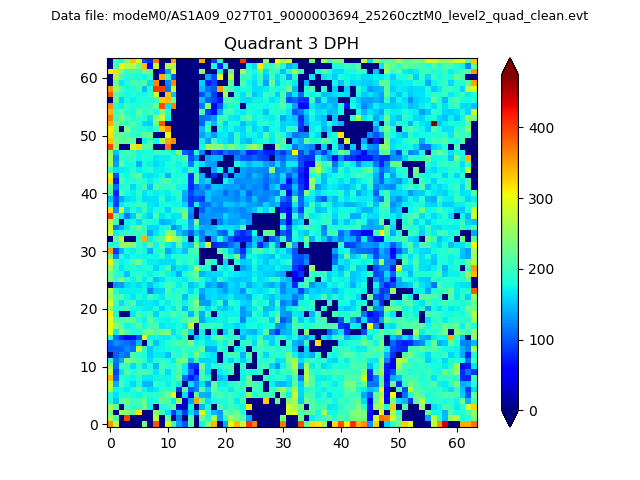 |
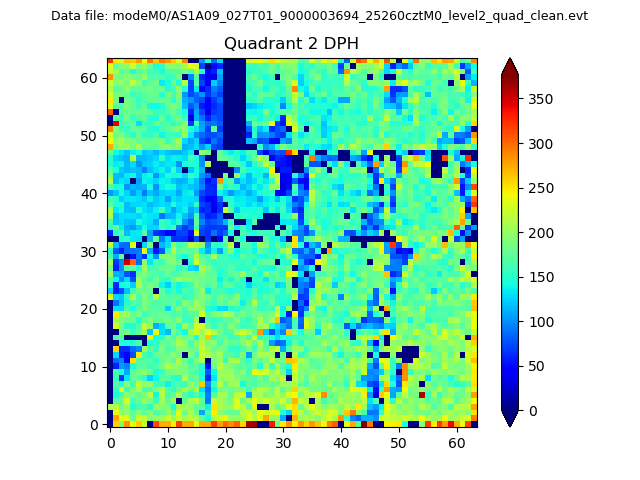 |
Quadrant C |
| Plot type | Count rate plots | Images |
|---|---|---|
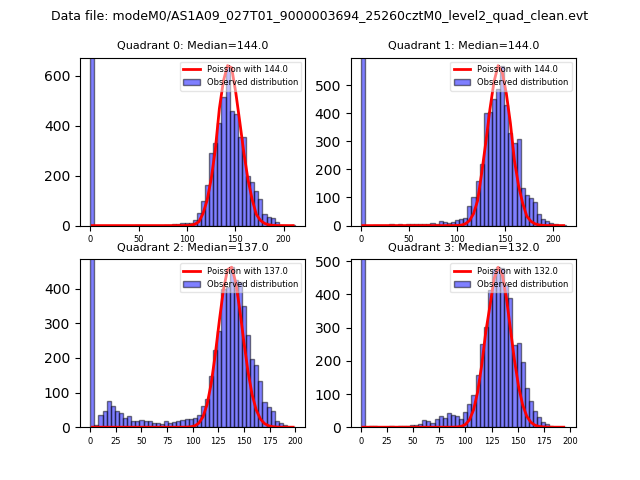
| Comparison with Poisson distribution Blue bars denote a histogram of data divided into 1 sec bins. Red curve is a Poisson curve with rate = median count rate of data. |
 |
 |
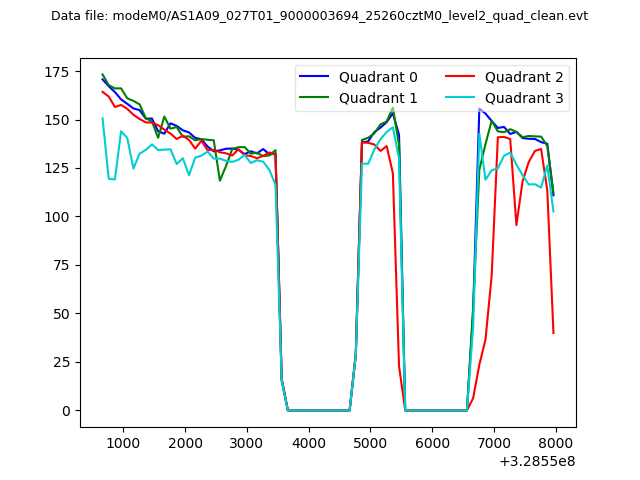
| Quadrant-wise count rates Data is divided into 100 sec bins |
 |
|
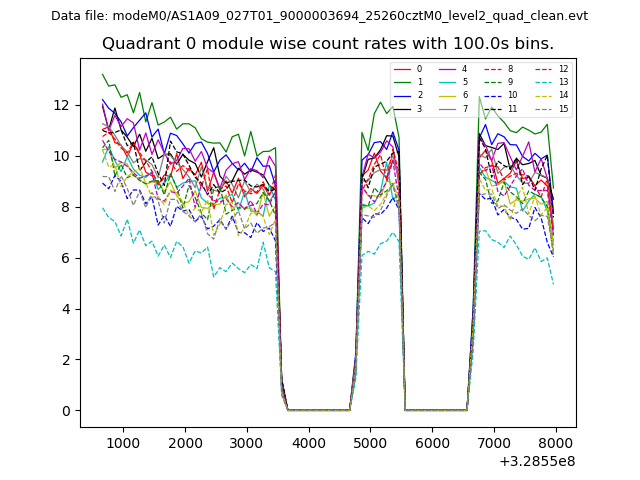
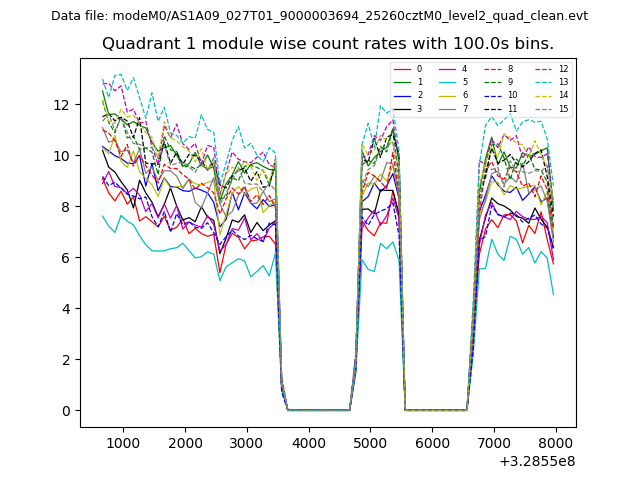
| Module-wise count rates for Quadrant A Data is divided into 100 sec bins |
 |
 |
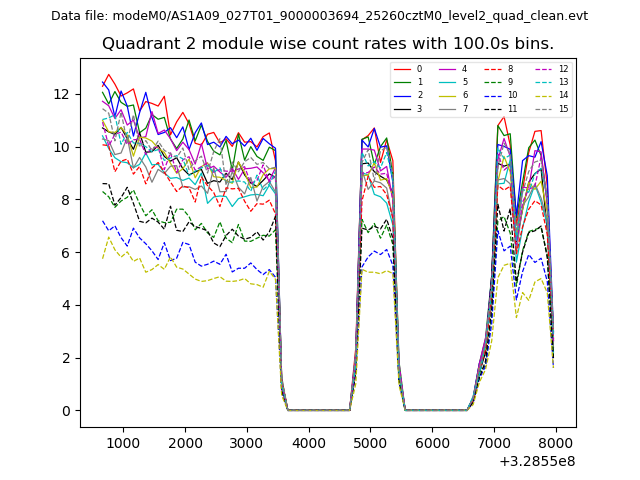
| Module-wise count rates for Quadrant B Data is divided into 100 sec bins |
 |
 |
| Module-wise count rates for Quadrant C Data is divided into 100 sec bins |
 |
 |
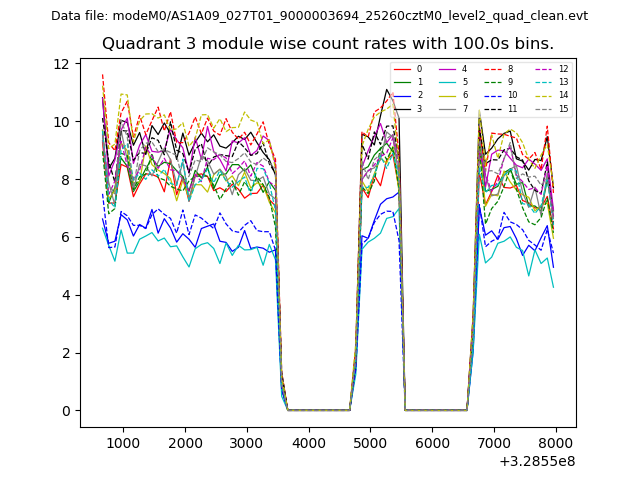
| Module-wise count rates for Quadrant D Data is divided into 100 sec bins |
 |
 |
| Parameter | Plot |
|---|---|
| CZT HV Monitor | 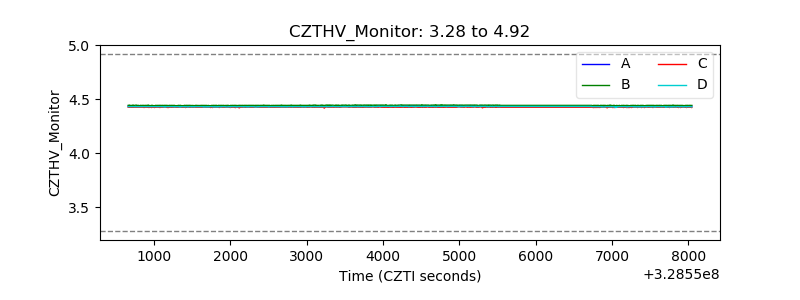 |
| D_VDD | 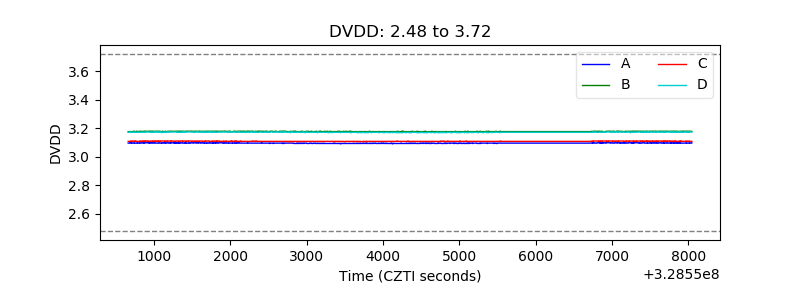 |
| Temperature 1 | 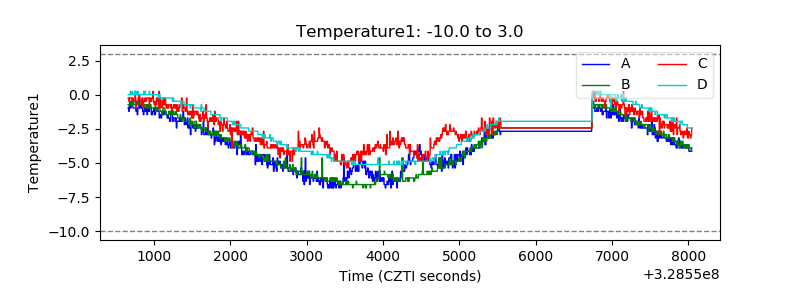 |
| Veto HV Monitor | 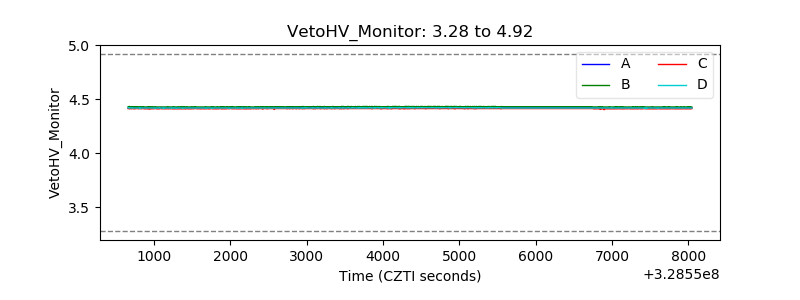 |
| Veto LLD | 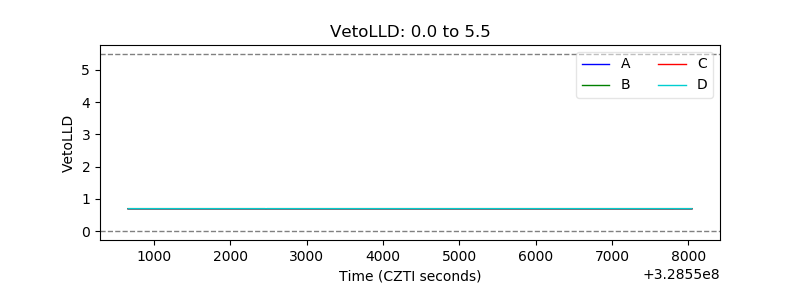 |
| Alpha Counter | 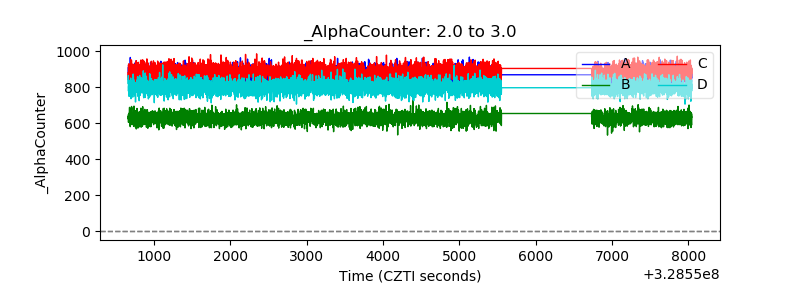 |
| _CPM_Rate |  |
| CZT Counter | 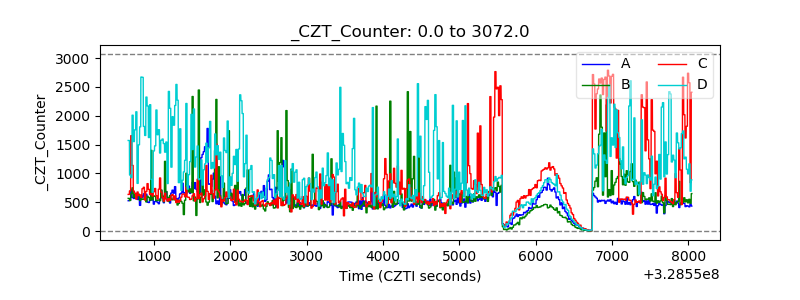 |
| +2.5 Volts monitor |  |
| +5 Volts monitor |  |
| _ROLL_ROT | 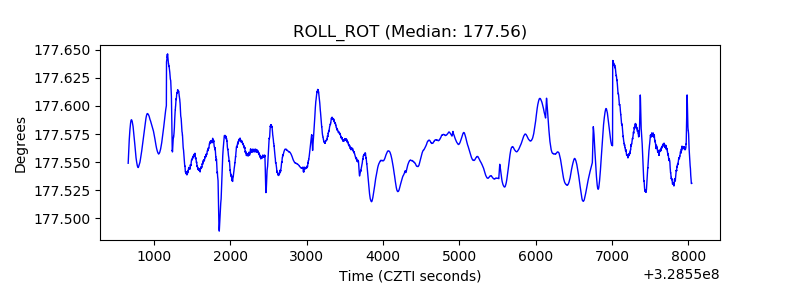 |
| _Roll_DEC | 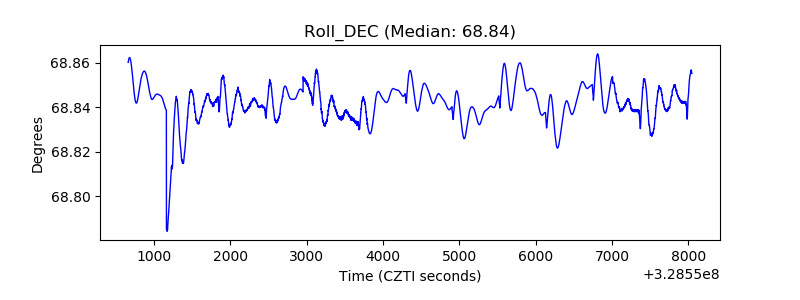 |
| _Roll_RA | 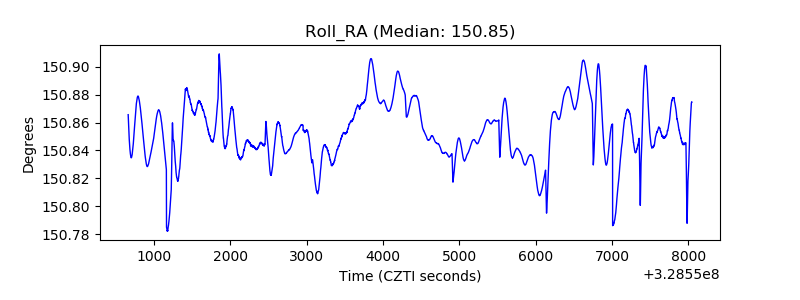 |
| Veto Counter | 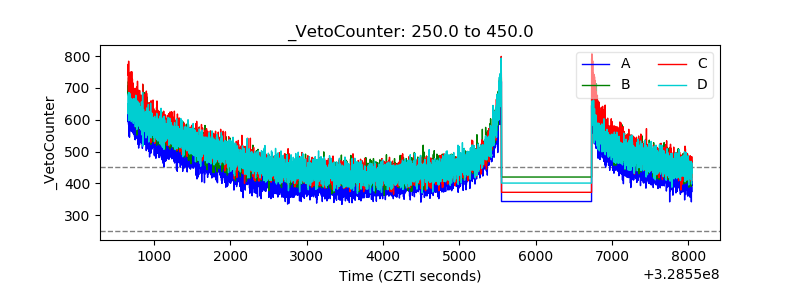 |