| Param | Original file | Final file |
|---|---|---|
| Filename | modeM0/AS1A09_027T01_9000003694_25261cztM0_level2.evt | modeM0/AS1A09_027T01_9000003694_25261cztM0_level2_quad_clean.evt |
| Size (bytes) | 826,505,280 | 107,239,680 |
| Size | 788.2 MB | 102.3 MB |
| Events in quadrant A | 3,165,472 | 751,446 |
| Events in quadrant B | 3,800,923 | 746,748 |
| Events in quadrant C | 8,743,396 | 615,699 |
| Events in quadrant D | 8,864,016 | 660,489 |
| Mode M0 | |||
|---|---|---|---|
| Quadrant | BADHDUFLAG | Total packets | Discarded packets |
| A | 0 | 13917 | 0 |
| B | 0 | 15832 | 0 |
| C | 0 | 30496 | 0 |
| D | 0 | 31169 | 0 |
| Mode M9 | |||
|---|---|---|---|
| Quadrant | BADHDUFLAG | Total packets | Discarded packets |
| A | 0 | 9 | 0 |
| B | 0 | 10 | 0 |
| C | 0 | 10 | 0 |
| D | 0 | 10 | 0 |
| Quadrant | Total seconds | Saturated seconds | Saturation percentage |
|---|---|---|---|
| A | 6774 | 32 | 0.472394% |
| B | 6773 | 137 | 2.022737% |
| C | 6773 | 2281 | 33.677838% |
| D | 6773 | 1255 | 18.529455% |
Noise dominated data is calculated using 1-second bins in cleaned event files. If a bin has >2000 counts, and if more than 50% of those come from <1% of pixels, then it is considered to be noise-dominated and hence unusable.
| Quadrant | # 1 sec bins | Bins with >0 counts | Bins with >2000 counts | High rate bins dominated by noise | Noise dominated (total time) | Noise dominated (detector-on time) | Marked lightcurve |
|---|---|---|---|---|---|---|---|
| A | 7639 | 6775 | 1 | 1 | 0.01% | 0.01% | 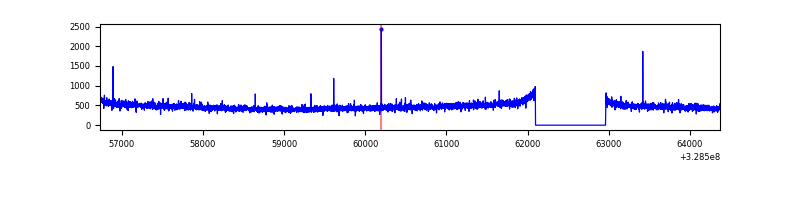 |
| B | 7638 | 6774 | 51 | 51 | 0.67% | 0.75% | 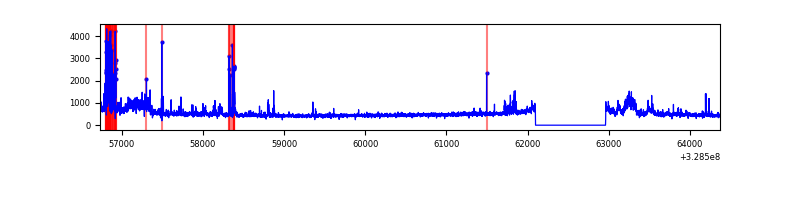 |
| C | 7638 | 6774 | 1713 | 1713 | 22.43% | 25.29% | 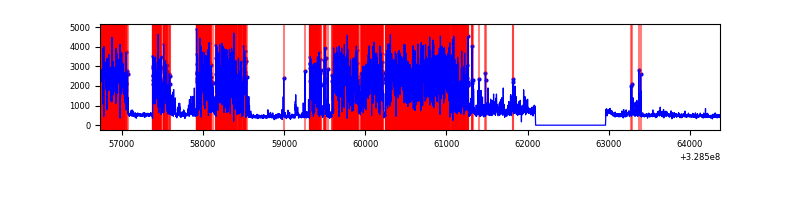 |
| D | 7638 | 6774 | 944 | 944 | 12.36% | 13.94% | 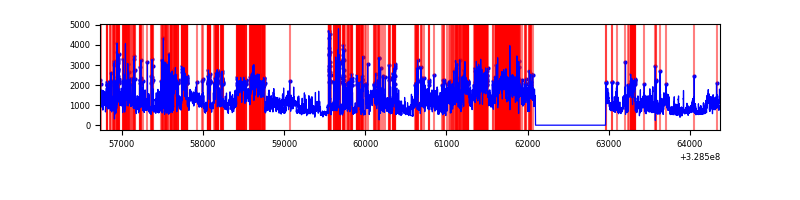 |
Top three noisy pixels from each quadrant. If the there are fewer than three noisy pixels in the level2.evt file, extra rows are filled as -1
| Pixel properties | Quadrant properties | ||||||
|---|---|---|---|---|---|---|---|
| Quadrant | DetID | PixID | Counts | Sigma | Mean | Median | Sigma |
| A | 3 | 1 | 14237 | 82.15 | 815 | 798 | 163.6 |
| A | 13 | 254 | 11108 | 63.03 | 815 | 798 | 163.6 |
| A | 0 | 226 | 7056 | 38.26 | 815 | 798 | 163.6 |
| B | 3 | 64 | 265494 | 1764.73 | 809 | 790 | 150.0 |
| B | 15 | 33 | 210530 | 1398.3 | 809 | 790 | 150.0 |
| B | 0 | 219 | 63731 | 419.62 | 809 | 790 | 150.0 |
| C | 0 | 239 | 5880469 | 38183.05 | 664 | 667 | 154.0 |
| C | 14 | 238 | 103310 | 666.56 | 664 | 667 | 154.0 |
| C | 3 | 233 | 100541 | 648.58 | 664 | 667 | 154.0 |
| D | 9 | 35 | 3141936 | 16954.44 | 763 | 740 | 185.3 |
| D | 1 | 52 | 1948716 | 10514.1 | 763 | 740 | 185.3 |
| D | 8 | 195 | 441346 | 2378.15 | 763 | 740 | 185.3 |
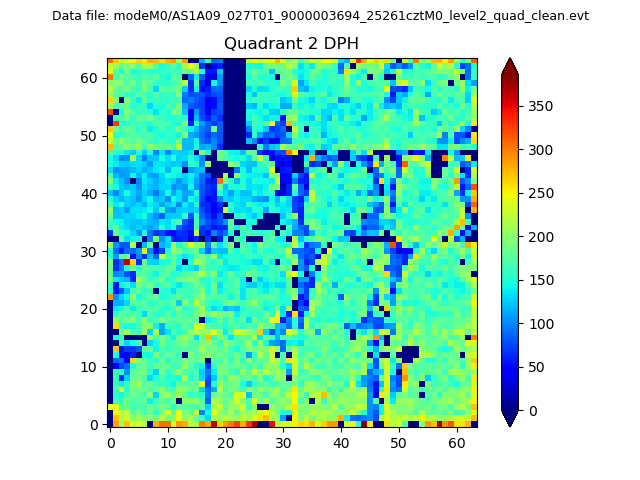
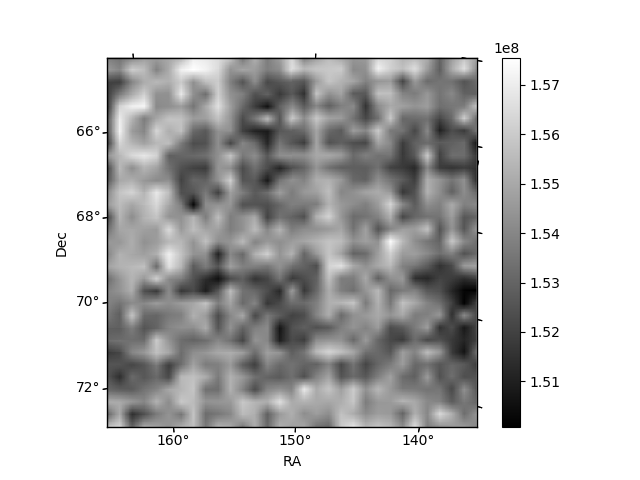
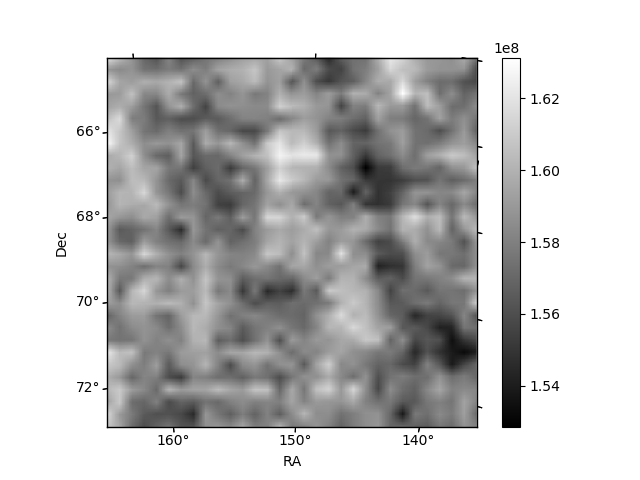
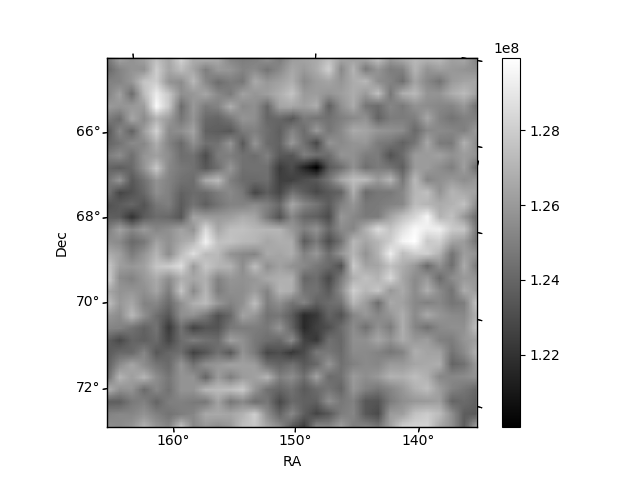
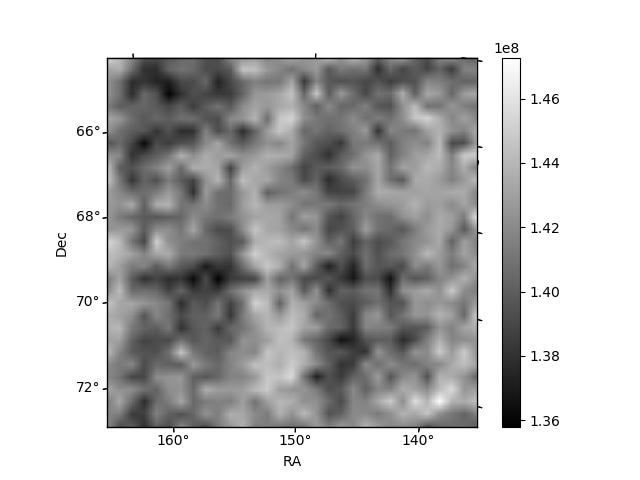
Histogram calculated using DETX and DETY for each event in the final _common_clean file
| Quadrant A | 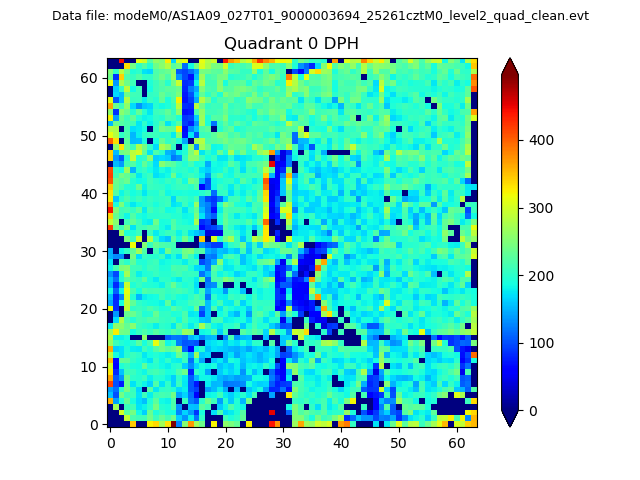 |
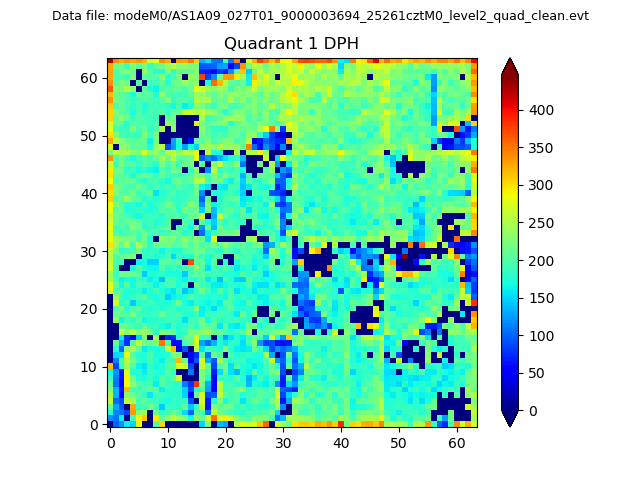 |
Quadrant B |
|---|---|---|---|
| Quadrant D | 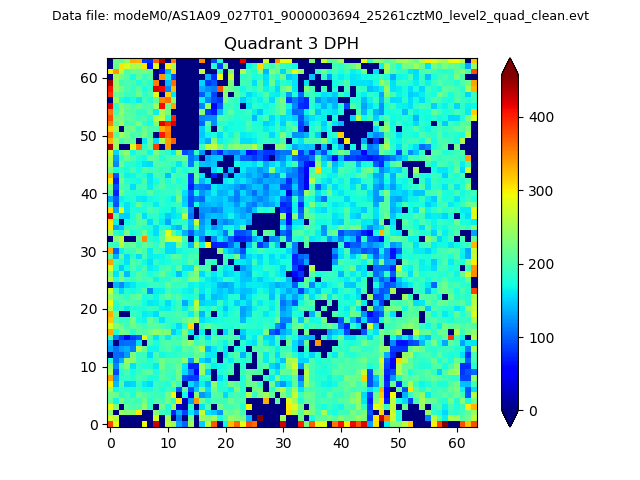 |
 |
Quadrant C |
| Plot type | Count rate plots | Images |
|---|---|---|
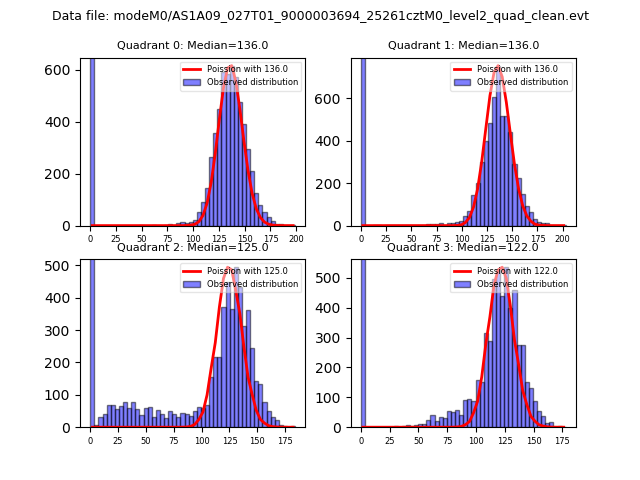
| Comparison with Poisson distribution Blue bars denote a histogram of data divided into 1 sec bins. Red curve is a Poisson curve with rate = median count rate of data. |
 |
 |
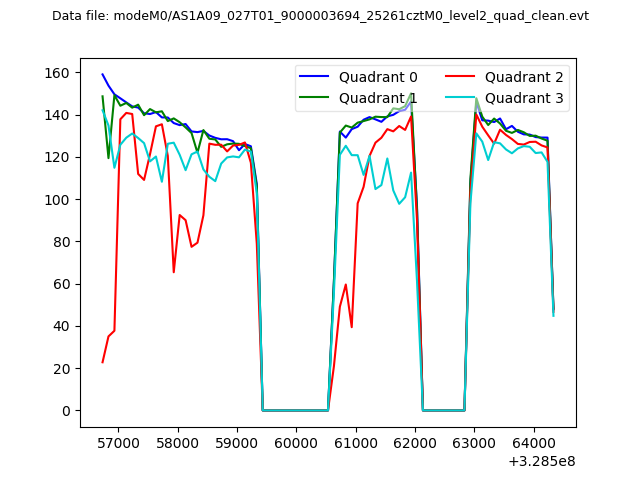
| Quadrant-wise count rates Data is divided into 100 sec bins |
 |
|
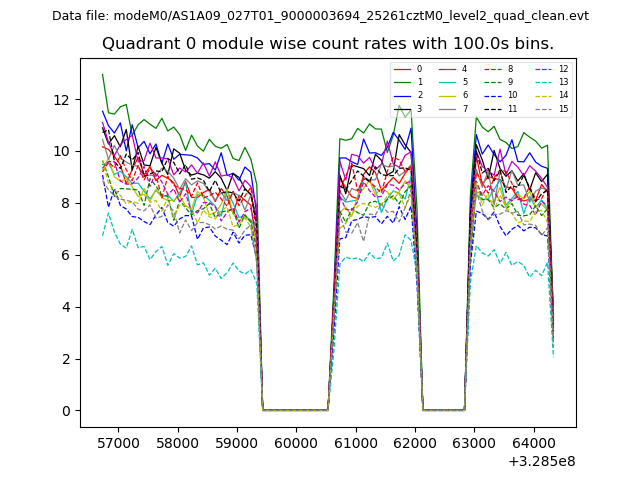
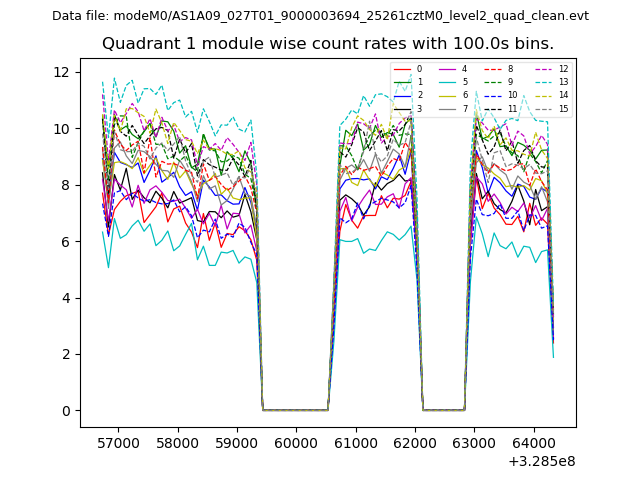
| Module-wise count rates for Quadrant A Data is divided into 100 sec bins |
 |
 |
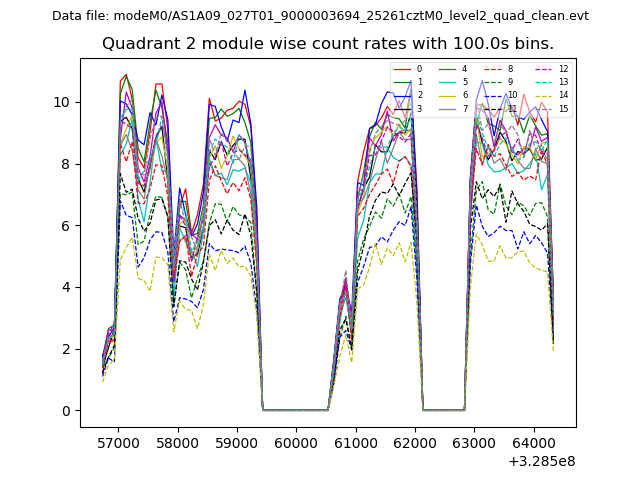
| Module-wise count rates for Quadrant B Data is divided into 100 sec bins |
 |
 |
| Module-wise count rates for Quadrant C Data is divided into 100 sec bins |
 |
 |
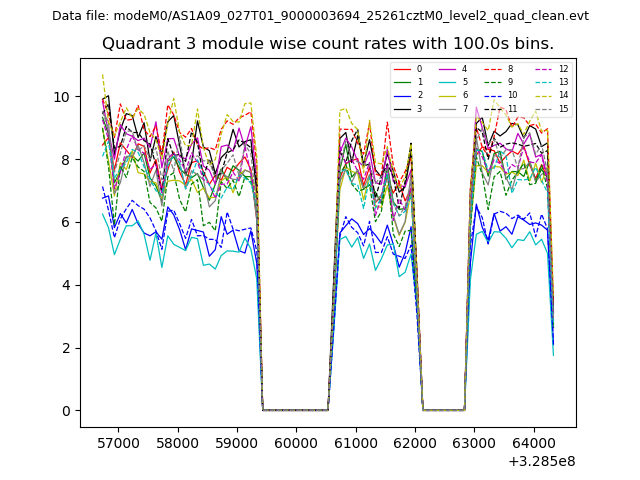
| Module-wise count rates for Quadrant D Data is divided into 100 sec bins |
 |
 |
| Parameter | Plot |
|---|---|
| CZT HV Monitor |  |
| D_VDD | 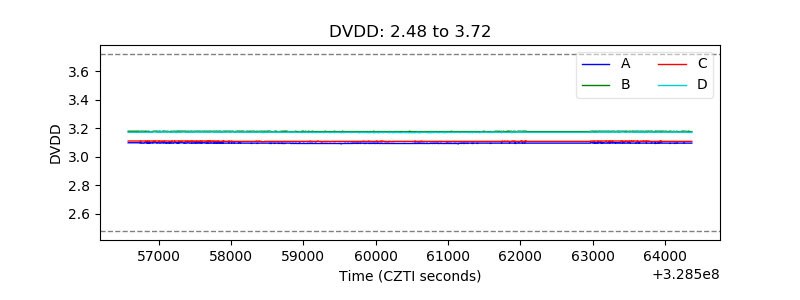 |
| Temperature 1 | 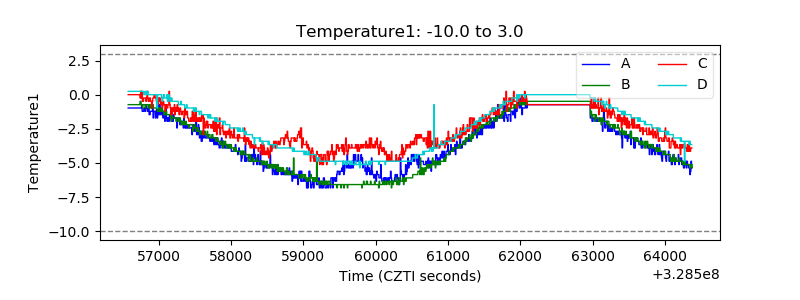 |
| Veto HV Monitor | 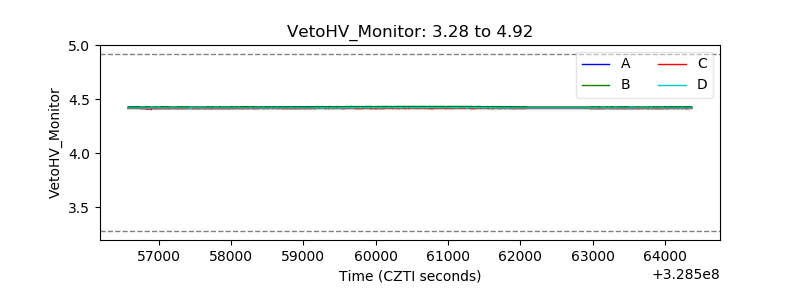 |
| Veto LLD | 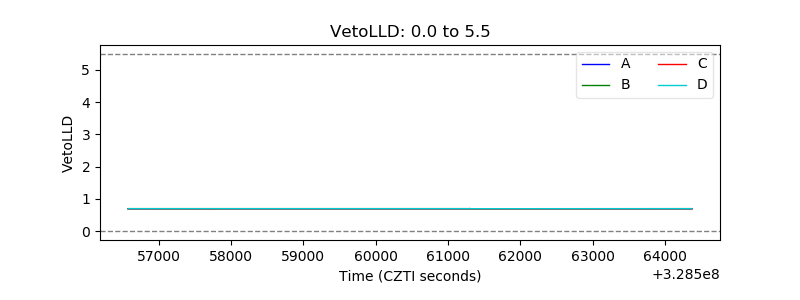 |
| Alpha Counter | 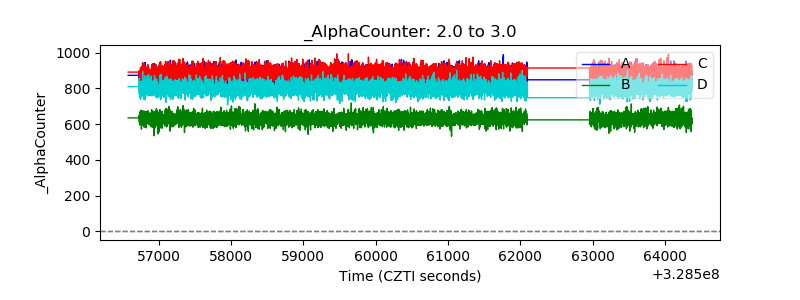 |
| _CPM_Rate | 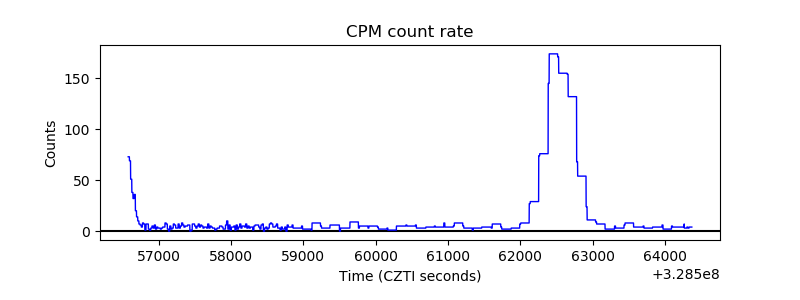 |
| CZT Counter | 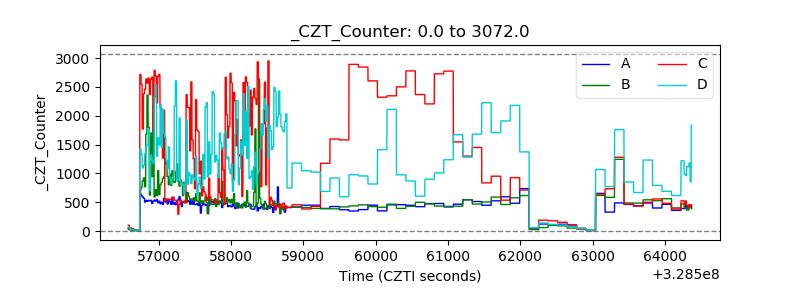 |
| +2.5 Volts monitor |  |
| +5 Volts monitor |  |
| _ROLL_ROT | 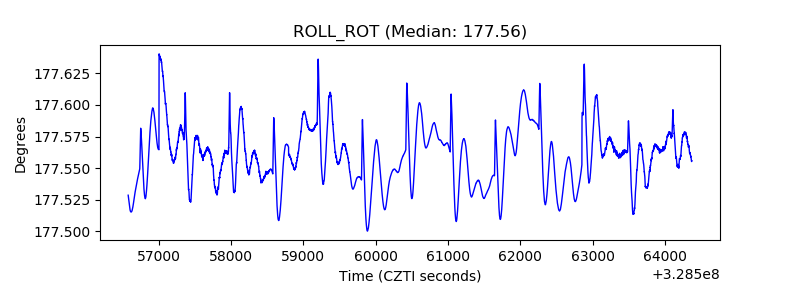 |
| _Roll_DEC | 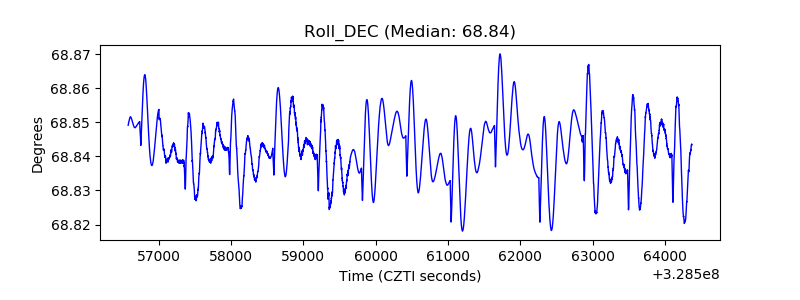 |
| _Roll_RA | 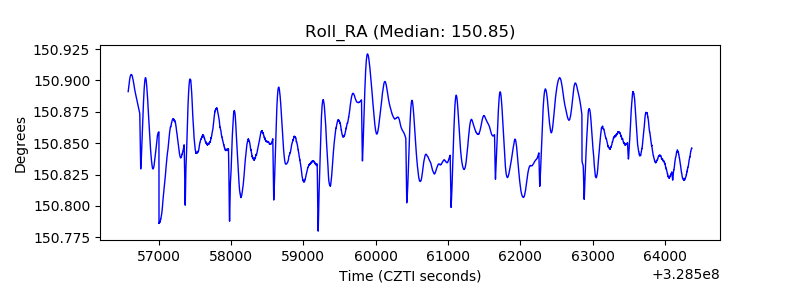 |
| Veto Counter | 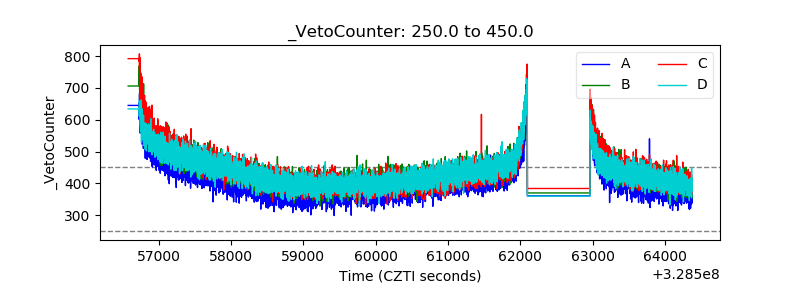 |