| Param | Original file | Final file |
|---|---|---|
| Filename | modeM0/AS1A09_027T01_9000003694_25262cztM0_level2.evt | modeM0/AS1A09_027T01_9000003694_25262cztM0_level2_quad_clean.evt |
| Size (bytes) | 161,547,840 | 35,740,800 |
| Size | 154.1 MB | 34.1 MB |
| Events in quadrant A | 835,818 | 243,046 |
| Events in quadrant B | 996,405 | 244,262 |
| Events in quadrant C | 973,917 | 235,379 |
| Events in quadrant D | 1,958,884 | 224,658 |
| Mode M0 | |||
|---|---|---|---|
| Quadrant | BADHDUFLAG | Total packets | Discarded packets |
| A | 0 | 3733 | 0 |
| B | 0 | 4228 | 0 |
| C | 0 | 4042 | 0 |
| D | 0 | 7169 | 0 |
| Mode M9 | |||
|---|---|---|---|
| Quadrant | BADHDUFLAG | Total packets | Discarded packets |
| A | 0 | 4 | 0 |
| B | 0 | 5 | 0 |
| C | 0 | 5 | 0 |
| D | 0 | 5 | 0 |
| Quadrant | Total seconds | Saturated seconds | Saturation percentage |
|---|---|---|---|
| A | 1838 | 6 | 0.326442% |
| B | 1838 | 5 | 0.272035% |
| C | 1838 | 27 | 1.468988% |
| D | 1838 | 81 | 4.406964% |
Noise dominated data is calculated using 1-second bins in cleaned event files. If a bin has >2000 counts, and if more than 50% of those come from <1% of pixels, then it is considered to be noise-dominated and hence unusable.
| Quadrant | # 1 sec bins | Bins with >0 counts | Bins with >2000 counts | High rate bins dominated by noise | Noise dominated (total time) | Noise dominated (detector-on time) | Marked lightcurve |
|---|---|---|---|---|---|---|---|
| A | 1838 | 1838 | 0 | 0 | 0.00% | 0.00% | 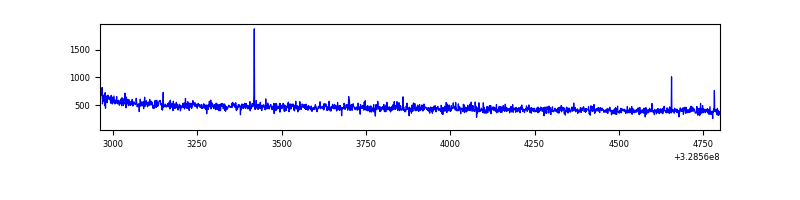 |
| B | 1838 | 1838 | 0 | 0 | 0.00% | 0.00% | 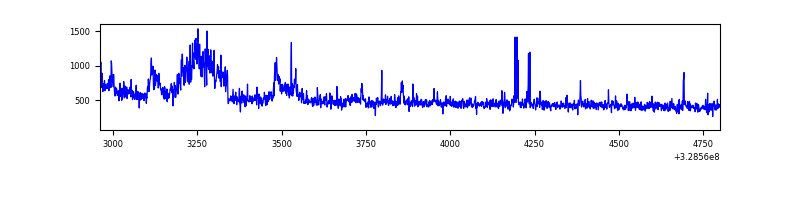 |
| C | 1838 | 1838 | 4 | 4 | 0.22% | 0.22% | 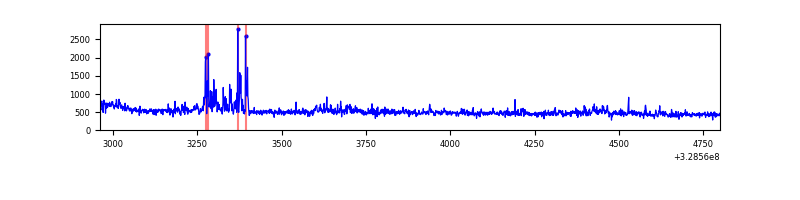 |
| D | 1838 | 1838 | 43 | 43 | 2.34% | 2.34% | 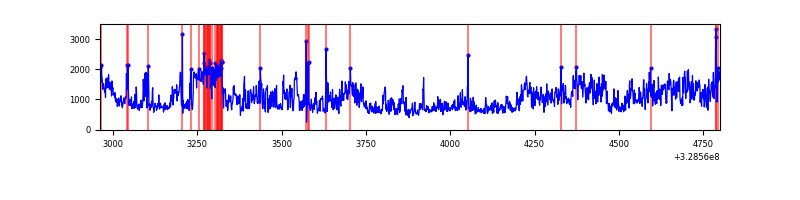 |
Top three noisy pixels from each quadrant. If the there are fewer than three noisy pixels in the level2.evt file, extra rows are filled as -1
| Pixel properties | Quadrant properties | ||||||
|---|---|---|---|---|---|---|---|
| Quadrant | DetID | PixID | Counts | Sigma | Mean | Median | Sigma |
| A | 13 | 254 | 3306 | 69.01 | 215 | 210 | 44.9 |
| A | 8 | 255 | 1955 | 38.89 | 215 | 210 | 44.9 |
| A | 0 | 226 | 1934 | 38.43 | 215 | 210 | 44.9 |
| B | 15 | 33 | 95948 | 2265.79 | 216 | 211 | 42.3 |
| B | 0 | 190 | 17774 | 415.66 | 216 | 211 | 42.3 |
| B | 3 | 64 | 14832 | 346.03 | 216 | 211 | 42.3 |
| C | 2 | 16 | 49466 | 954.03 | 214 | 215 | 51.6 |
| C | 3 | 233 | 41116 | 792.29 | 214 | 215 | 51.6 |
| C | 14 | 238 | 33121 | 637.42 | 214 | 215 | 51.6 |
| D | 9 | 35 | 434715 | 8129.37 | 213 | 207 | 53.4 |
| D | 1 | 52 | 288965 | 5402.48 | 213 | 207 | 53.4 |
| D | 8 | 195 | 277936 | 5196.13 | 213 | 207 | 53.4 |
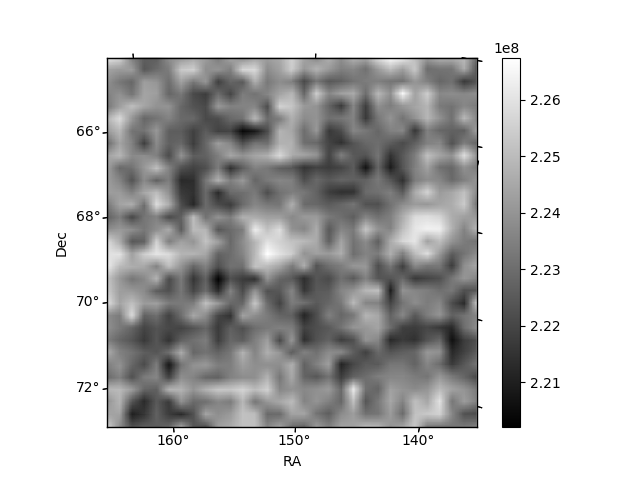
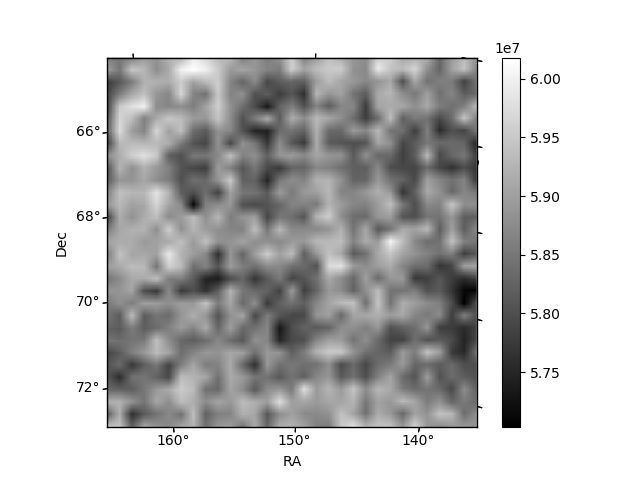
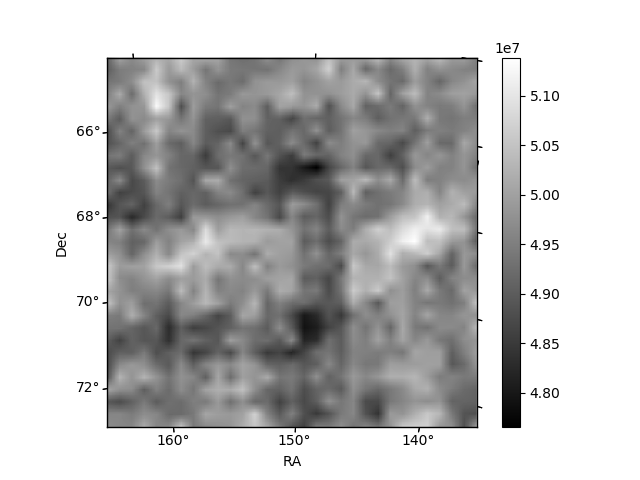
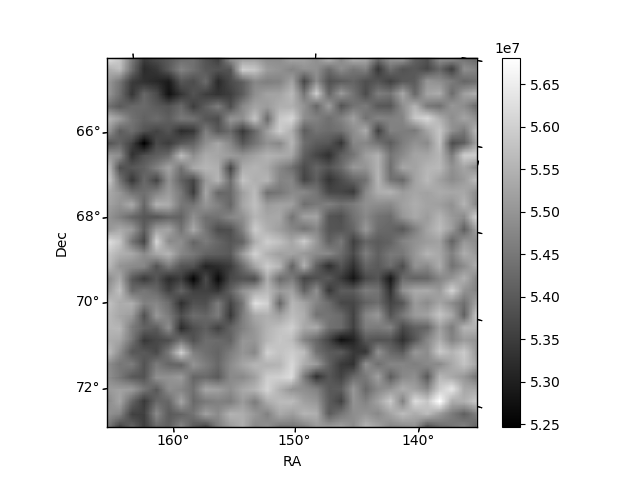
Histogram calculated using DETX and DETY for each event in the final _common_clean file
| Quadrant A | 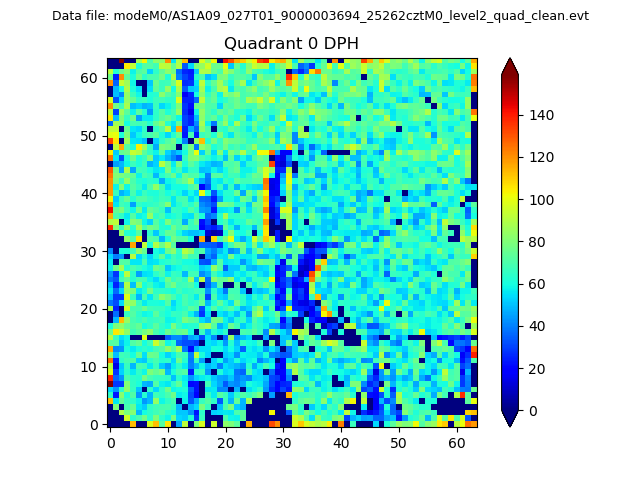 |
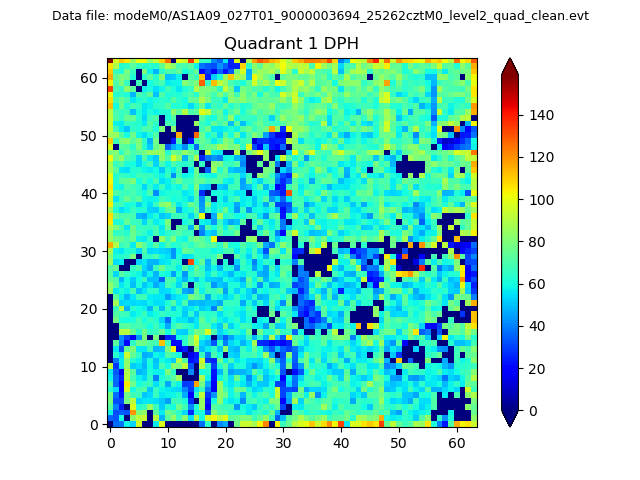 |
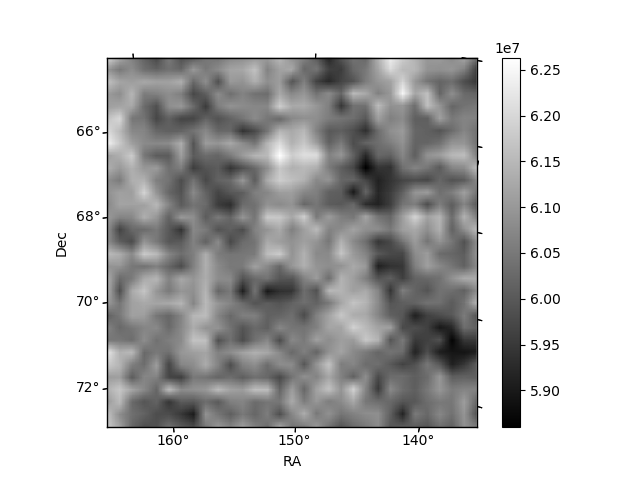
Quadrant B |
|---|---|---|---|
| Quadrant D | 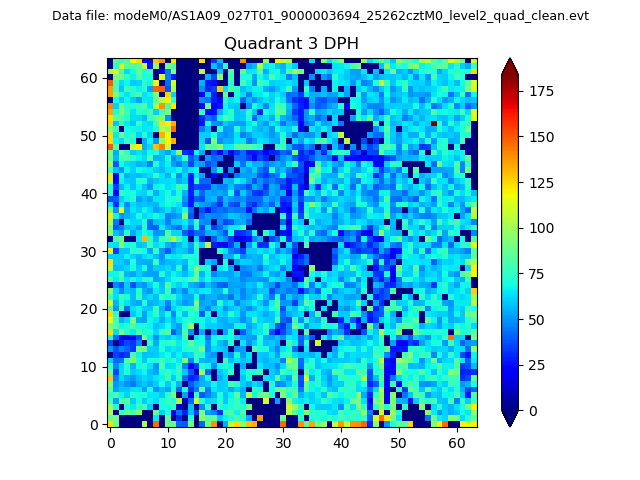 |
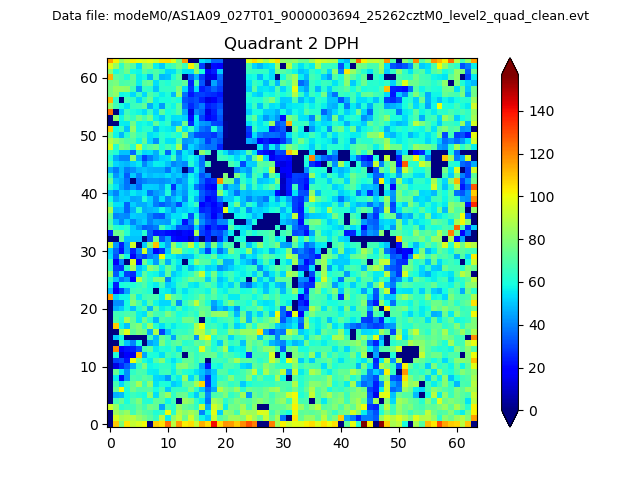 |
Quadrant C |
| Plot type | Count rate plots | Images |
|---|---|---|
| Comparison with Poisson distribution Blue bars denote a histogram of data divided into 1 sec bins. Red curve is a Poisson curve with rate = median count rate of data. |
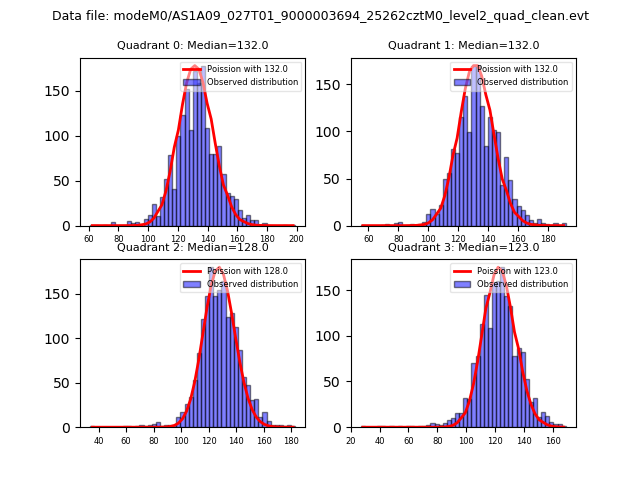 |
 |
| Quadrant-wise count rates Data is divided into 100 sec bins |
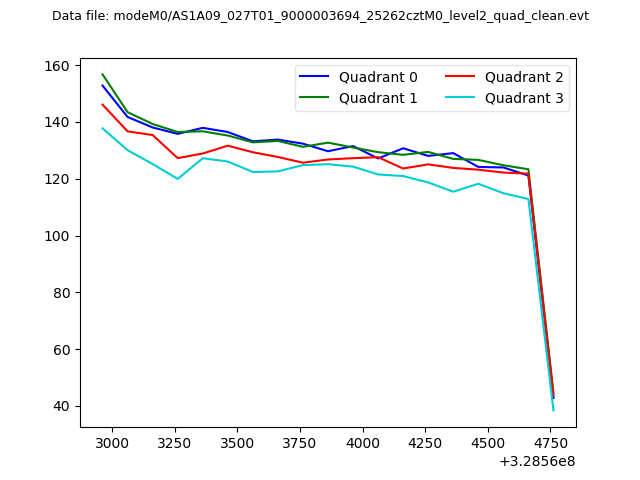 |
|
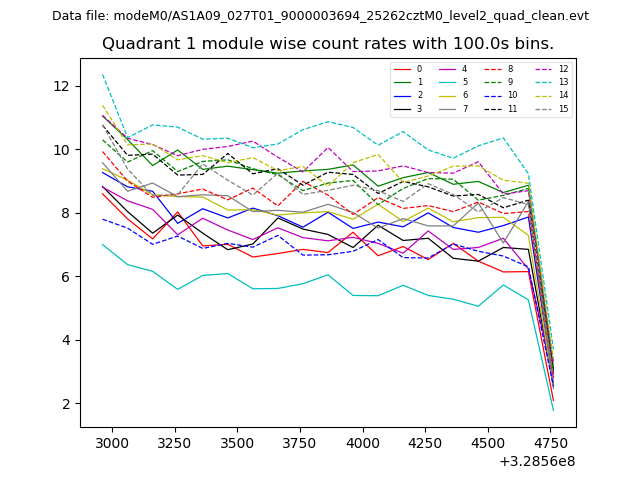
| Module-wise count rates for Quadrant A Data is divided into 100 sec bins |
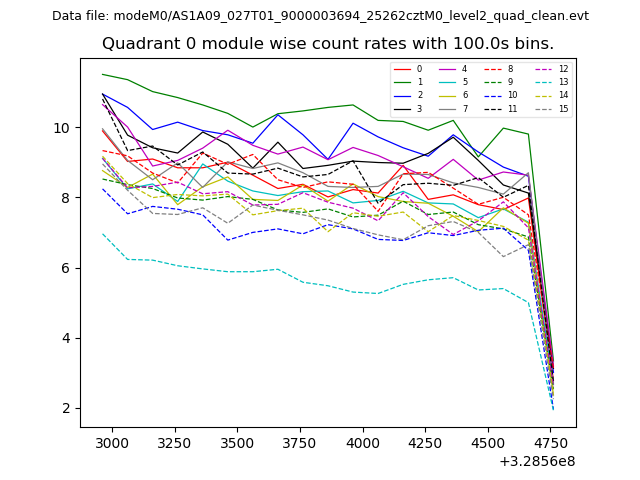 |
 |
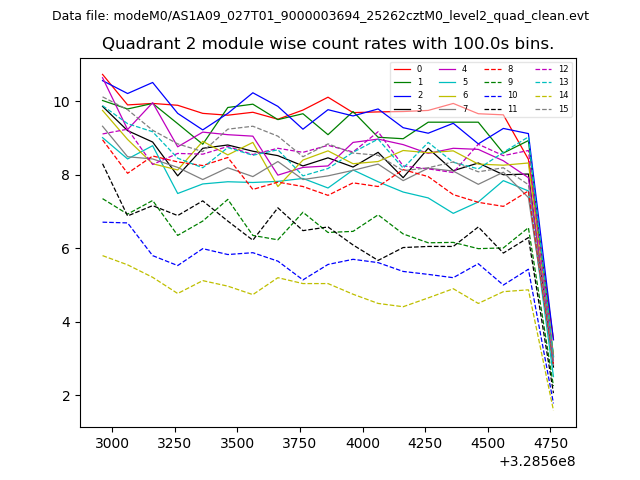
| Module-wise count rates for Quadrant B Data is divided into 100 sec bins |
 |
 |
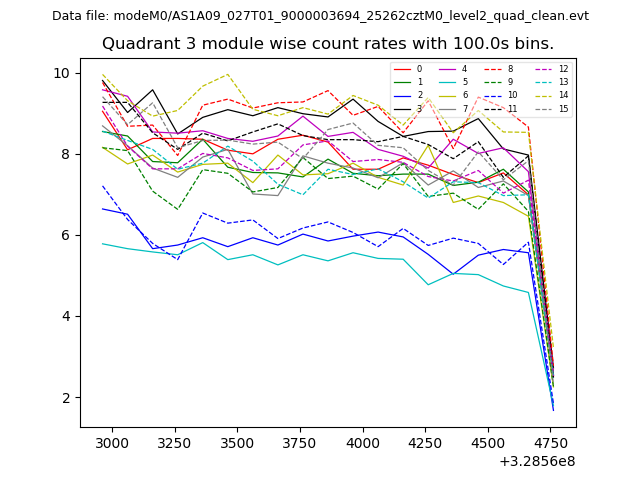
| Module-wise count rates for Quadrant C Data is divided into 100 sec bins |
 |
 |
| Module-wise count rates for Quadrant D Data is divided into 100 sec bins |
 |
 |
| Parameter | Plot |
|---|---|
| CZT HV Monitor | 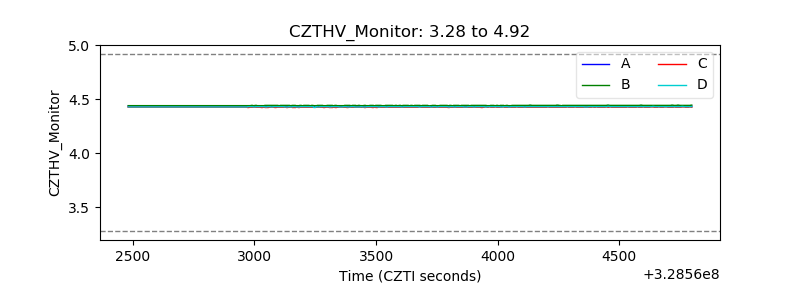 |
| D_VDD | 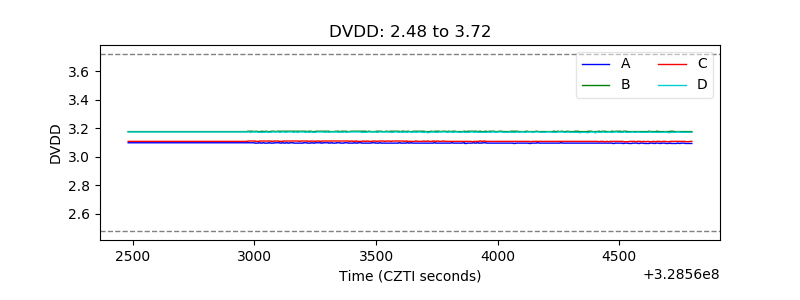 |
| Temperature 1 | 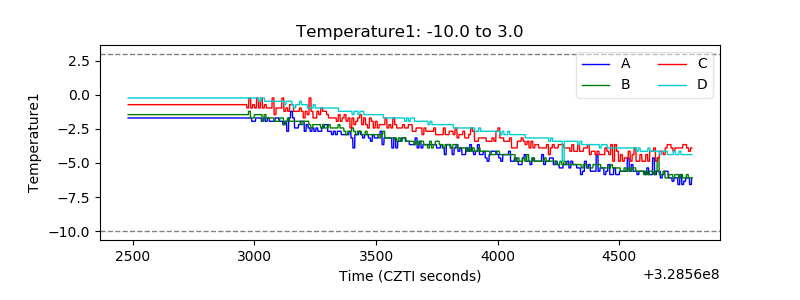 |
| Veto HV Monitor | 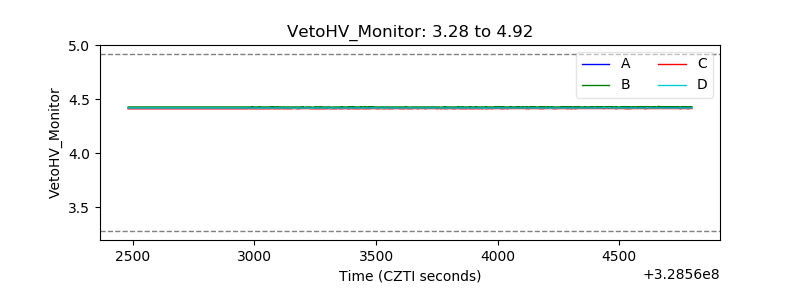 |
| Veto LLD | 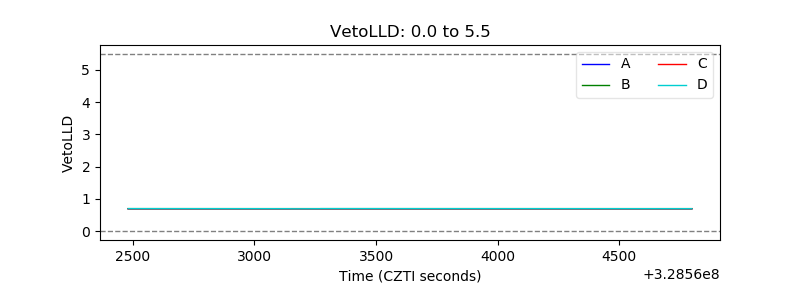 |
| Alpha Counter | 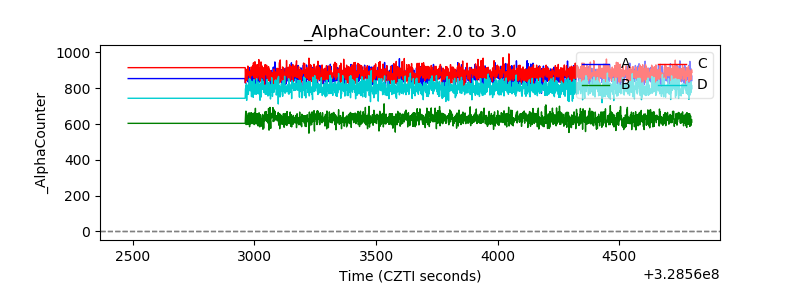 |
| _CPM_Rate | 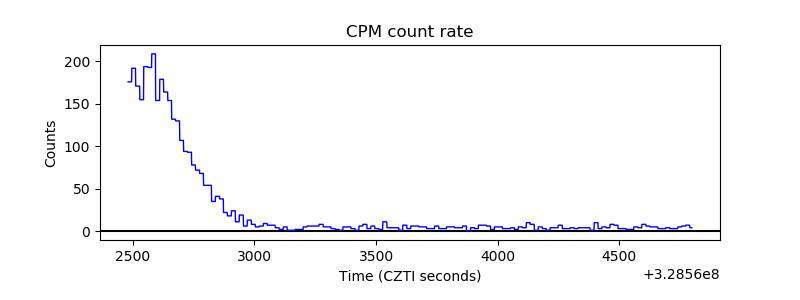 |
| CZT Counter | 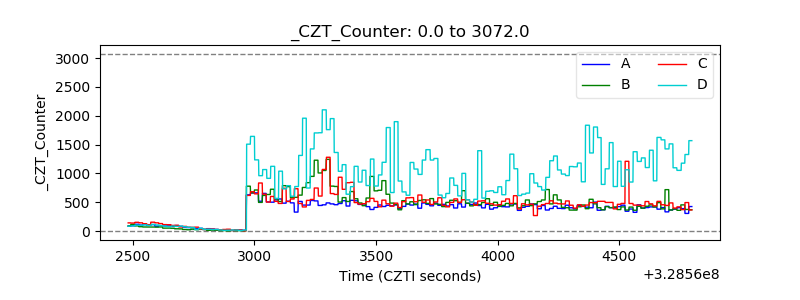 |
| +2.5 Volts monitor |  |
| +5 Volts monitor |  |
| _ROLL_ROT | 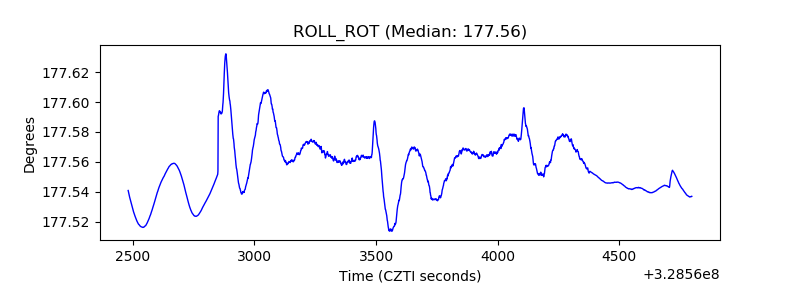 |
| _Roll_DEC |  |
| _Roll_RA | 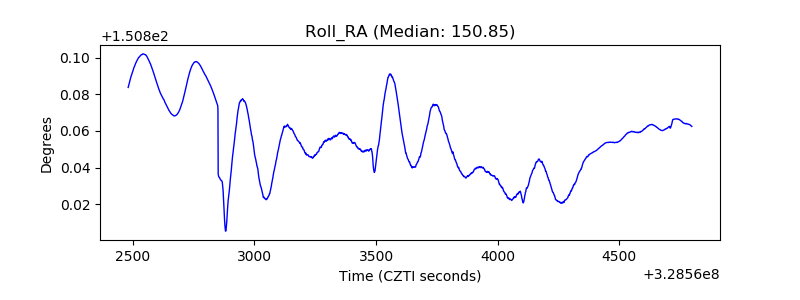 |
| Veto Counter | 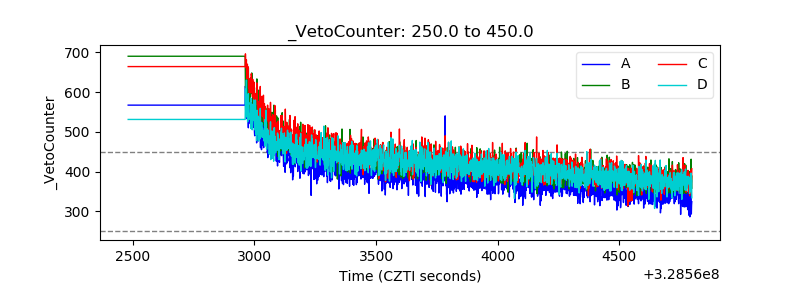 |