| Param | Original file | Final file |
|---|---|---|
| Filename | modeM0/AS1A09_027T02_9000003696_25262cztM0_level2.evt | modeM0/AS1A09_027T02_9000003696_25262cztM0_level2_quad_clean.evt |
| Size (bytes) | 462,271,680 | 77,443,200 |
| Size | 440.9 MB | 73.9 MB |
| Events in quadrant A | 2,414,363 | 514,882 |
| Events in quadrant B | 2,902,867 | 513,814 |
| Events in quadrant C | 2,527,742 | 496,955 |
| Events in quadrant D | 5,803,061 | 455,909 |
| Mode M0 | |||
|---|---|---|---|
| Quadrant | BADHDUFLAG | Total packets | Discarded packets |
| A | 0 | 10659 | 0 |
| B | 0 | 12185 | 0 |
| C | 0 | 10933 | 0 |
| D | 0 | 20922 | 0 |
| Mode M9 | |||
|---|---|---|---|
| Quadrant | BADHDUFLAG | Total packets | Discarded packets |
| A | 0 | 4 | 0 |
| B | 0 | 4 | 0 |
| C | 0 | 4 | 0 |
| D | 0 | 4 | 0 |
| Quadrant | Total seconds | Saturated seconds | Saturation percentage |
|---|---|---|---|
| A | 5182 | 24 | 0.463142% |
| B | 5182 | 142 | 2.740255% |
| C | 5182 | 101 | 1.949054% |
| D | 5182 | 702 | 13.546893% |
Noise dominated data is calculated using 1-second bins in cleaned event files. If a bin has >2000 counts, and if more than 50% of those come from <1% of pixels, then it is considered to be noise-dominated and hence unusable.
| Quadrant | # 1 sec bins | Bins with >0 counts | Bins with >2000 counts | High rate bins dominated by noise | Noise dominated (total time) | Noise dominated (detector-on time) | Marked lightcurve |
|---|---|---|---|---|---|---|---|
| A | 5587 | 5183 | 0 | 0 | 0.00% | 0.00% | 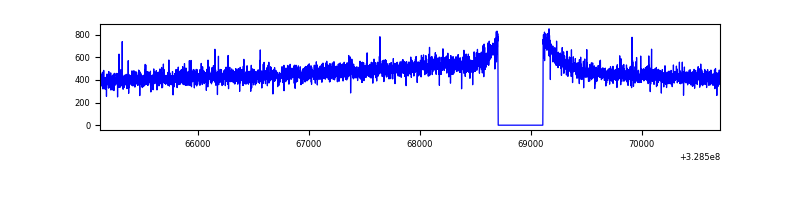 |
| B | 5587 | 5183 | 33 | 33 | 0.59% | 0.64% | 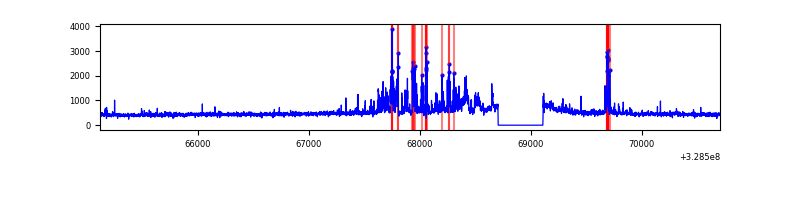 |
| C | 5587 | 5183 | 2 | 2 | 0.04% | 0.04% | 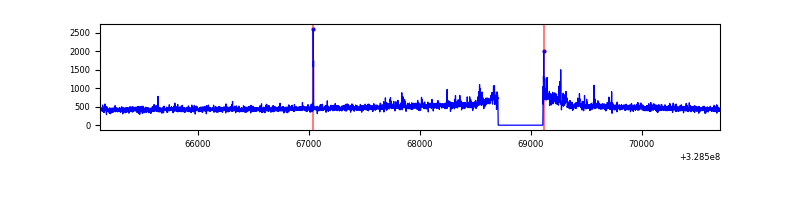 |
| D | 5587 | 5183 | 367 | 367 | 6.57% | 7.08% | 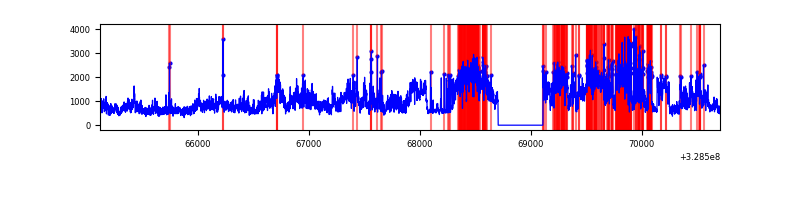 |
Top three noisy pixels from each quadrant. If the there are fewer than three noisy pixels in the level2.evt file, extra rows are filled as -1
| Pixel properties | Quadrant properties | ||||||
|---|---|---|---|---|---|---|---|
| Quadrant | DetID | PixID | Counts | Sigma | Mean | Median | Sigma |
| A | 3 | 1 | 9629 | 71.46 | 623 | 610 | 126.2 |
| A | 13 | 254 | 8572 | 63.08 | 623 | 610 | 126.2 |
| A | 3 | 137 | 5550 | 39.14 | 623 | 610 | 126.2 |
| B | 3 | 64 | 346715 | 2935.3 | 619 | 602 | 117.9 |
| B | 15 | 33 | 68697 | 577.5 | 619 | 602 | 117.9 |
| B | 0 | 190 | 33582 | 279.7 | 619 | 602 | 117.9 |
| C | 14 | 238 | 94958 | 673.36 | 599 | 601 | 140.1 |
| C | 3 | 233 | 71539 | 506.24 | 599 | 601 | 140.1 |
| C | 0 | 239 | 8806 | 58.55 | 599 | 601 | 140.1 |
| D | 8 | 195 | 1289025 | 9003.63 | 586 | 568 | 143.1 |
| D | 9 | 35 | 1123186 | 7844.76 | 586 | 568 | 143.1 |
| D | 1 | 52 | 687502 | 4800.24 | 586 | 568 | 143.1 |
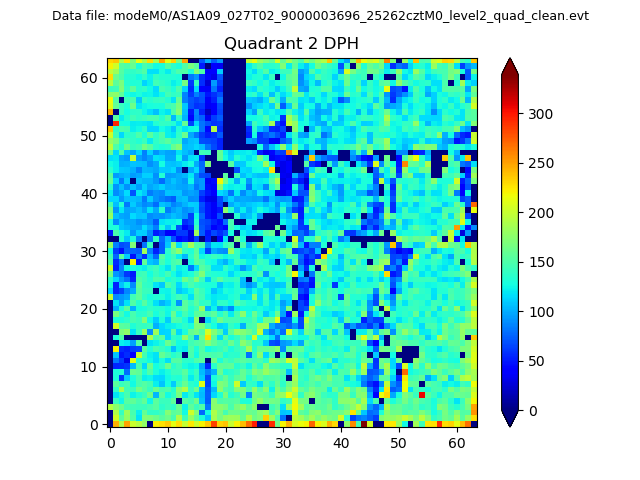
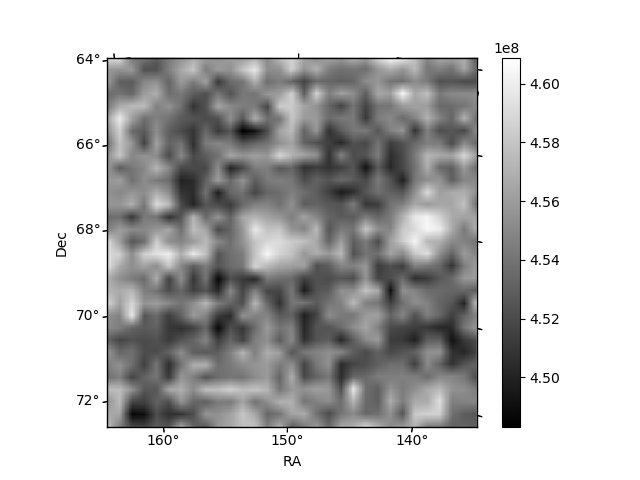
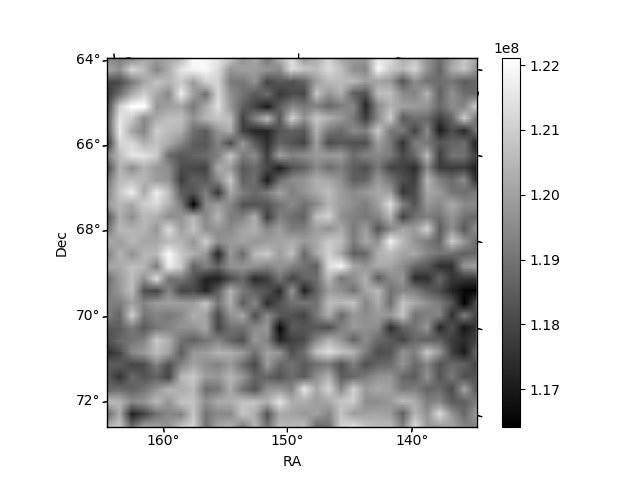
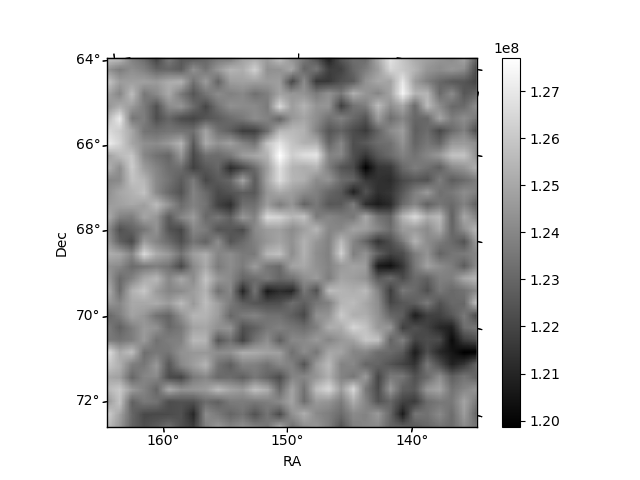
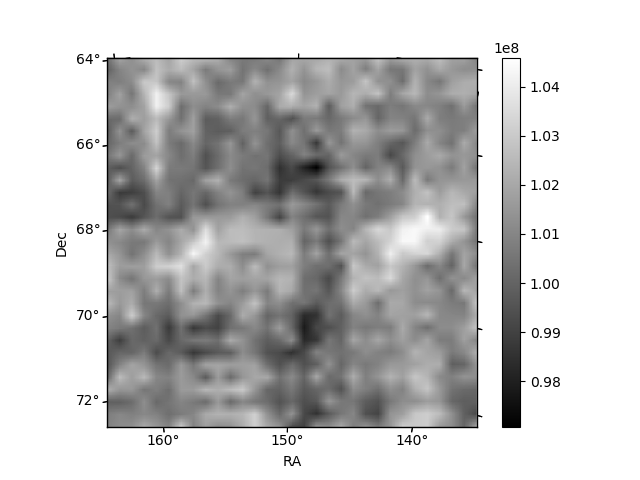
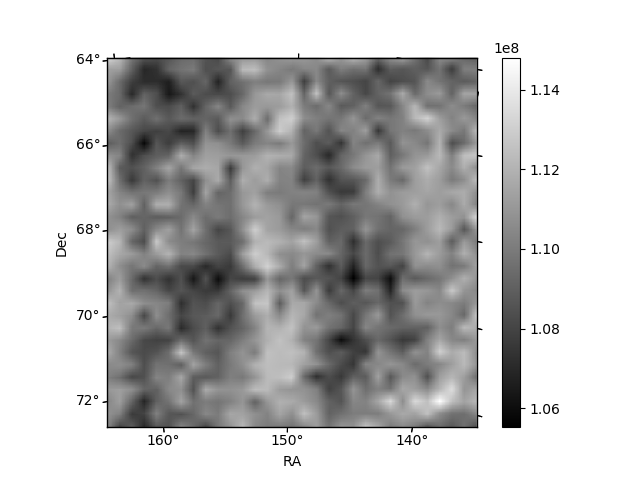
Histogram calculated using DETX and DETY for each event in the final _common_clean file
| Quadrant A | 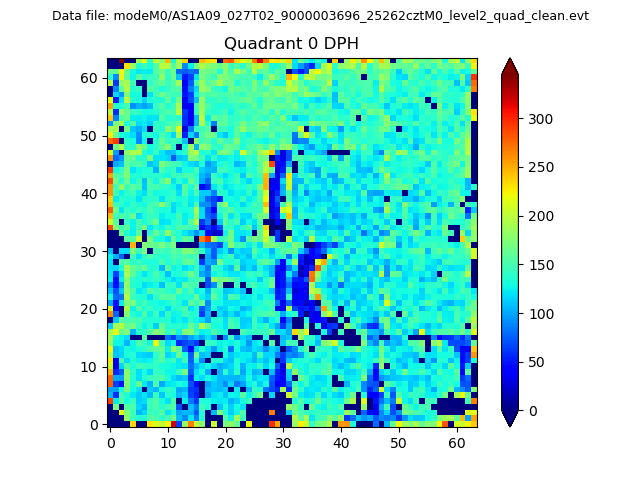 |
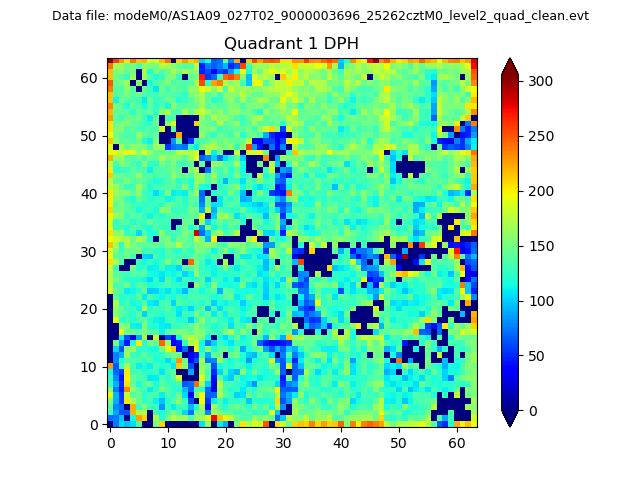 |
Quadrant B |
|---|---|---|---|
| Quadrant D | 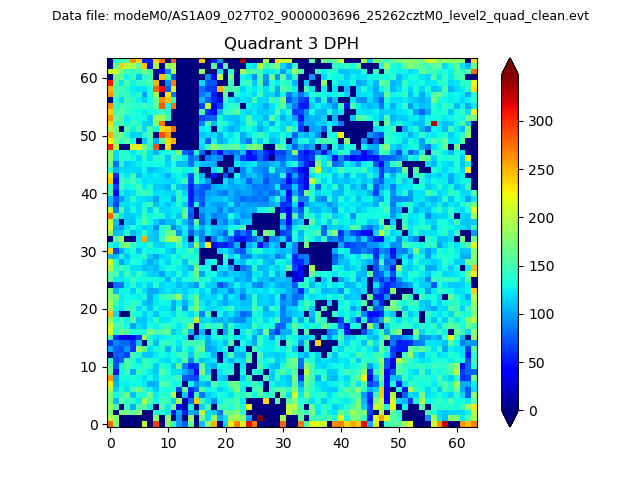 |
 |
Quadrant C |
| Plot type | Count rate plots | Images |
|---|---|---|
| Comparison with Poisson distribution Blue bars denote a histogram of data divided into 1 sec bins. Red curve is a Poisson curve with rate = median count rate of data. |
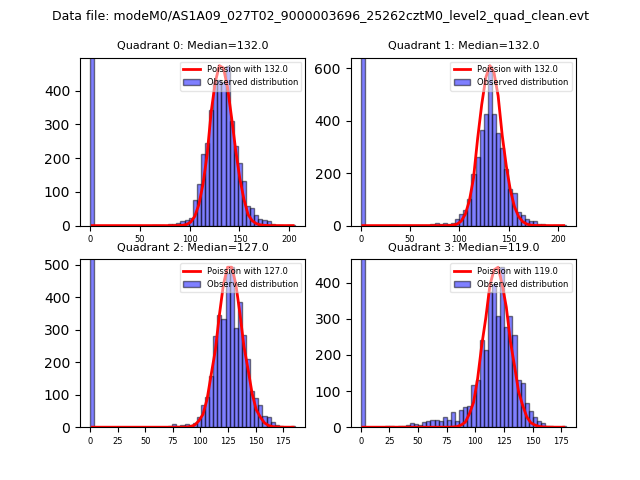 |
 |
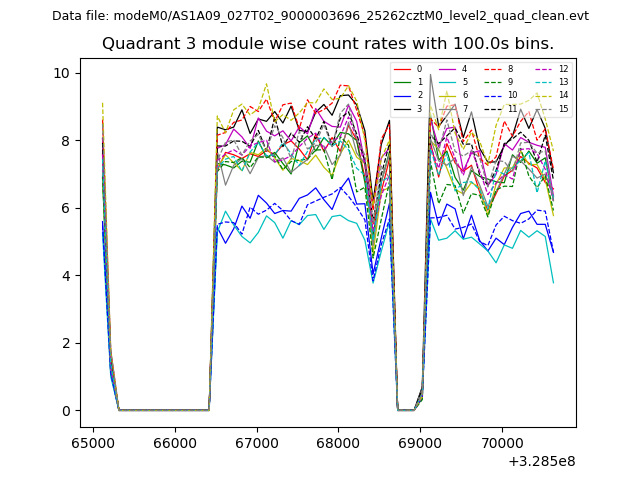
| Quadrant-wise count rates Data is divided into 100 sec bins |
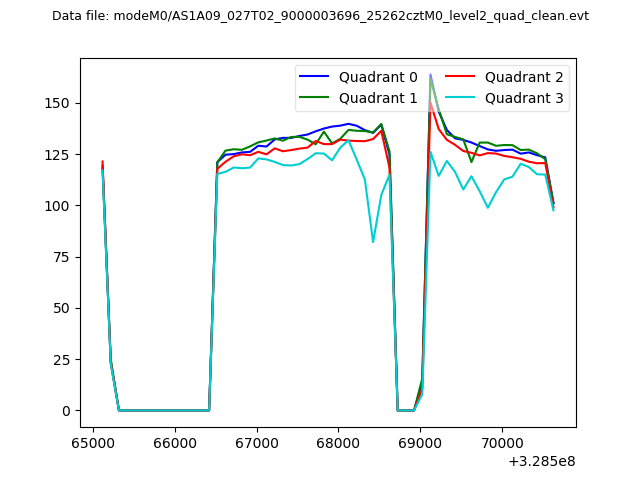 |
|
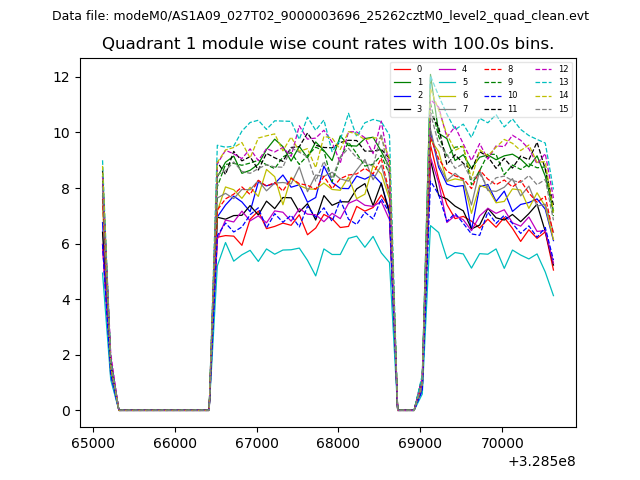
| Module-wise count rates for Quadrant A Data is divided into 100 sec bins |
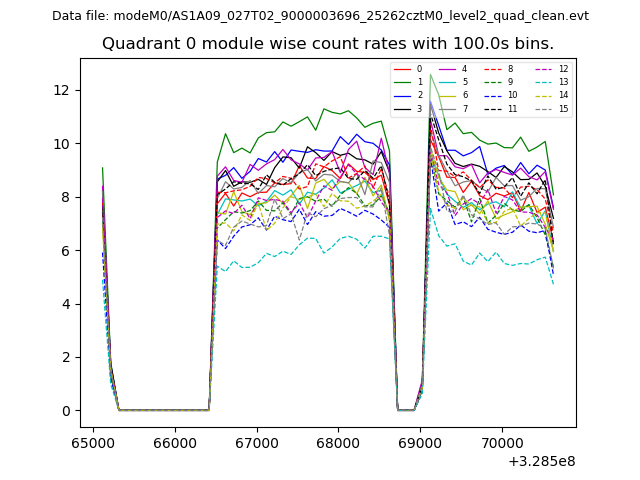 |
 |
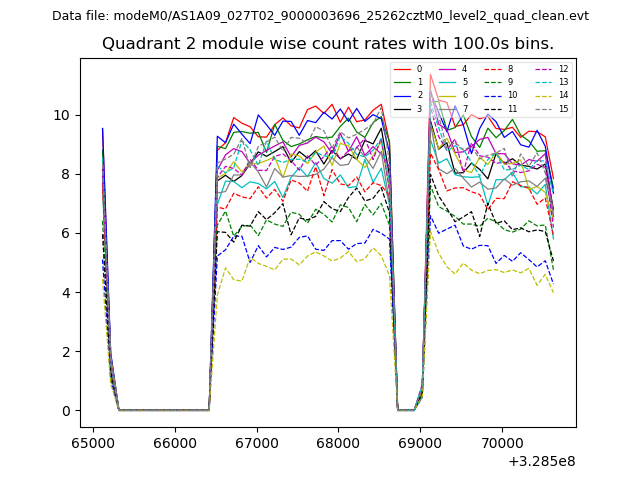
| Module-wise count rates for Quadrant B Data is divided into 100 sec bins |
 |
 |
| Module-wise count rates for Quadrant C Data is divided into 100 sec bins |
 |
 |
| Module-wise count rates for Quadrant D Data is divided into 100 sec bins |
 |
 |
| Parameter | Plot |
|---|---|
| CZT HV Monitor | 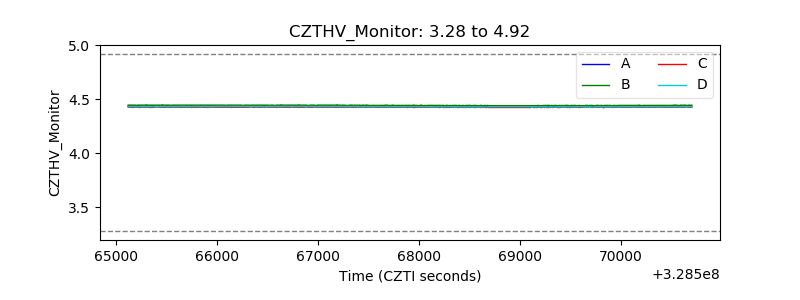 |
| D_VDD | 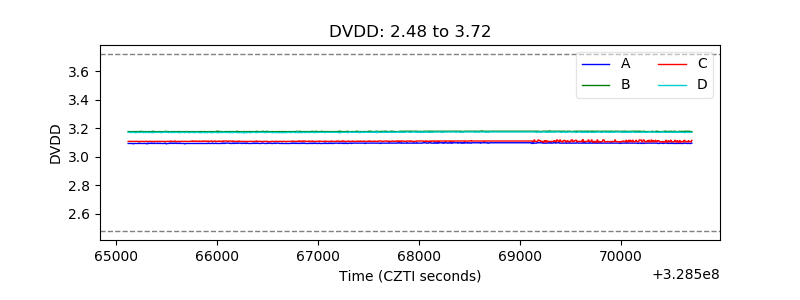 |
| Temperature 1 | 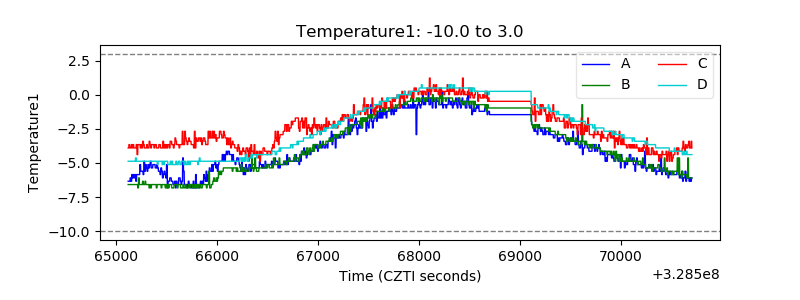 |
| Veto HV Monitor |  |
| Veto LLD | 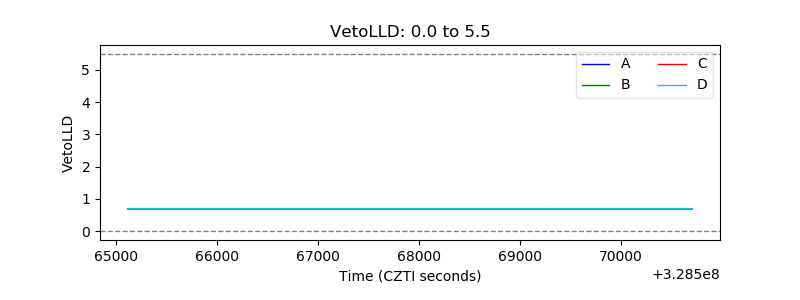 |
| Alpha Counter | 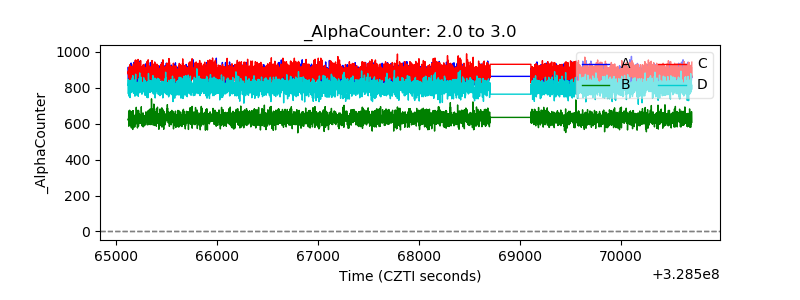 |
| _CPM_Rate | 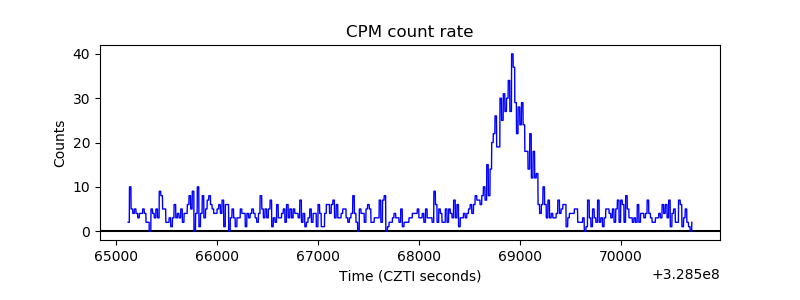 |
| CZT Counter | 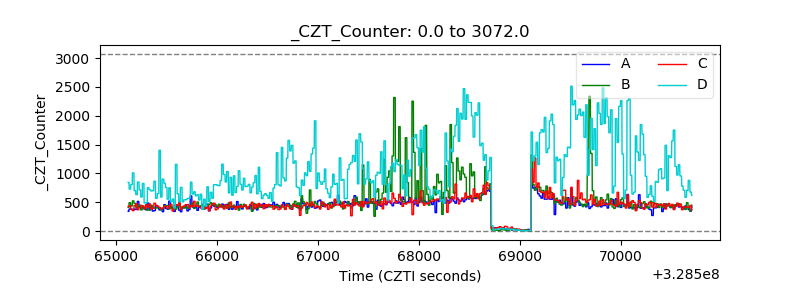 |
| +2.5 Volts monitor | 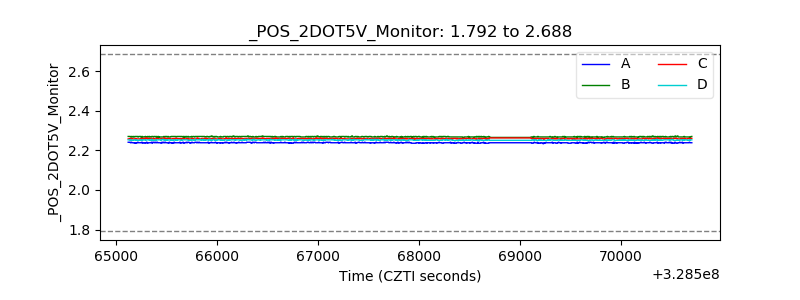 |
| +5 Volts monitor | 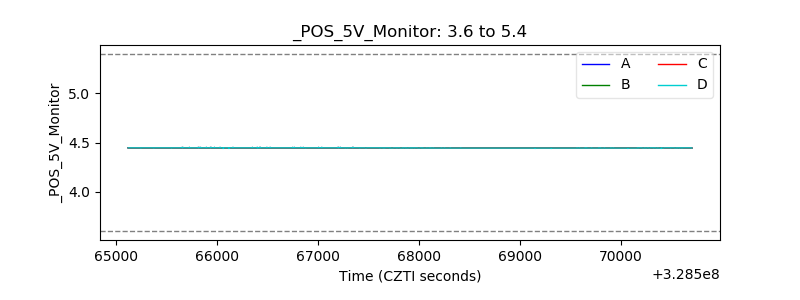 |
| _ROLL_ROT | 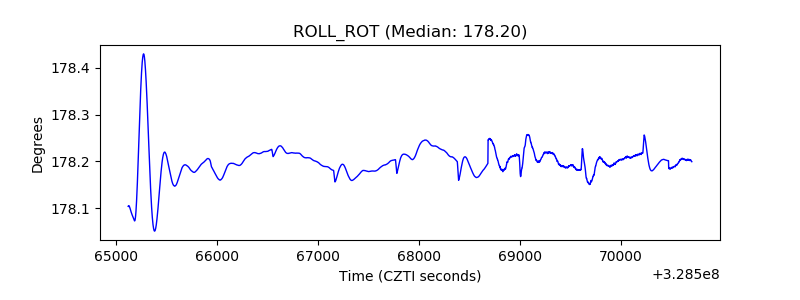 |
| _Roll_DEC | 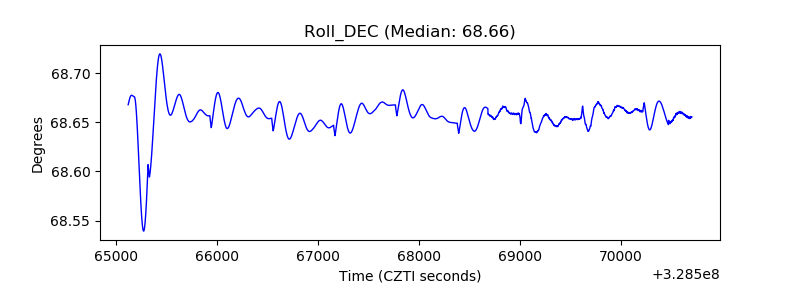 |
| _Roll_RA | 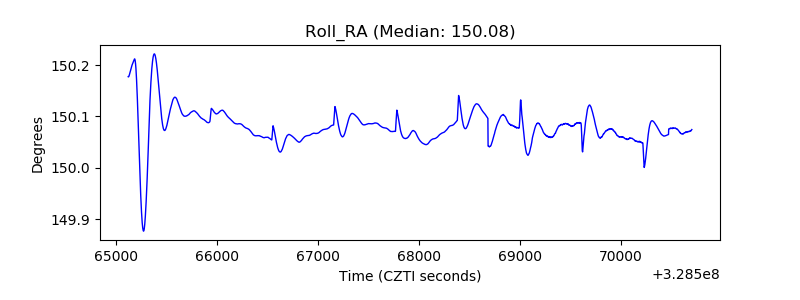 |
| Veto Counter | 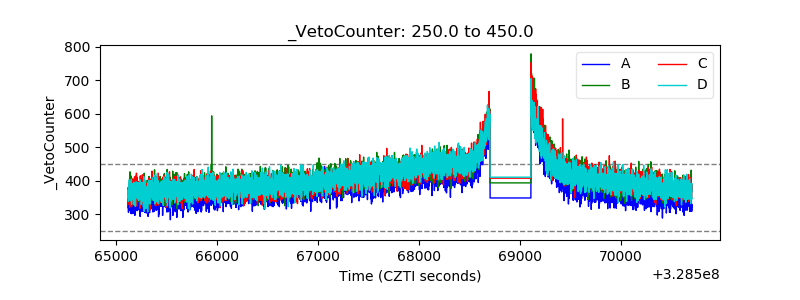 |