| Param | Original file | Final file |
|---|---|---|
| Filename | modeM0/AS1A09_027T02_9000003696_25263cztM0_level2.evt | modeM0/AS1A09_027T02_9000003696_25263cztM0_level2_quad_clean.evt |
| Size (bytes) | 788,760,000 | 120,481,920 |
| Size | 752.2 MB | 114.9 MB |
| Events in quadrant A | 3,547,149 | 818,935 |
| Events in quadrant B | 4,507,771 | 816,580 |
| Events in quadrant C | 3,763,157 | 793,643 |
| Events in quadrant D | 11,550,208 | 684,210 |
| Mode M0 | |||
|---|---|---|---|
| Quadrant | BADHDUFLAG | Total packets | Discarded packets |
| A | 0 | 15793 | 0 |
| B | 0 | 18612 | 0 |
| C | 0 | 16304 | 0 |
| D | 0 | 39737 | 0 |
| Mode M9 | |||
|---|---|---|---|
| Quadrant | BADHDUFLAG | Total packets | Discarded packets |
| A | 0 | 3 | 0 |
| B | 0 | 4 | 0 |
| C | 0 | 4 | 0 |
| D | 0 | 4 | 0 |
| Quadrant | Total seconds | Saturated seconds | Saturation percentage |
|---|---|---|---|
| A | 7693 | 43 | 0.558950% |
| B | 7693 | 258 | 3.353698% |
| C | 7693 | 165 | 2.144807% |
| D | 7693 | 2150 | 27.947485% |
Noise dominated data is calculated using 1-second bins in cleaned event files. If a bin has >2000 counts, and if more than 50% of those come from <1% of pixels, then it is considered to be noise-dominated and hence unusable.
| Quadrant | # 1 sec bins | Bins with >0 counts | Bins with >2000 counts | High rate bins dominated by noise | Noise dominated (total time) | Noise dominated (detector-on time) | Marked lightcurve |
|---|---|---|---|---|---|---|---|
| A | 7913 | 7695 | 0 | 0 | 0.00% | 0.00% | 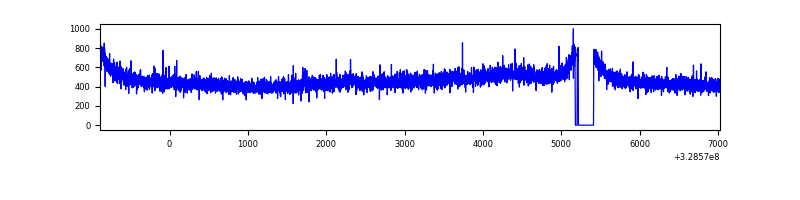 |
| B | 7913 | 7695 | 110 | 110 | 1.39% | 1.43% | 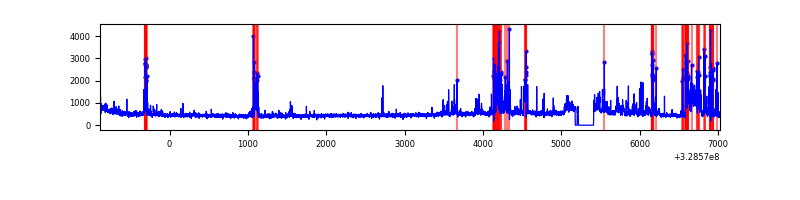 |
| C | 7913 | 7695 | 5 | 5 | 0.06% | 0.06% | 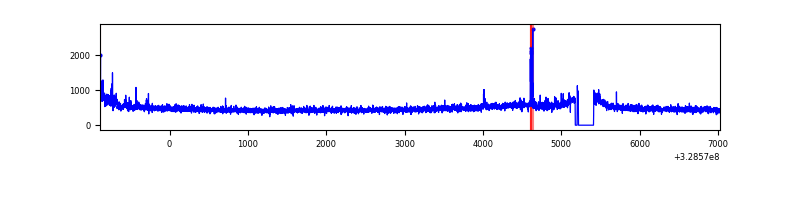 |
| D | 7913 | 7695 | 1567 | 1567 | 19.80% | 20.36% | 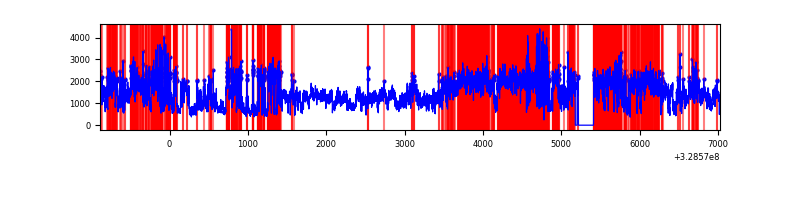 |
Top three noisy pixels from each quadrant. If the there are fewer than three noisy pixels in the level2.evt file, extra rows are filled as -1
| Pixel properties | Quadrant properties | ||||||
|---|---|---|---|---|---|---|---|
| Quadrant | DetID | PixID | Counts | Sigma | Mean | Median | Sigma |
| A | 3 | 1 | 22309 | 115.51 | 914 | 893 | 185.4 |
| A | 13 | 254 | 12436 | 62.26 | 914 | 893 | 185.4 |
| A | 3 | 137 | 8140 | 39.09 | 914 | 893 | 185.4 |
| B | 3 | 64 | 817807 | 4764.19 | 908 | 883 | 171.5 |
| B | 0 | 190 | 38041 | 216.7 | 908 | 883 | 171.5 |
| B | 0 | 219 | 36620 | 208.41 | 908 | 883 | 171.5 |
| C | 14 | 238 | 141193 | 682.87 | 886 | 892 | 205.5 |
| C | 3 | 233 | 103414 | 498.99 | 886 | 892 | 205.5 |
| C | 0 | 207 | 30517 | 144.19 | 886 | 892 | 205.5 |
| D | 9 | 35 | 4620963 | 23026.61 | 827 | 801 | 200.6 |
| D | 1 | 52 | 2011562 | 10021.51 | 827 | 801 | 200.6 |
| D | 8 | 195 | 1161356 | 5784.14 | 827 | 801 | 200.6 |
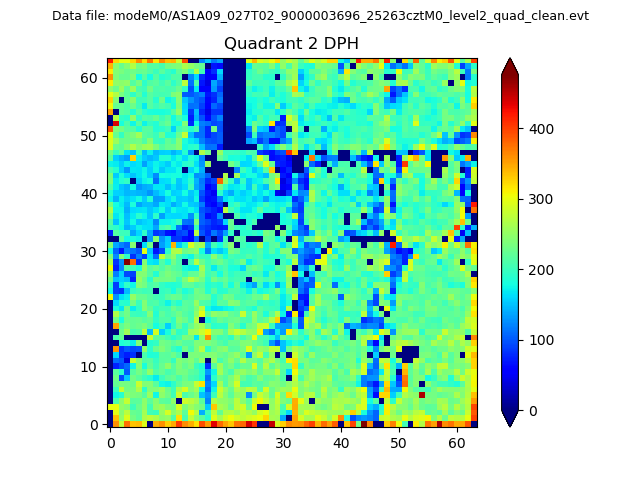
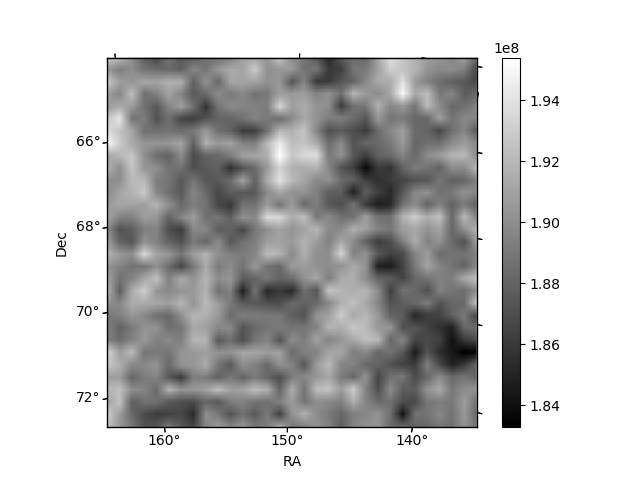
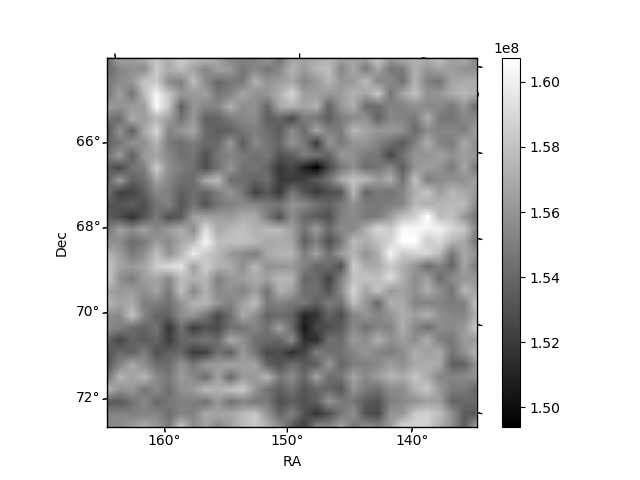
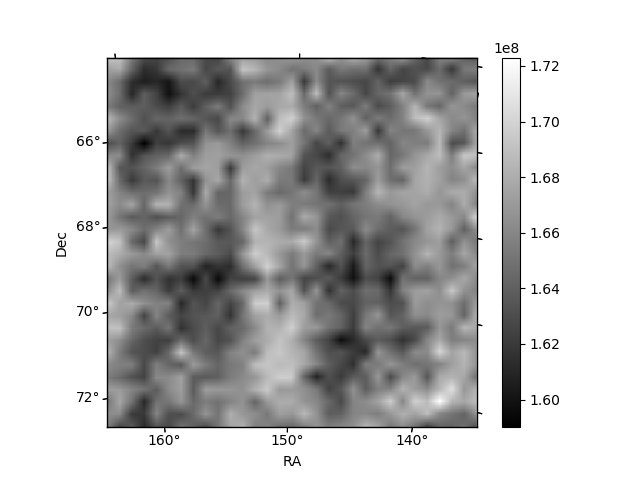
Histogram calculated using DETX and DETY for each event in the final _common_clean file
| Quadrant A | 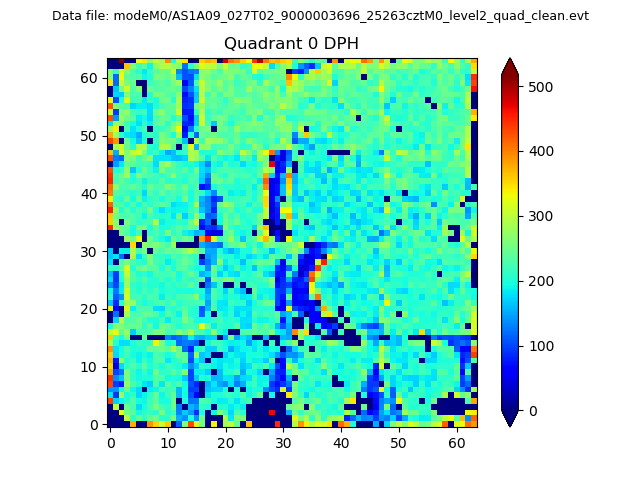 |
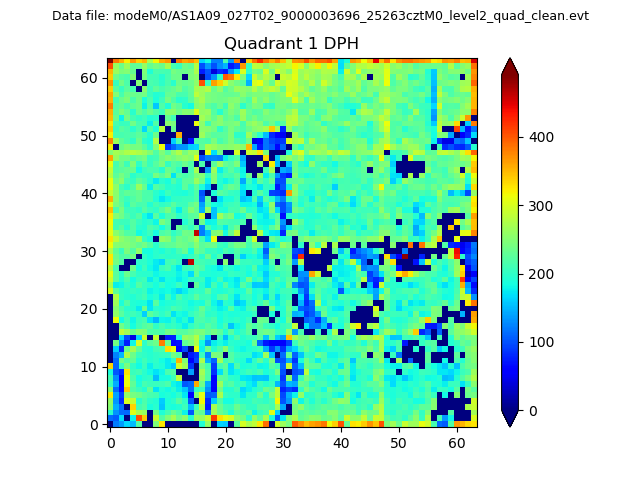 |
Quadrant B |
|---|---|---|---|
| Quadrant D | 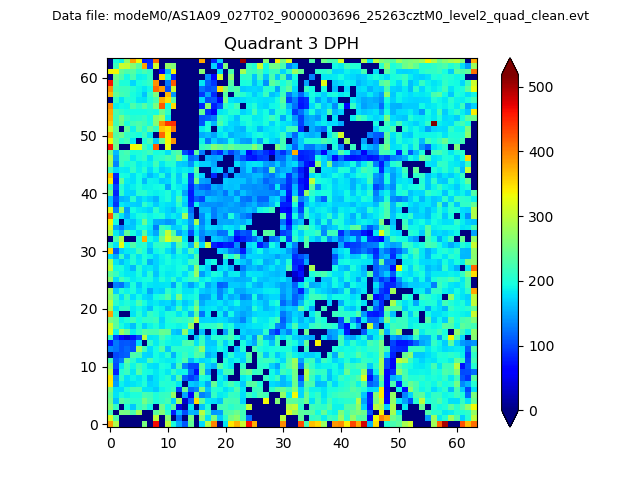 |
 |
Quadrant C |
| Plot type | Count rate plots | Images |
|---|---|---|
| Comparison with Poisson distribution Blue bars denote a histogram of data divided into 1 sec bins. Red curve is a Poisson curve with rate = median count rate of data. |
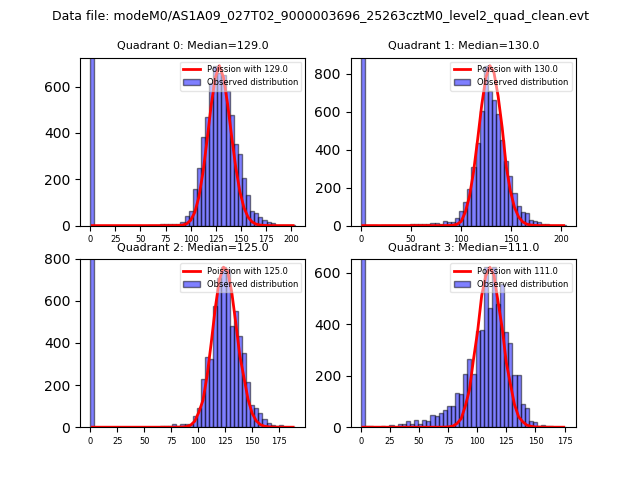 |
 |
| Quadrant-wise count rates Data is divided into 100 sec bins |
 |
|
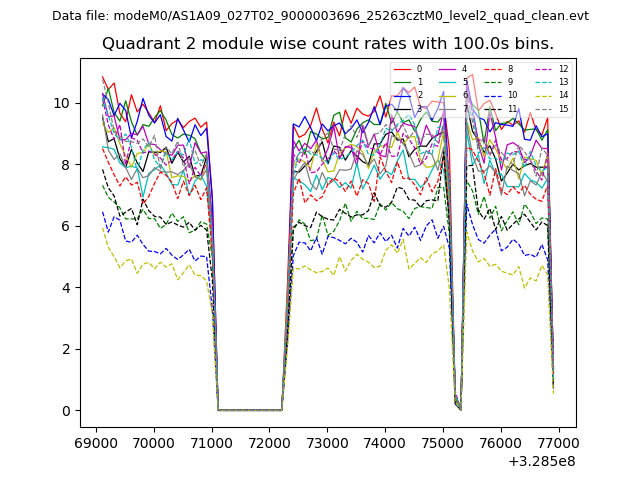
| Module-wise count rates for Quadrant A Data is divided into 100 sec bins |
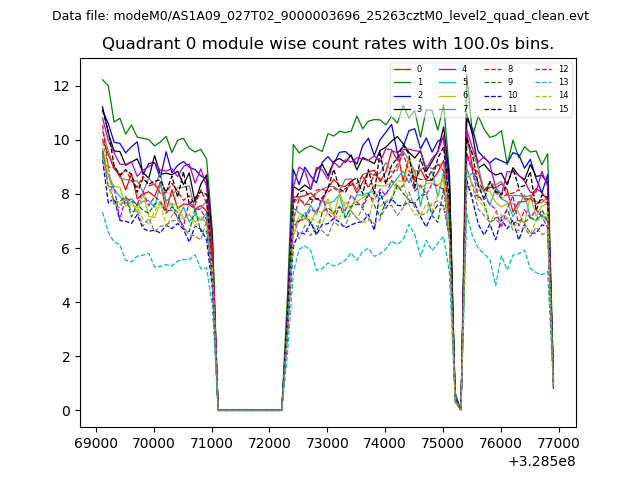 |
 |
| Module-wise count rates for Quadrant B Data is divided into 100 sec bins |
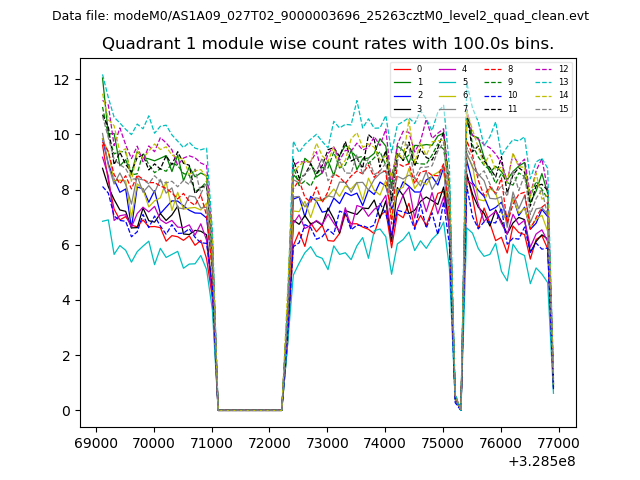 |
 |
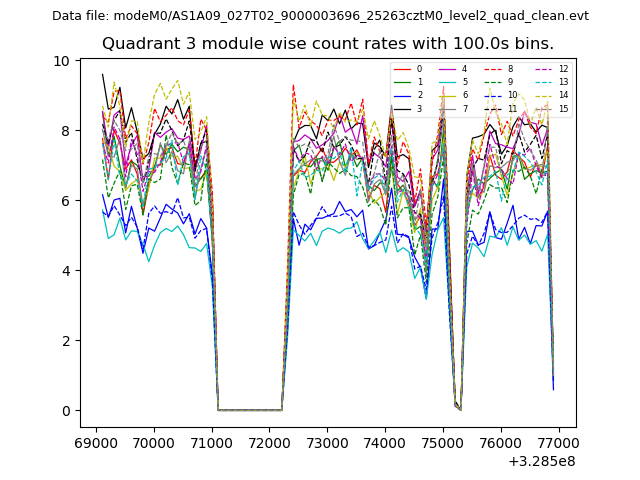
| Module-wise count rates for Quadrant C Data is divided into 100 sec bins |
 |
 |
| Module-wise count rates for Quadrant D Data is divided into 100 sec bins |
 |
 |
| Parameter | Plot |
|---|---|
| CZT HV Monitor | 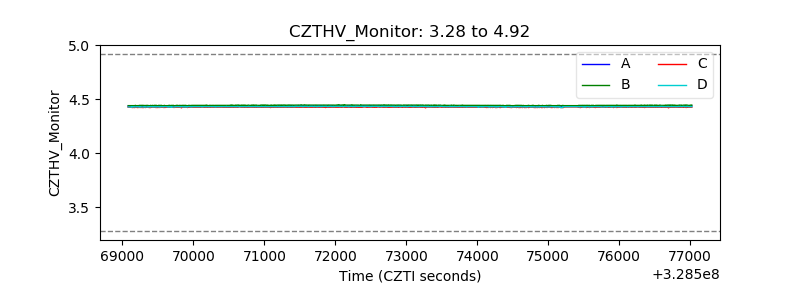 |
| D_VDD | 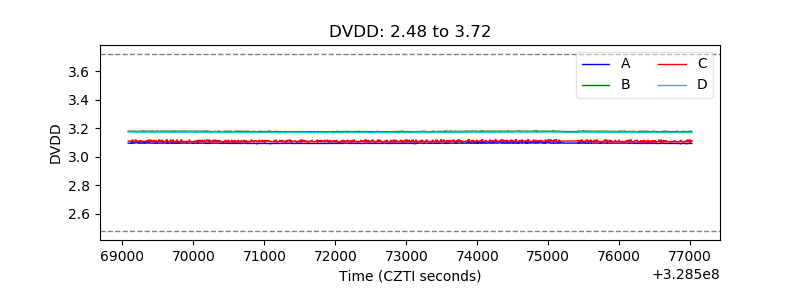 |
| Temperature 1 | 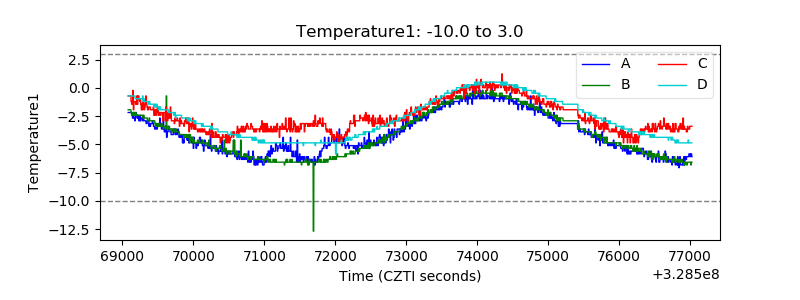 |
| Veto HV Monitor | 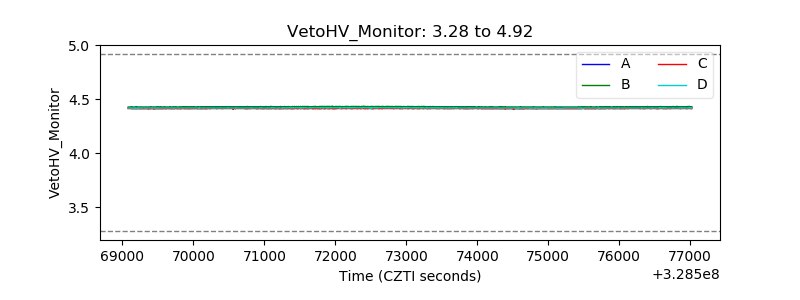 |
| Veto LLD | 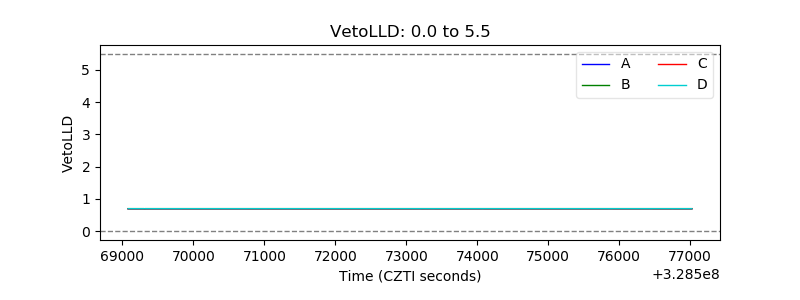 |
| Alpha Counter | 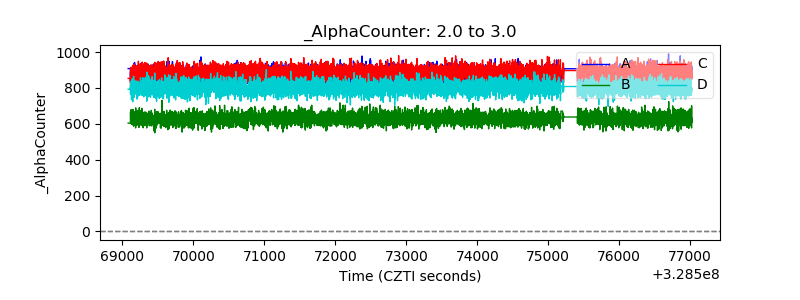 |
| _CPM_Rate | 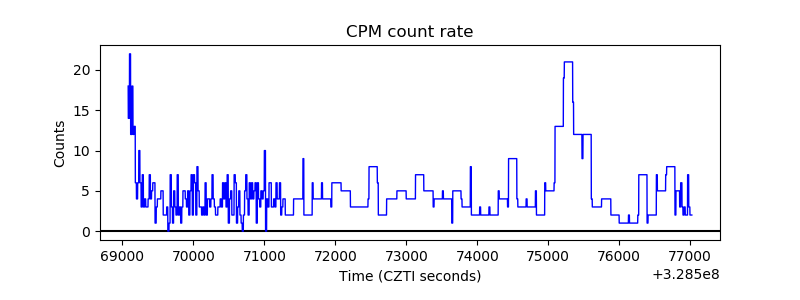 |
| CZT Counter |  |
| +2.5 Volts monitor |  |
| +5 Volts monitor |  |
| _ROLL_ROT | 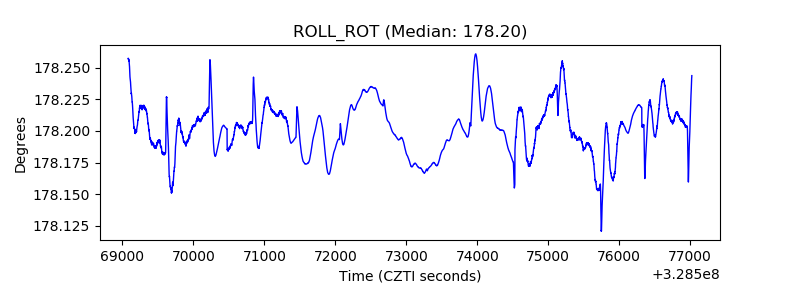 |
| _Roll_DEC | 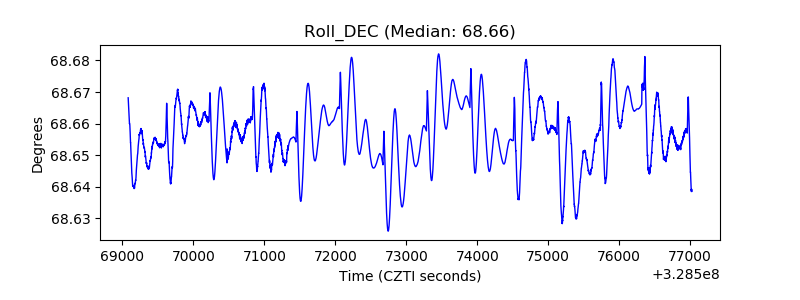 |
| _Roll_RA |  |
| Veto Counter | 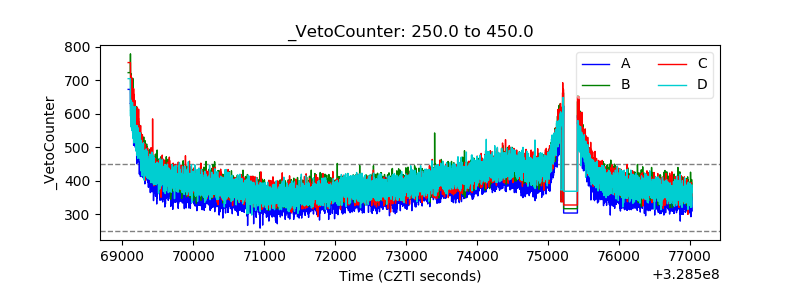 |