| Param | Original file | Final file |
|---|---|---|
| Filename | modeM0/AS1A09_027T02_9000003696_25264cztM0_level2.evt | modeM0/AS1A09_027T02_9000003696_25264cztM0_level2_quad_clean.evt |
| Size (bytes) | 876,712,320 | 106,732,800 |
| Size | 836.1 MB | 101.8 MB |
| Events in quadrant A | 3,527,918 | 734,962 |
| Events in quadrant B | 6,140,764 | 709,259 |
| Events in quadrant C | 3,758,668 | 712,770 |
| Events in quadrant D | 12,604,990 | 539,033 |
| Mode M0 | |||
|---|---|---|---|
| Quadrant | BADHDUFLAG | Total packets | Discarded packets |
| A | 0 | 15823 | 0 |
| B | 0 | 23377 | 0 |
| C | 0 | 16250 | 0 |
| D | 0 | 42861 | 0 |
| Mode M9 | |||
|---|---|---|---|
| Quadrant | BADHDUFLAG | Total packets | Discarded packets |
| A | 0 | 3 | 0 |
| B | 0 | 4 | 0 |
| C | 0 | 4 | 0 |
| D | 0 | 4 | 0 |
| Quadrant | Total seconds | Saturated seconds | Saturation percentage |
|---|---|---|---|
| A | 7690 | 40 | 0.520156% |
| B | 7690 | 794 | 10.325098% |
| C | 7690 | 103 | 1.339402% |
| D | 7690 | 2690 | 34.980494% |
Noise dominated data is calculated using 1-second bins in cleaned event files. If a bin has >2000 counts, and if more than 50% of those come from <1% of pixels, then it is considered to be noise-dominated and hence unusable.
| Quadrant | # 1 sec bins | Bins with >0 counts | Bins with >2000 counts | High rate bins dominated by noise | Noise dominated (total time) | Noise dominated (detector-on time) | Marked lightcurve |
|---|---|---|---|---|---|---|---|
| A | 8040 | 7691 | 0 | 0 | 0.00% | 0.00% | 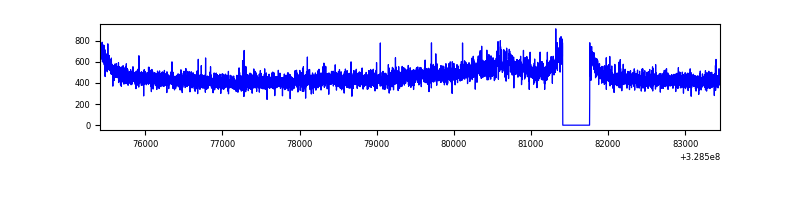 |
| B | 8040 | 7691 | 498 | 498 | 6.19% | 6.48% | 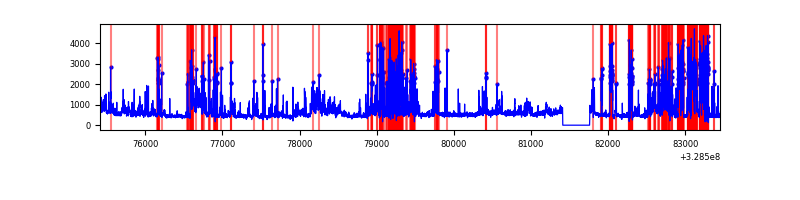 |
| C | 8040 | 7691 | 1 | 1 | 0.01% | 0.01% | 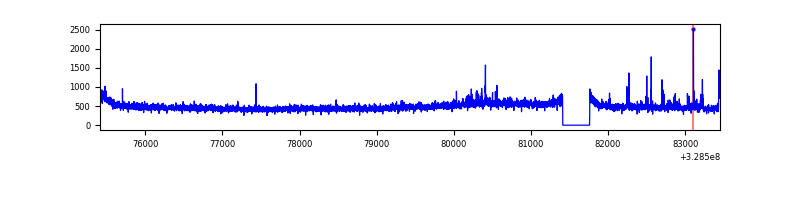 |
| D | 8040 | 7691 | 2370 | 2370 | 29.48% | 30.82% | 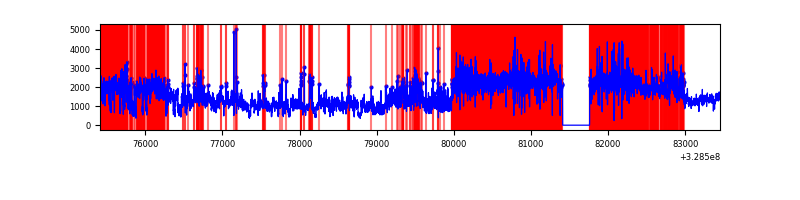 |
Top three noisy pixels from each quadrant. If the there are fewer than three noisy pixels in the level2.evt file, extra rows are filled as -1
| Pixel properties | Quadrant properties | ||||||
|---|---|---|---|---|---|---|---|
| Quadrant | DetID | PixID | Counts | Sigma | Mean | Median | Sigma |
| A | 3 | 1 | 36580 | 197.22 | 905 | 884 | 181.0 |
| A | 13 | 254 | 12461 | 63.96 | 905 | 884 | 181.0 |
| A | 3 | 137 | 8040 | 39.54 | 905 | 884 | 181.0 |
| B | 3 | 64 | 2562649 | 15504.78 | 867 | 843 | 165.2 |
| B | 0 | 219 | 73477 | 439.6 | 867 | 843 | 165.2 |
| B | 10 | 251 | 49785 | 296.21 | 867 | 843 | 165.2 |
| C | 14 | 238 | 137813 | 665.66 | 878 | 883 | 205.7 |
| C | 3 | 233 | 123430 | 595.74 | 878 | 883 | 205.7 |
| C | 0 | 207 | 26915 | 126.55 | 878 | 883 | 205.7 |
| D | 9 | 35 | 3944261 | 21605.85 | 752 | 730 | 182.5 |
| D | 1 | 239 | 2526141 | 13836.24 | 752 | 730 | 182.5 |
| D | 1 | 52 | 2396220 | 13124.43 | 752 | 730 | 182.5 |
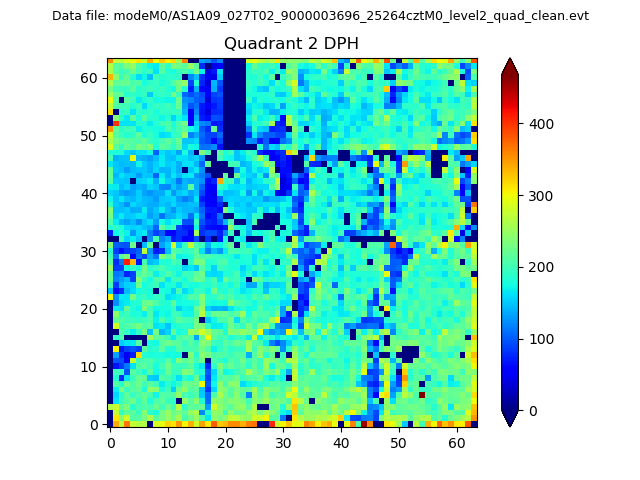
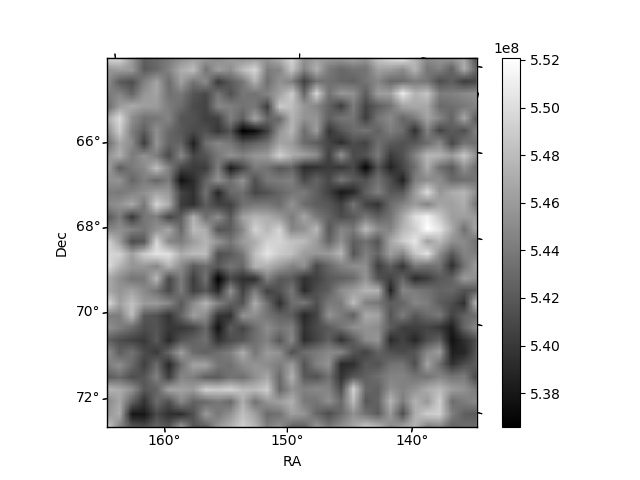
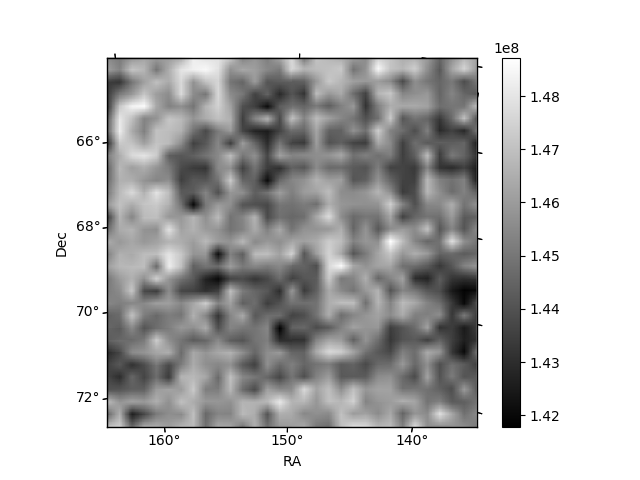
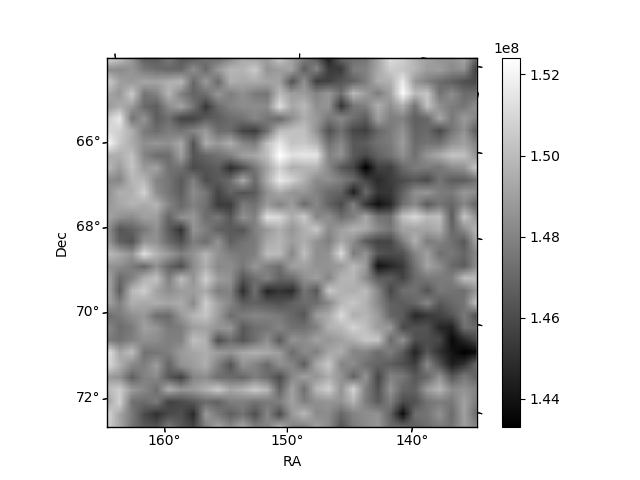
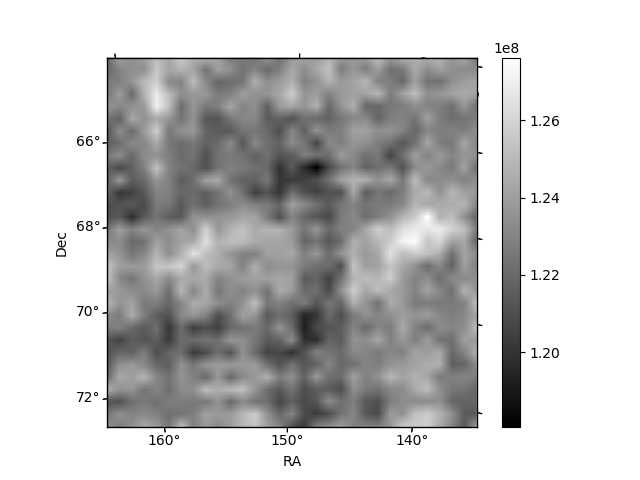
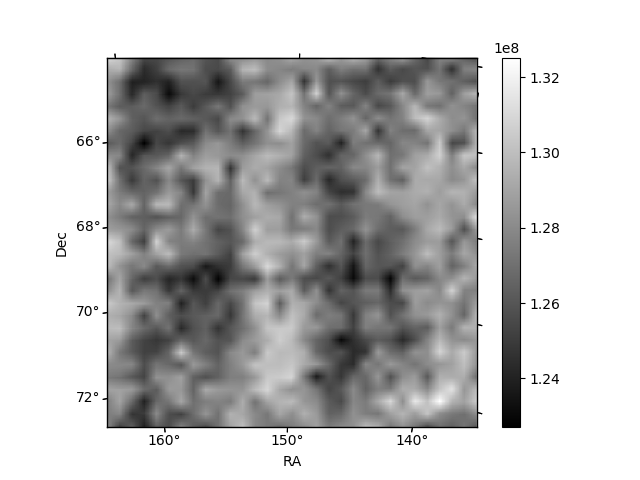
Histogram calculated using DETX and DETY for each event in the final _common_clean file
| Quadrant A | 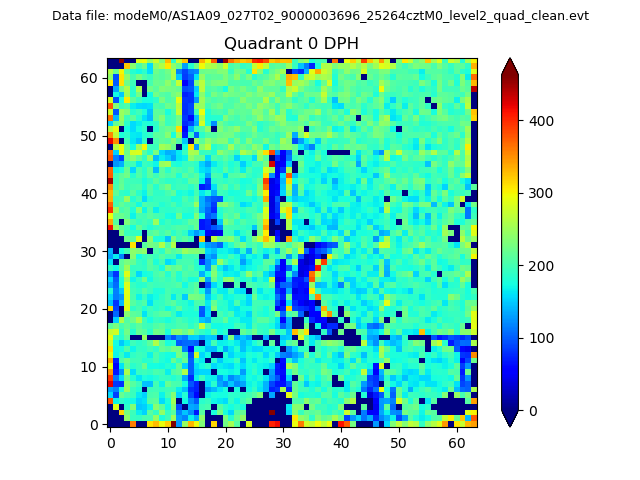 |
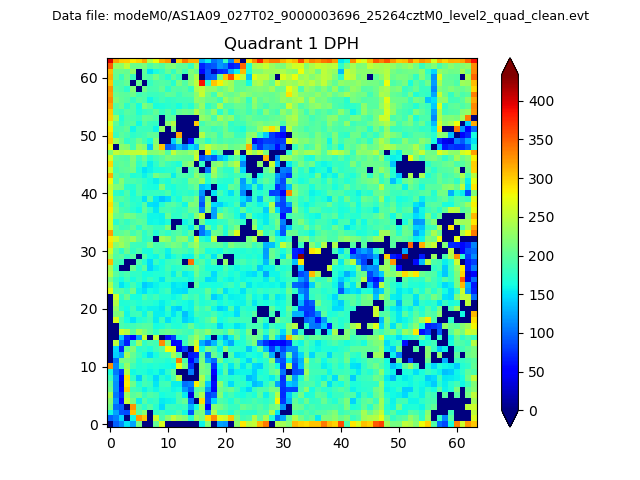 |
Quadrant B |
|---|---|---|---|
| Quadrant D | 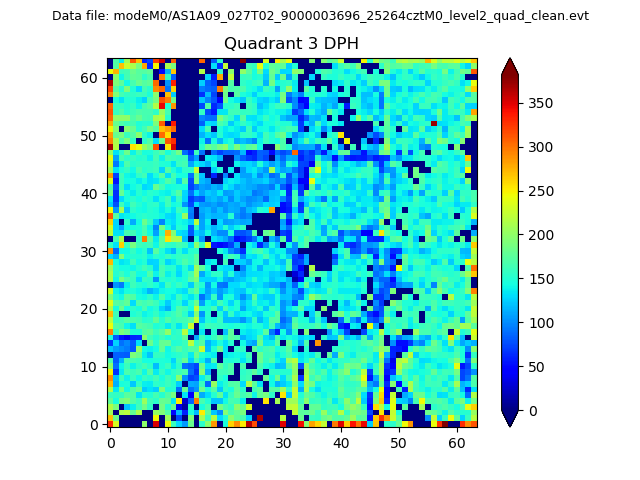 |
 |
Quadrant C |
| Plot type | Count rate plots | Images |
|---|---|---|
| Comparison with Poisson distribution Blue bars denote a histogram of data divided into 1 sec bins. Red curve is a Poisson curve with rate = median count rate of data. |
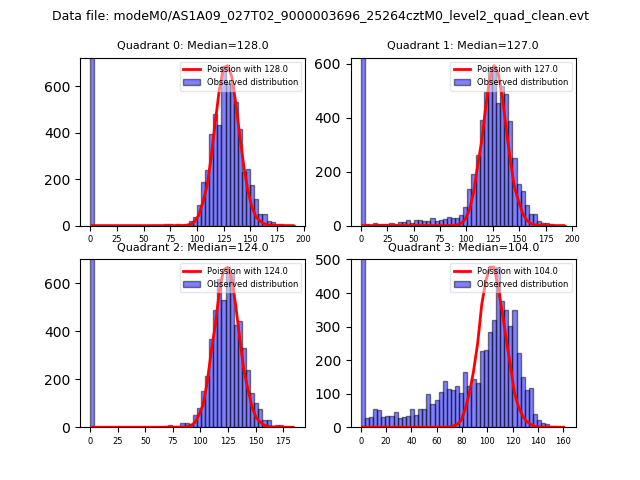 |
 |
| Quadrant-wise count rates Data is divided into 100 sec bins |
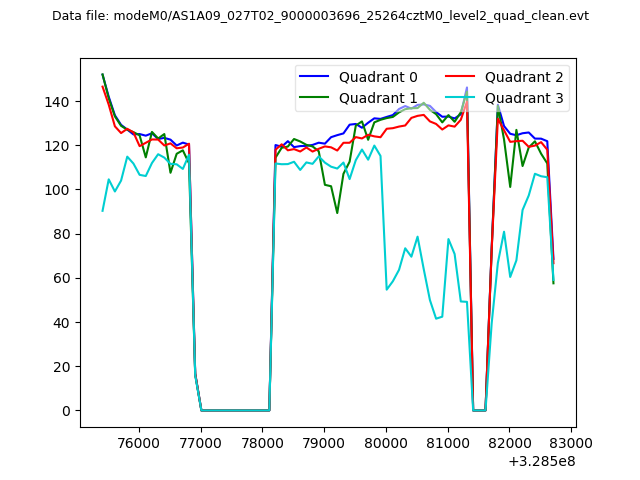 |
|
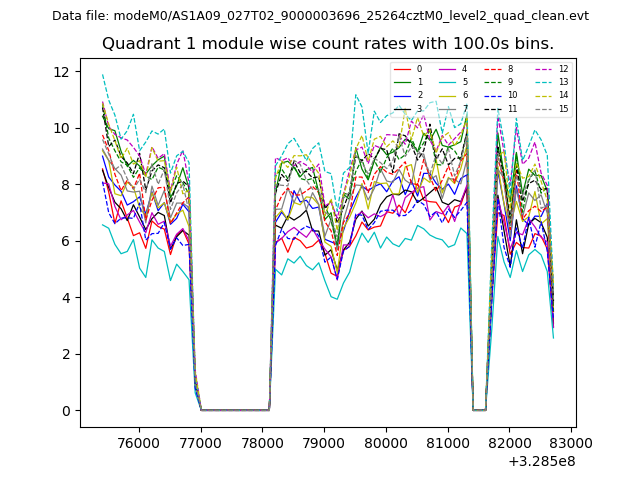
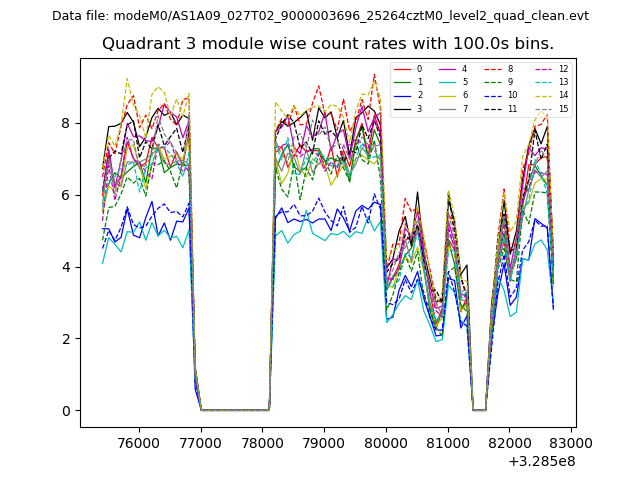
| Module-wise count rates for Quadrant A Data is divided into 100 sec bins |
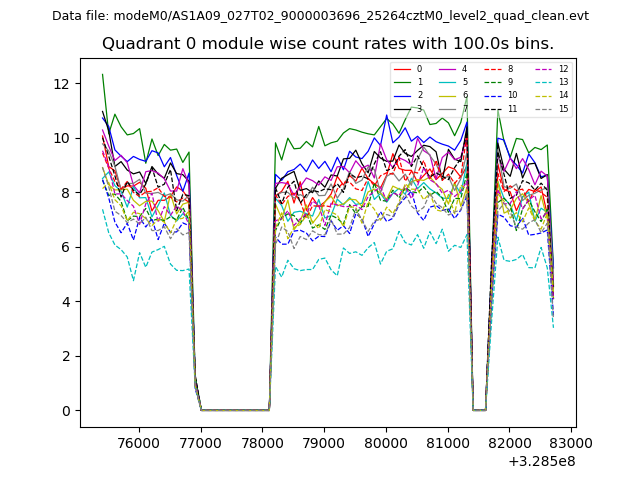 |
 |
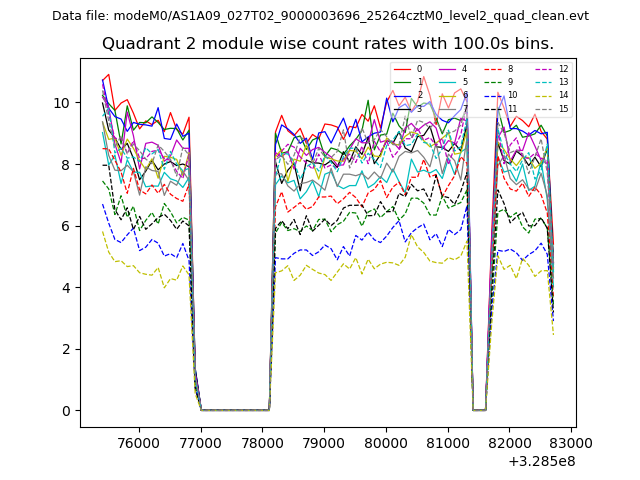
| Module-wise count rates for Quadrant B Data is divided into 100 sec bins |
 |
 |
| Module-wise count rates for Quadrant C Data is divided into 100 sec bins |
 |
 |
| Module-wise count rates for Quadrant D Data is divided into 100 sec bins |
 |
 |
| Parameter | Plot |
|---|---|
| CZT HV Monitor | 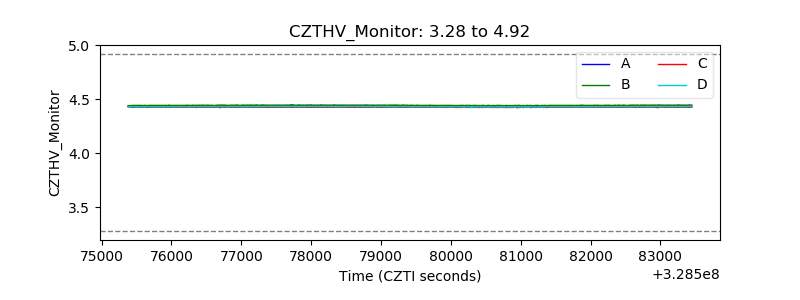 |
| D_VDD | 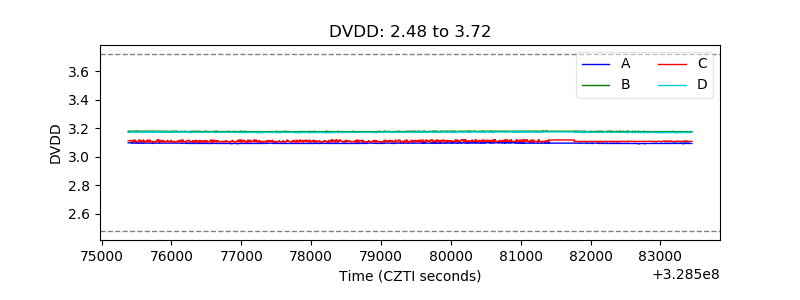 |
| Temperature 1 | 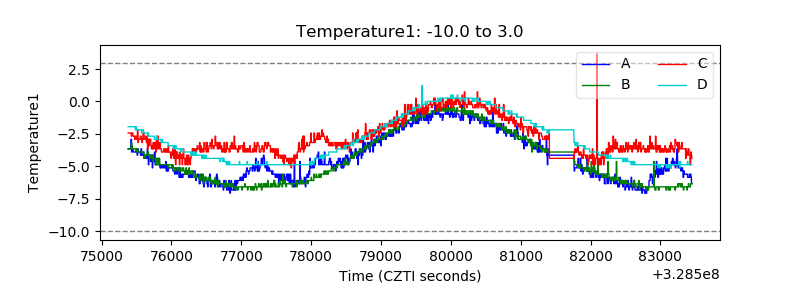 |
| Veto HV Monitor | 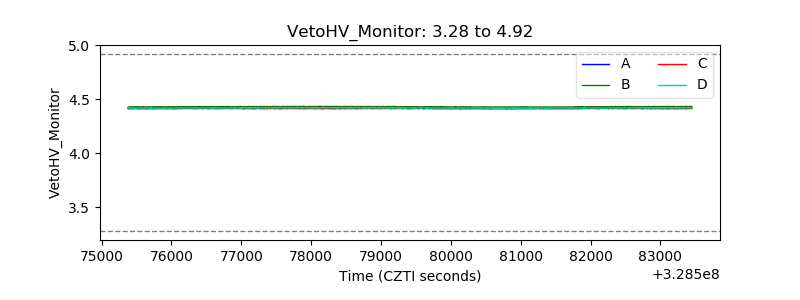 |
| Veto LLD | 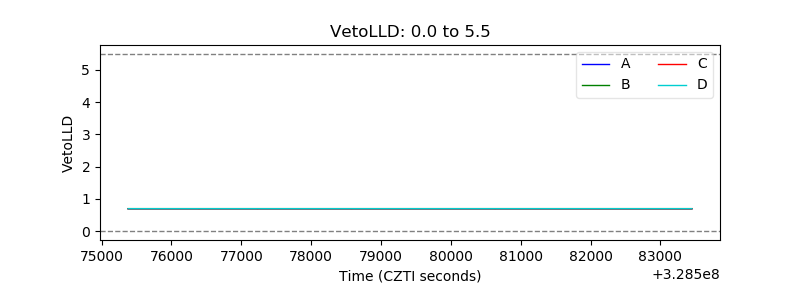 |
| Alpha Counter | 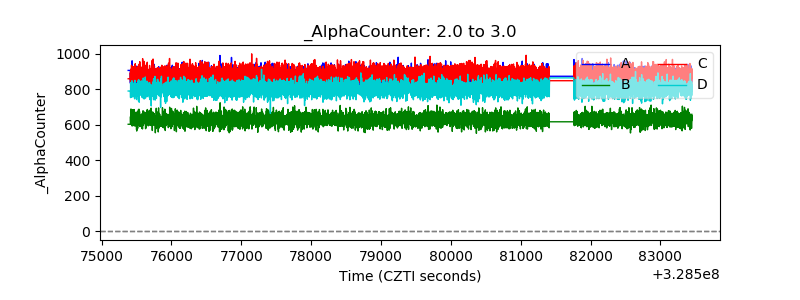 |
| _CPM_Rate | 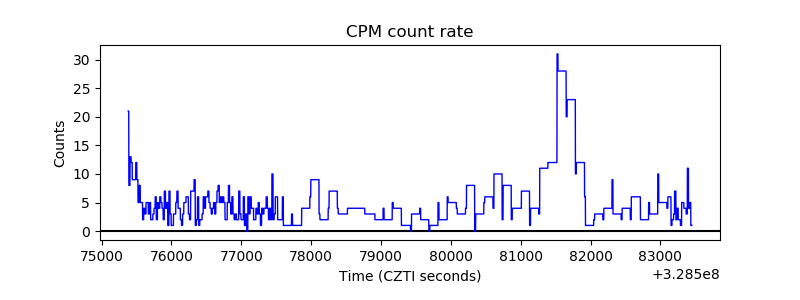 |
| CZT Counter | 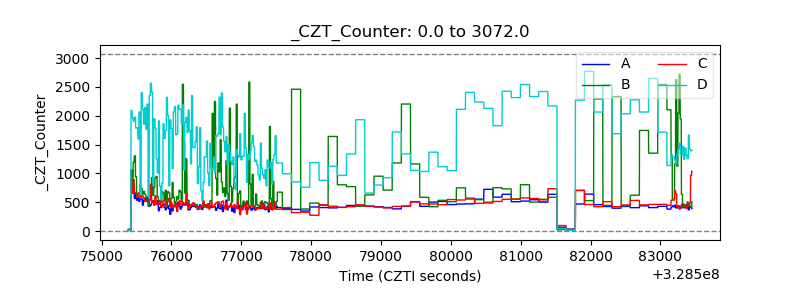 |
| +2.5 Volts monitor |  |
| +5 Volts monitor |  |
| _ROLL_ROT | 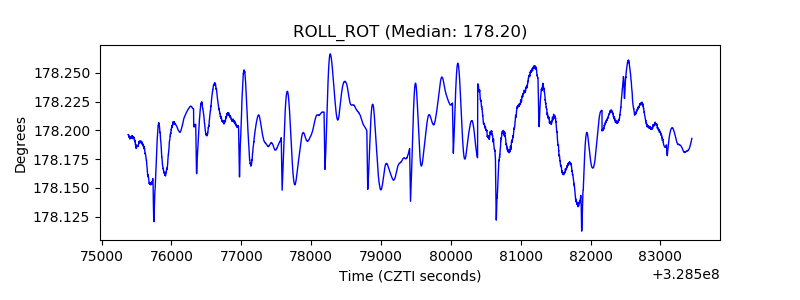 |
| _Roll_DEC | 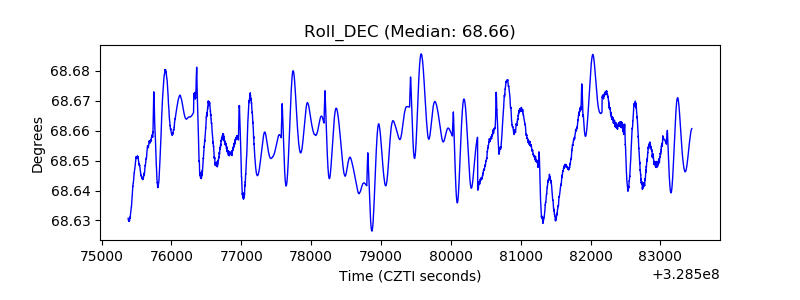 |
| _Roll_RA | 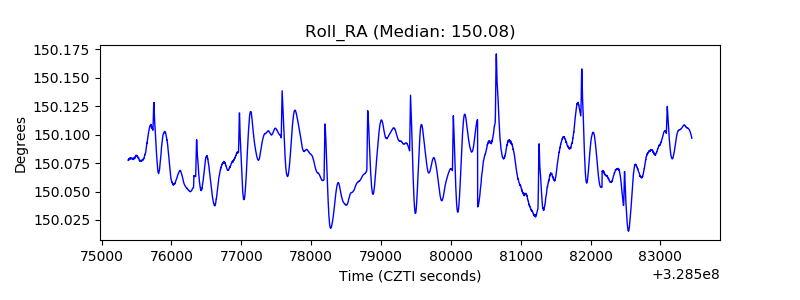 |
| Veto Counter | 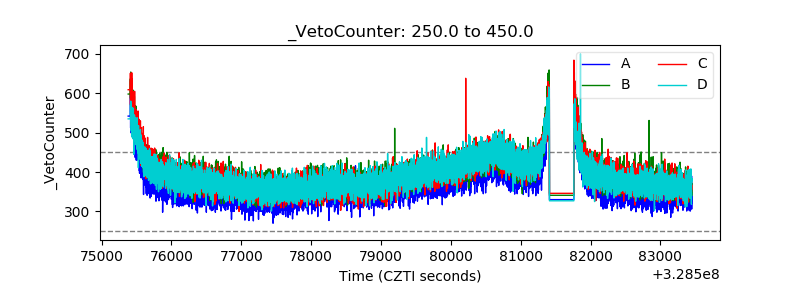 |