| Param | Original file | Final file |
|---|---|---|
| Filename | modeM0/AS1A09_027T02_9000003696_25266cztM0_level2.evt | modeM0/AS1A09_027T02_9000003696_25266cztM0_level2_quad_clean.evt |
| Size (bytes) | 954,751,680 | 93,479,040 |
| Size | 910.5 MB | 89.1 MB |
| Events in quadrant A | 3,381,540 | 642,639 |
| Events in quadrant B | 9,351,853 | 526,628 |
| Events in quadrant C | 3,816,021 | 618,870 |
| Events in quadrant D | 11,866,856 | 526,112 |
| Mode M0 | |||
|---|---|---|---|
| Quadrant | BADHDUFLAG | Total packets | Discarded packets |
| A | 0 | 15043 | 0 |
| B | 0 | 32753 | 0 |
| C | 0 | 16039 | 0 |
| D | 0 | 40452 | 0 |
| Mode M9 | |||
|---|---|---|---|
| Quadrant | BADHDUFLAG | Total packets | Discarded packets |
| A | 0 | 6 | 0 |
| B | 0 | 6 | 0 |
| C | 0 | 6 | 0 |
| D | 0 | 6 | 0 |
| Quadrant | Total seconds | Saturated seconds | Saturation percentage |
|---|---|---|---|
| A | 7406 | 57 | 0.769646% |
| B | 7407 | 2764 | 37.316052% |
| C | 7407 | 157 | 2.119617% |
| D | 7407 | 1799 | 24.287836% |
Noise dominated data is calculated using 1-second bins in cleaned event files. If a bin has >2000 counts, and if more than 50% of those come from <1% of pixels, then it is considered to be noise-dominated and hence unusable.
| Quadrant | # 1 sec bins | Bins with >0 counts | Bins with >2000 counts | High rate bins dominated by noise | Noise dominated (total time) | Noise dominated (detector-on time) | Marked lightcurve |
|---|---|---|---|---|---|---|---|
| A | 7911 | 7407 | 0 | 0 | 0.00% | 0.00% | 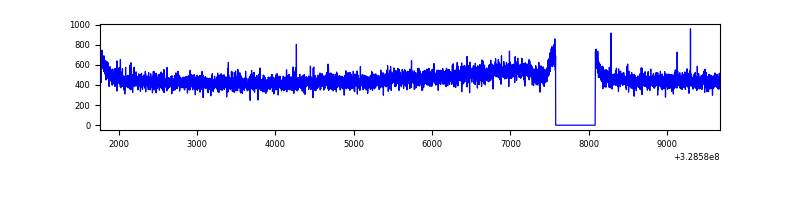 |
| B | 7912 | 7408 | 1663 | 1663 | 21.02% | 22.45% | 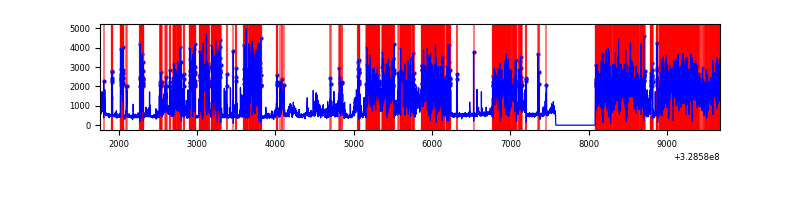 |
| C | 7912 | 7408 | 6 | 6 | 0.08% | 0.08% | 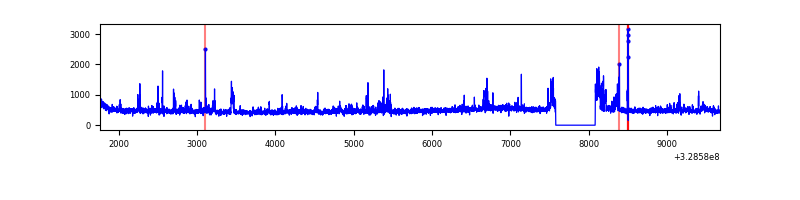 |
| D | 7912 | 7408 | 1545 | 1545 | 19.53% | 20.86% | 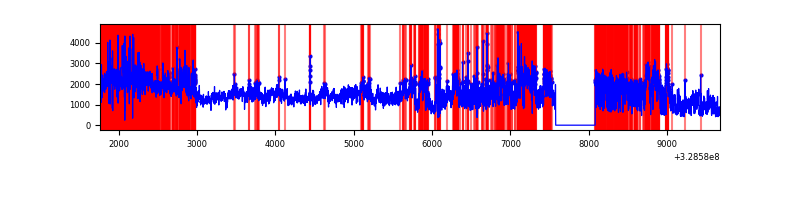 |
Top three noisy pixels from each quadrant. If the there are fewer than three noisy pixels in the level2.evt file, extra rows are filled as -1
| Pixel properties | Quadrant properties | ||||||
|---|---|---|---|---|---|---|---|
| Quadrant | DetID | PixID | Counts | Sigma | Mean | Median | Sigma |
| A | 3 | 1 | 26082 | 144.1 | 870 | 851 | 175.1 |
| A | 13 | 254 | 12302 | 65.4 | 870 | 851 | 175.1 |
| A | 3 | 137 | 7751 | 39.41 | 870 | 851 | 175.1 |
| B | 3 | 64 | 6511683 | 48571.01 | 711 | 692 | 134.1 |
| B | 0 | 190 | 33903 | 247.75 | 711 | 692 | 134.1 |
| B | 12 | 111 | 16502 | 117.94 | 711 | 692 | 134.1 |
| C | 0 | 207 | 188116 | 951.31 | 840 | 843 | 196.9 |
| C | 3 | 233 | 142992 | 722.09 | 840 | 843 | 196.9 |
| C | 14 | 238 | 134572 | 679.31 | 840 | 843 | 196.9 |
| D | 9 | 35 | 4122458 | 21645.7 | 784 | 759 | 190.4 |
| D | 8 | 195 | 1652271 | 8673.15 | 784 | 759 | 190.4 |
| D | 1 | 239 | 1595919 | 8377.21 | 784 | 759 | 190.4 |
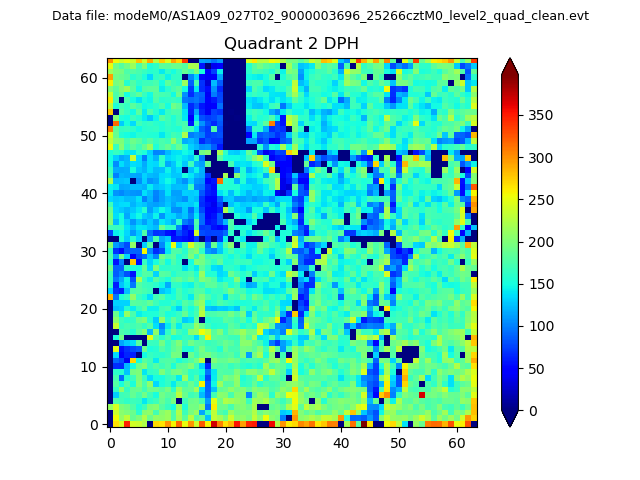
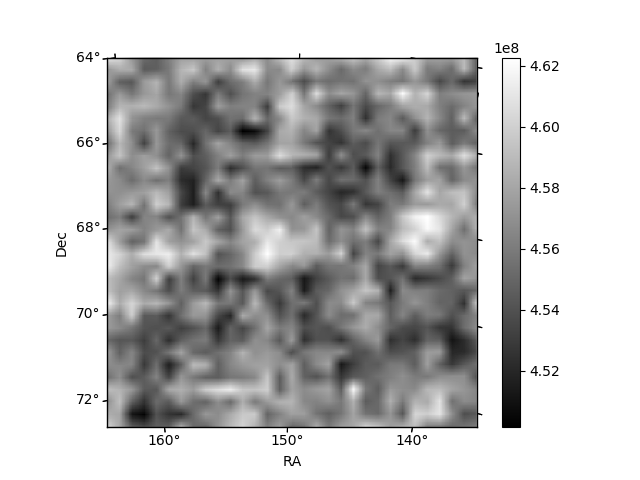
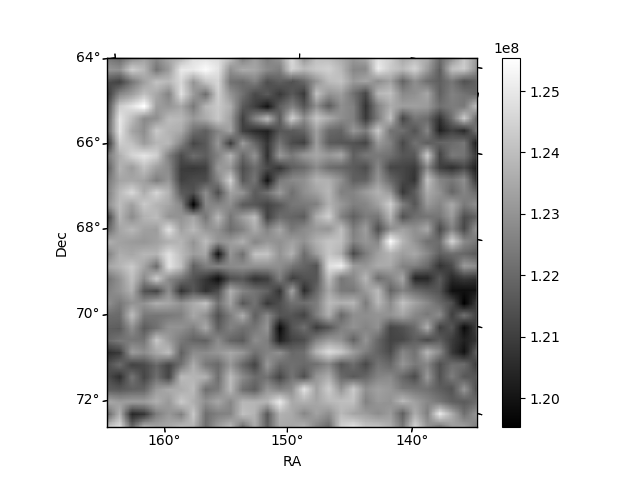
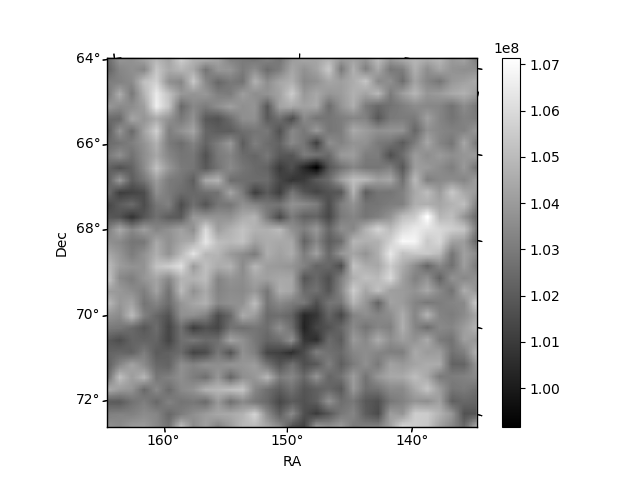
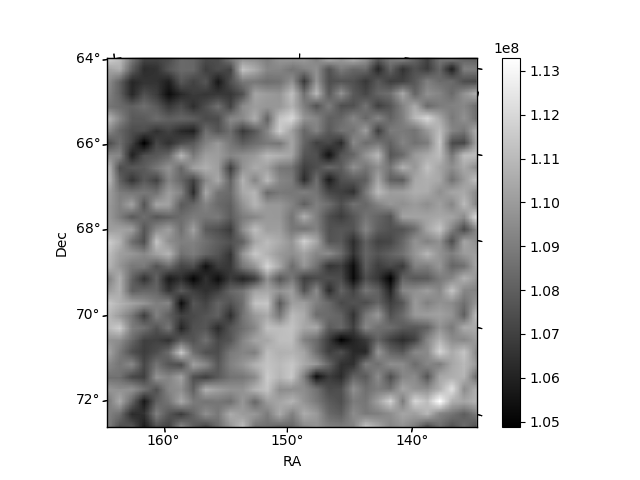
Histogram calculated using DETX and DETY for each event in the final _common_clean file
| Quadrant A | 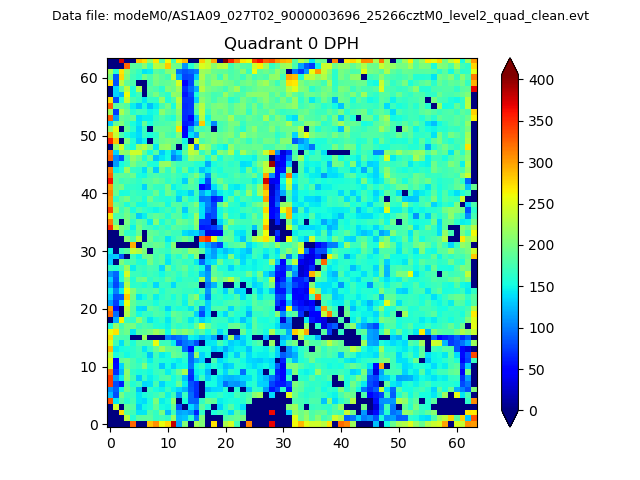 |
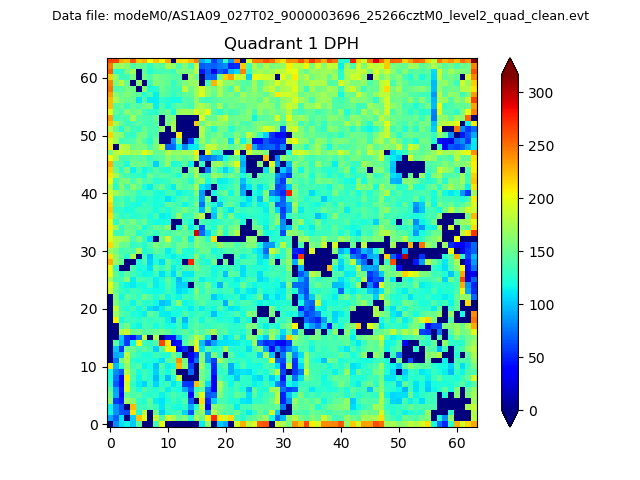 |
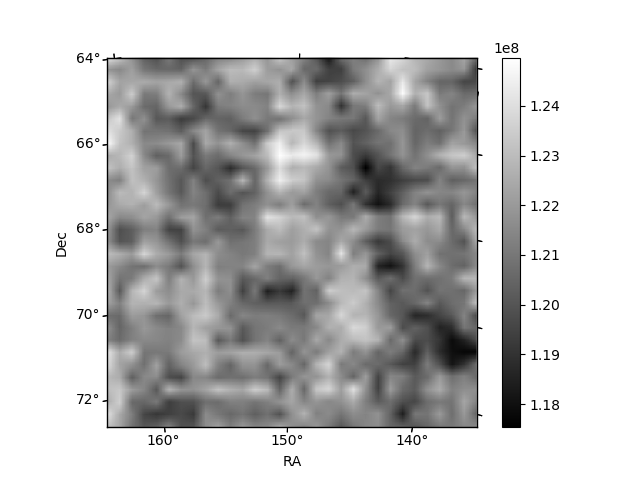
Quadrant B |
|---|---|---|---|
| Quadrant D | 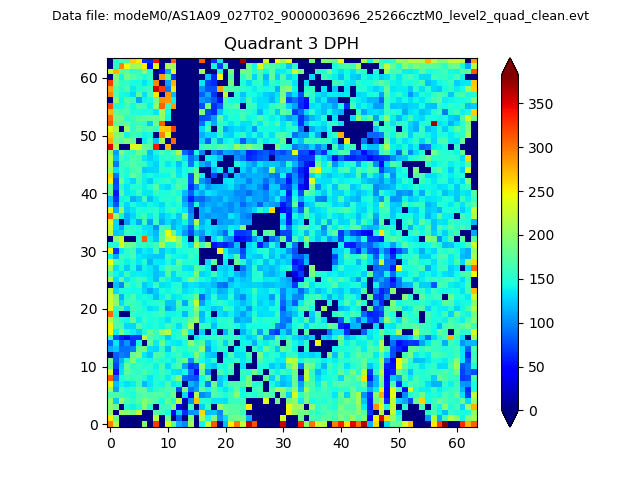 |
 |
Quadrant C |
| Plot type | Count rate plots | Images |
|---|---|---|
| Comparison with Poisson distribution Blue bars denote a histogram of data divided into 1 sec bins. Red curve is a Poisson curve with rate = median count rate of data. |
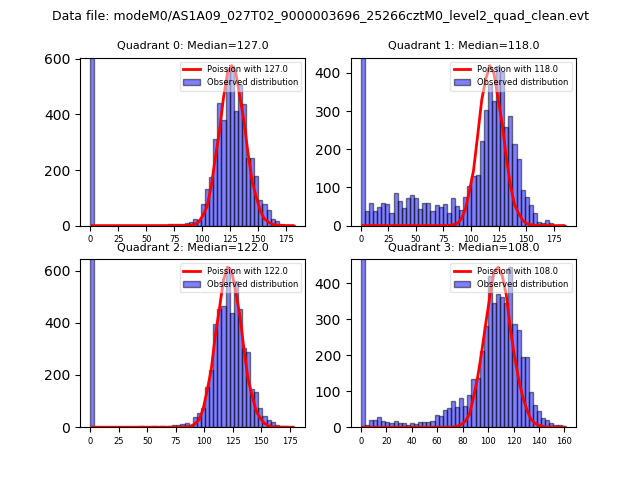 |
 |
| Quadrant-wise count rates Data is divided into 100 sec bins |
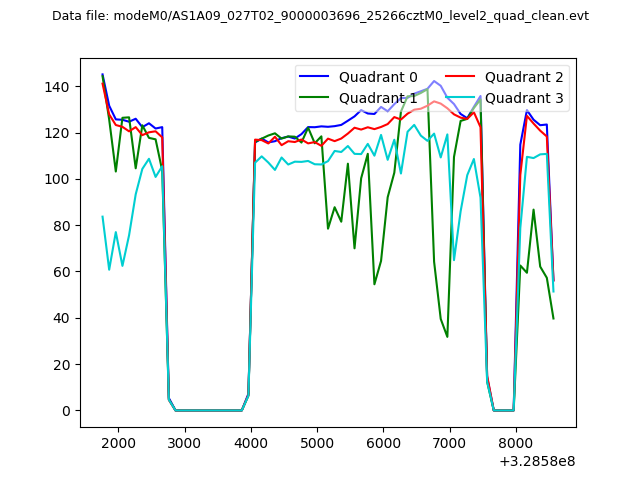 |
|
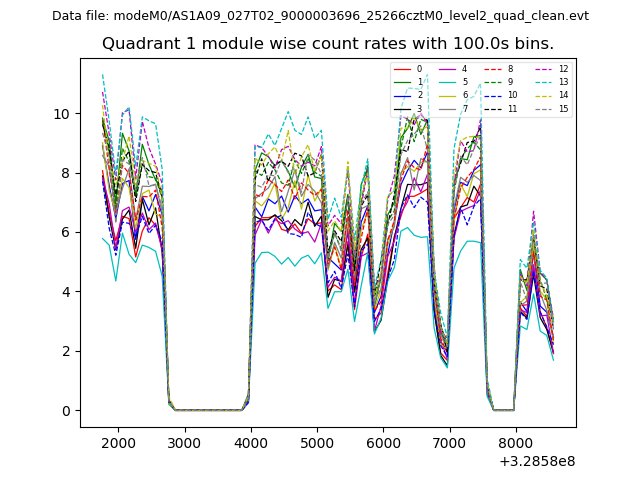
| Module-wise count rates for Quadrant A Data is divided into 100 sec bins |
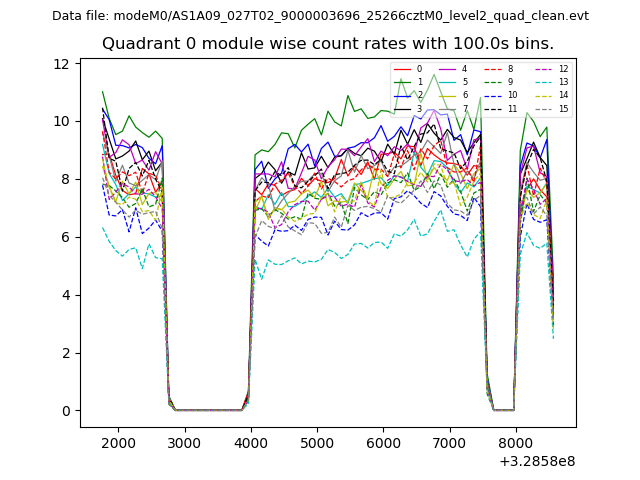 |
 |
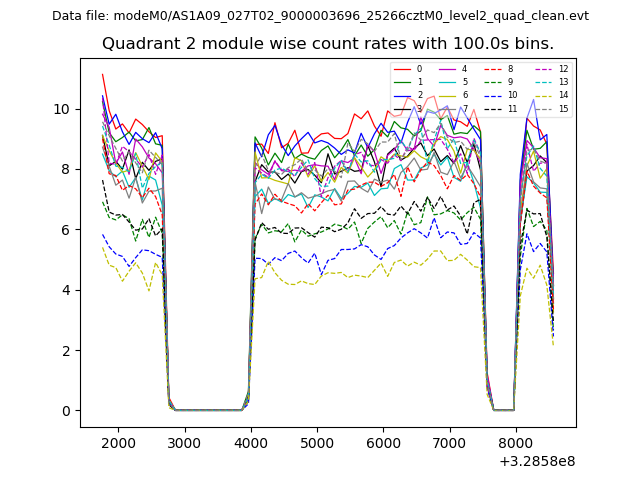
| Module-wise count rates for Quadrant B Data is divided into 100 sec bins |
 |
 |
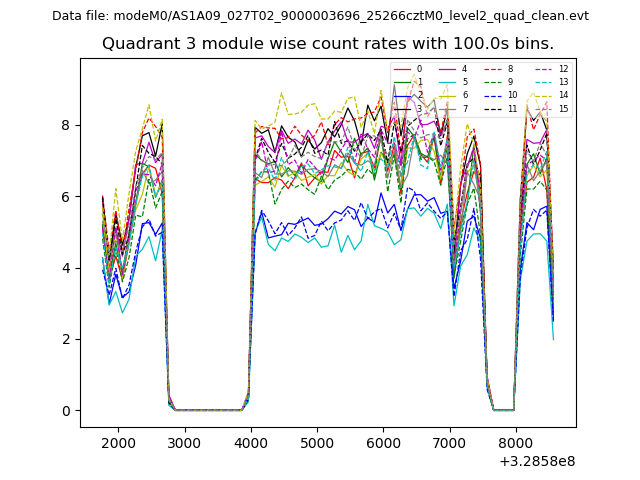
| Module-wise count rates for Quadrant C Data is divided into 100 sec bins |
 |
 |
| Module-wise count rates for Quadrant D Data is divided into 100 sec bins |
 |
 |
| Parameter | Plot |
|---|---|
| CZT HV Monitor | 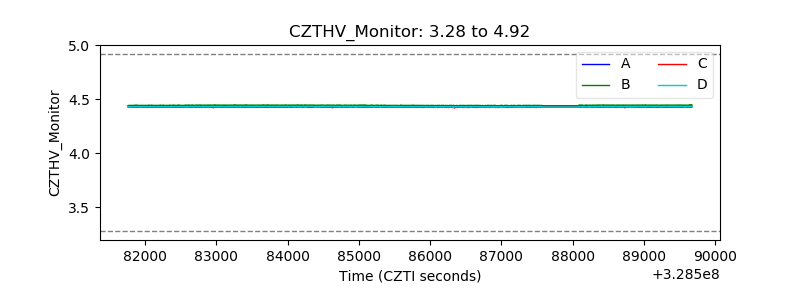 |
| D_VDD | 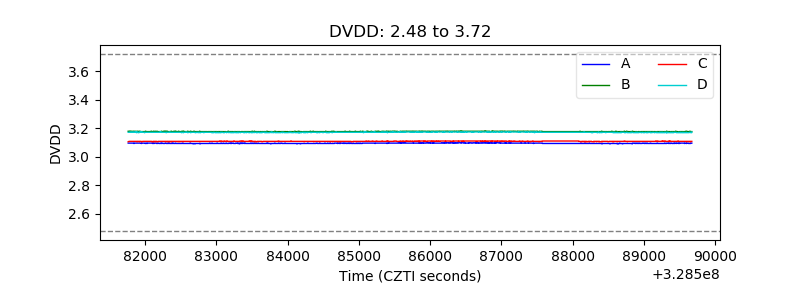 |
| Temperature 1 | 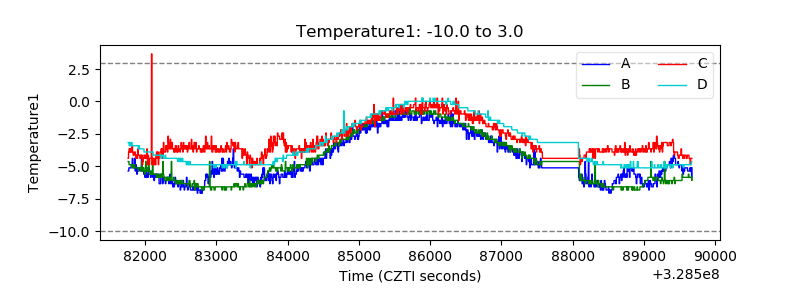 |
| Veto HV Monitor | 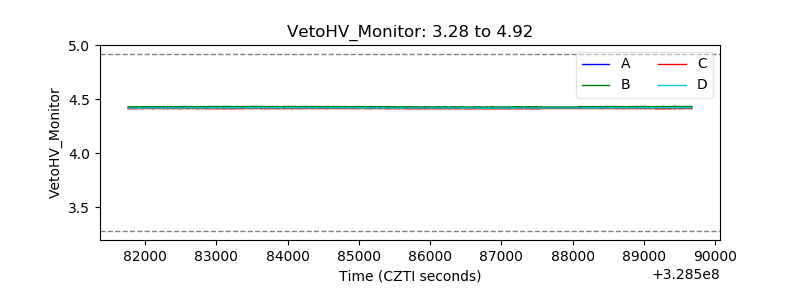 |
| Veto LLD | 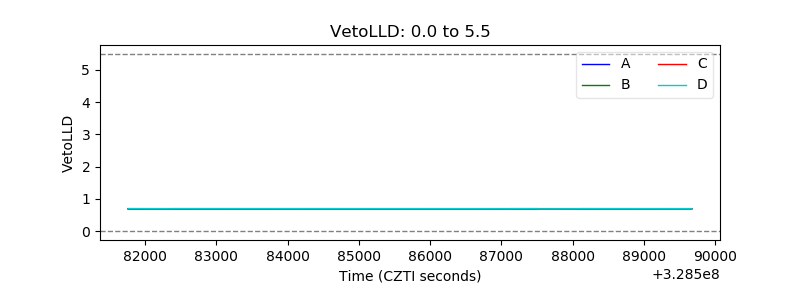 |
| Alpha Counter | 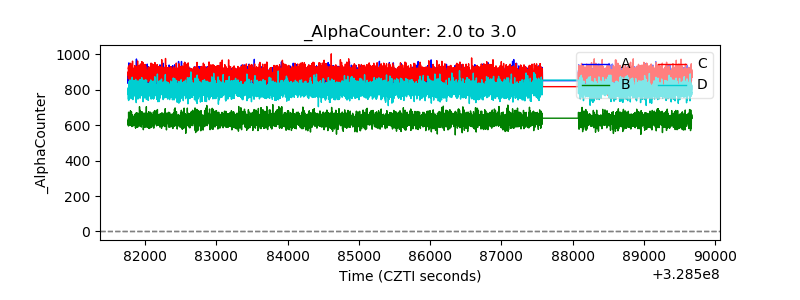 |
| _CPM_Rate | 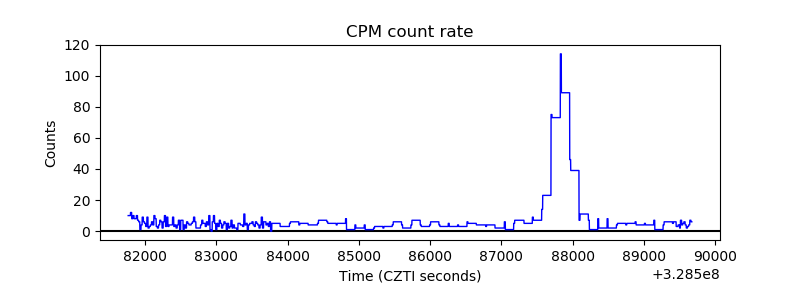 |
| CZT Counter | 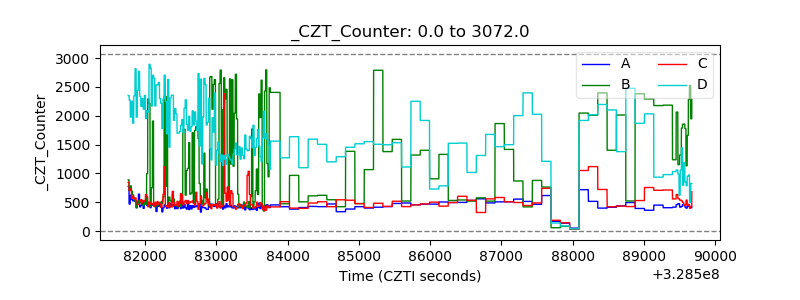 |
| +2.5 Volts monitor |  |
| +5 Volts monitor |  |
| _ROLL_ROT | 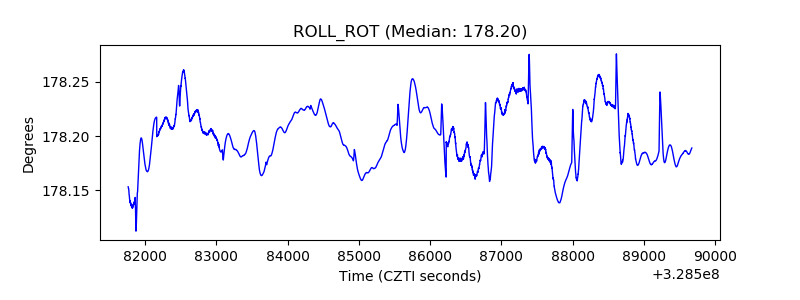 |
| _Roll_DEC | 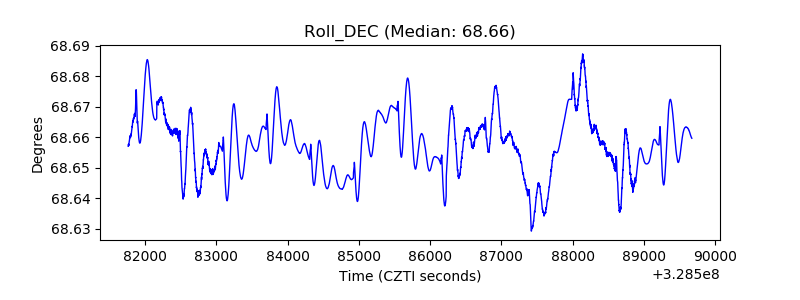 |
| _Roll_RA | 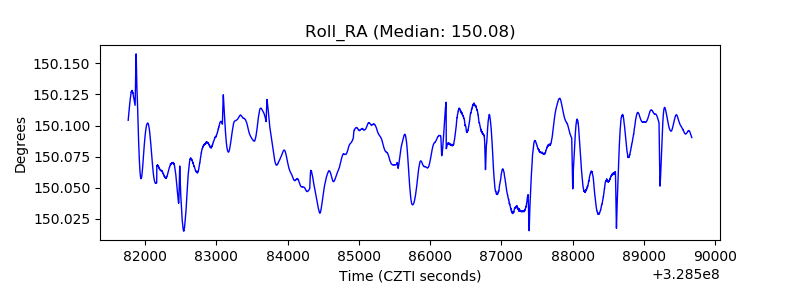 |
| Veto Counter | 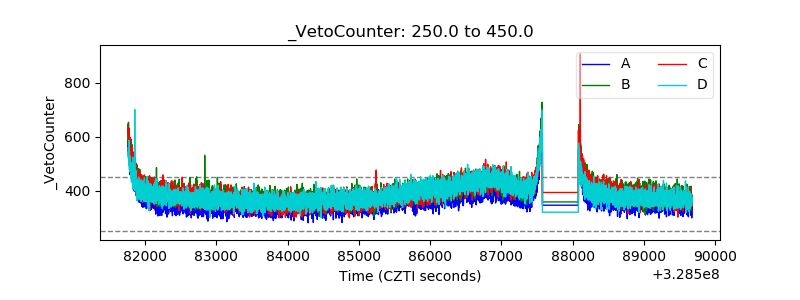 |