| Param | Original file | Final file |
|---|---|---|
| Filename | modeM0/AS1A09_027T02_9000003696_25267cztM0_level2.evt | modeM0/AS1A09_027T02_9000003696_25267cztM0_level2_quad_clean.evt |
| Size (bytes) | 1,186,640,640 | 159,252,480 |
| Size | 1.1 GB | 151.9 MB |
| Events in quadrant A | 5,374,951 | 1,066,293 |
| Events in quadrant B | 11,645,185 | 964,406 |
| Events in quadrant C | 5,762,352 | 1,026,775 |
| Events in quadrant D | 12,366,049 | 954,911 |
| Mode M0 | |||
|---|---|---|---|
| Quadrant | BADHDUFLAG | Total packets | Discarded packets |
| A | 0 | 23631 | 0 |
| B | 0 | 42368 | 0 |
| C | 0 | 24547 | 0 |
| D | 0 | 45042 | 0 |
| Mode M9 | |||
|---|---|---|---|
| Quadrant | BADHDUFLAG | Total packets | Discarded packets |
| A | 0 | 16 | 0 |
| B | 0 | 16 | 0 |
| C | 0 | 16 | 0 |
| D | 0 | 16 | 0 |
| Quadrant | Total seconds | Saturated seconds | Saturation percentage |
|---|---|---|---|
| A | 11705 | 67 | 0.572405% |
| B | 11705 | 2657 | 22.699701% |
| C | 11705 | 150 | 1.281504% |
| D | 11705 | 987 | 8.432294% |
Noise dominated data is calculated using 1-second bins in cleaned event files. If a bin has >2000 counts, and if more than 50% of those come from <1% of pixels, then it is considered to be noise-dominated and hence unusable.
| Quadrant | # 1 sec bins | Bins with >0 counts | Bins with >2000 counts | High rate bins dominated by noise | Noise dominated (total time) | Noise dominated (detector-on time) | Marked lightcurve |
|---|---|---|---|---|---|---|---|
| A | 13325 | 11707 | 0 | 0 | 0.00% | 0.00% | 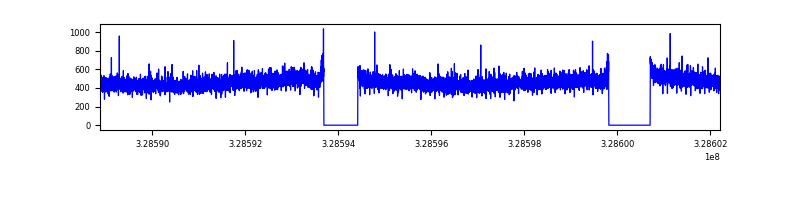 |
| B | 13325 | 11706 | 1568 | 1568 | 11.77% | 13.39% | 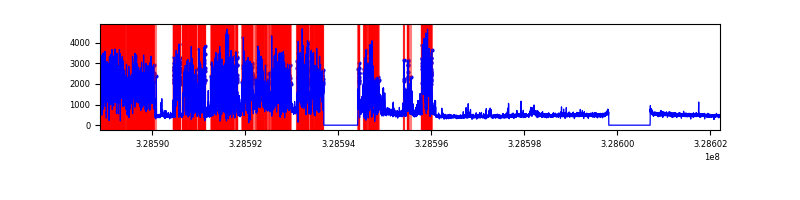 |
| C | 13325 | 11707 | 14 | 14 | 0.11% | 0.12% | 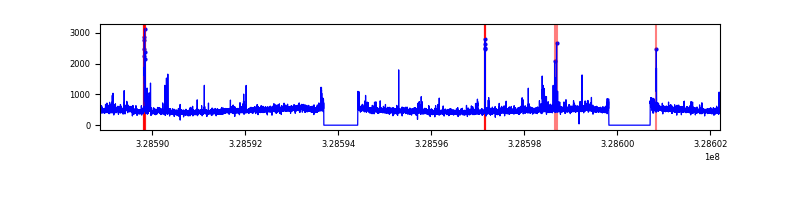 |
| D | 13325 | 11707 | 766 | 766 | 5.75% | 6.54% | 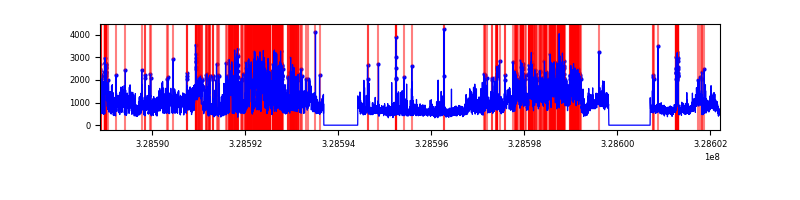 |
Top three noisy pixels from each quadrant. If the there are fewer than three noisy pixels in the level2.evt file, extra rows are filled as -1
| Pixel properties | Quadrant properties | ||||||
|---|---|---|---|---|---|---|---|
| Quadrant | DetID | PixID | Counts | Sigma | Mean | Median | Sigma |
| A | 13 | 254 | 19717 | 65.08 | 1390 | 1358 | 282.1 |
| A | 3 | 1 | 14499 | 46.58 | 1390 | 1358 | 282.1 |
| A | 3 | 137 | 12395 | 39.12 | 1390 | 1358 | 282.1 |
| B | 3 | 64 | 6593973 | 28030.53 | 1245 | 1212 | 235.2 |
| B | 0 | 190 | 76549 | 320.31 | 1245 | 1212 | 235.2 |
| B | 0 | 186 | 50363 | 208.98 | 1245 | 1212 | 235.2 |
| C | 14 | 238 | 209632 | 674.95 | 1324 | 1331 | 308.6 |
| C | 9 | 54 | 122209 | 391.68 | 1324 | 1331 | 308.6 |
| C | 3 | 233 | 118179 | 378.62 | 1324 | 1331 | 308.6 |
| D | 1 | 52 | 2600482 | 8147.33 | 1318 | 1280 | 319.0 |
| D | 8 | 195 | 2566779 | 8041.69 | 1318 | 1280 | 319.0 |
| D | 9 | 35 | 1836312 | 5752.0 | 1318 | 1280 | 319.0 |
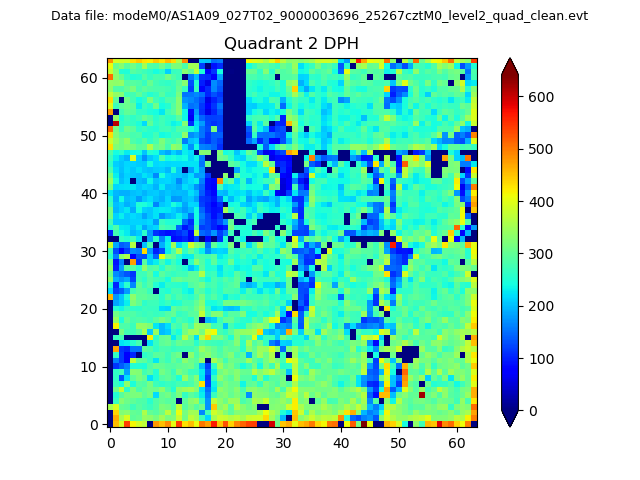
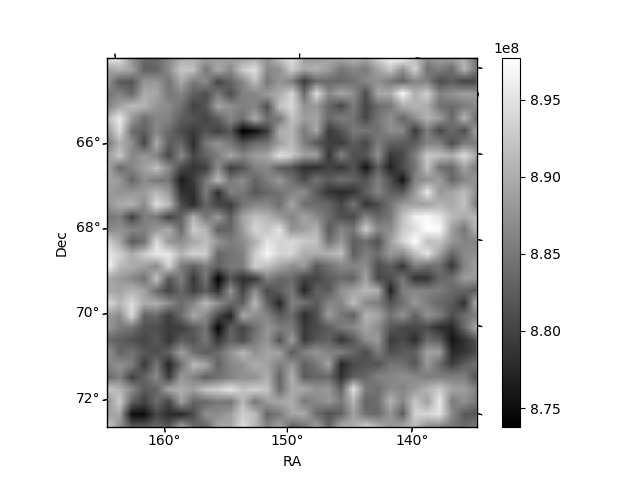
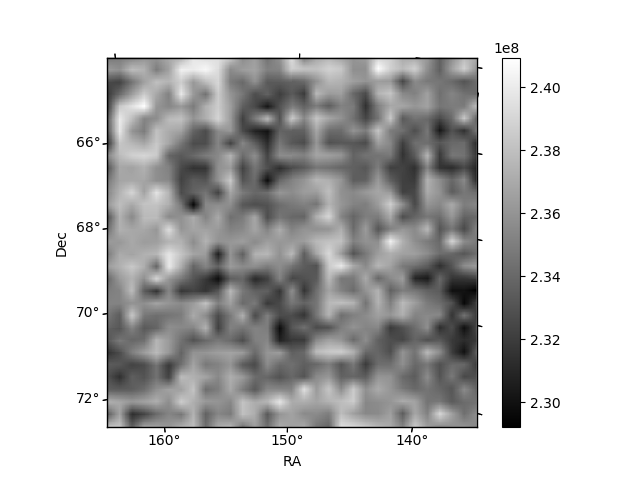
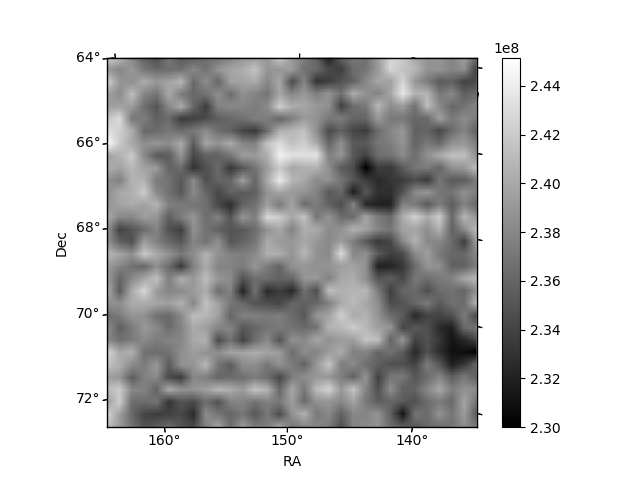
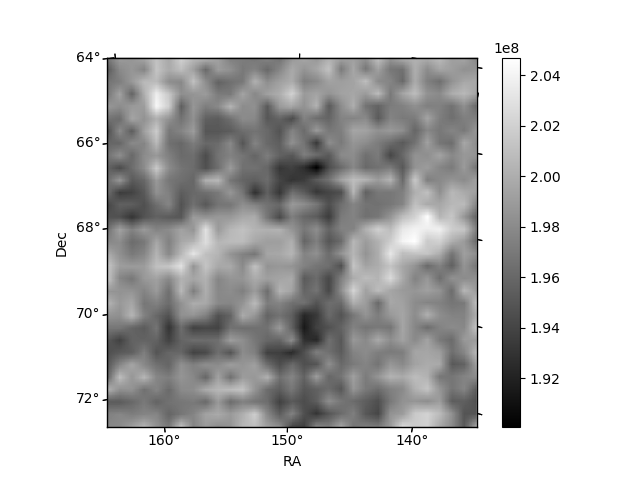
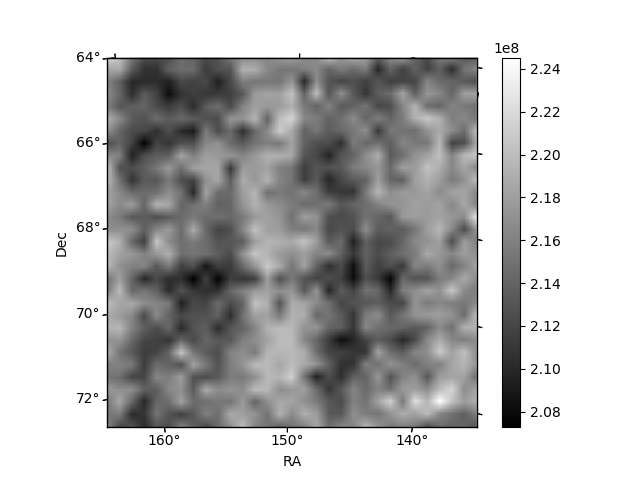
Histogram calculated using DETX and DETY for each event in the final _common_clean file
| Quadrant A | 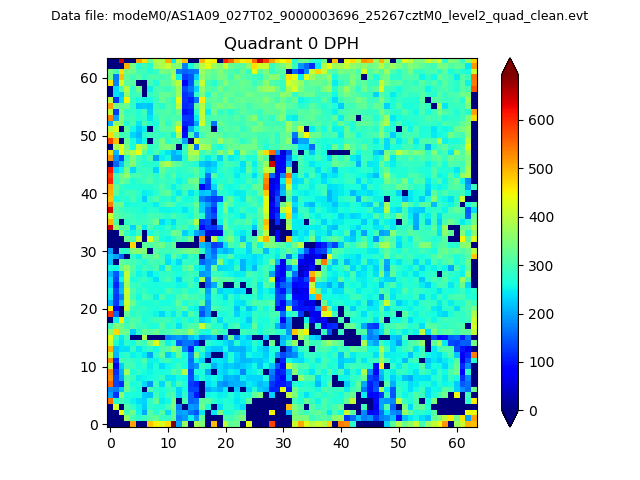 |
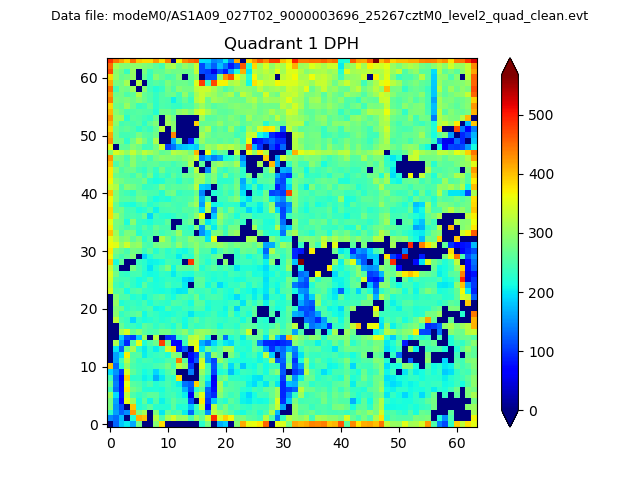 |
Quadrant B |
|---|---|---|---|
| Quadrant D | 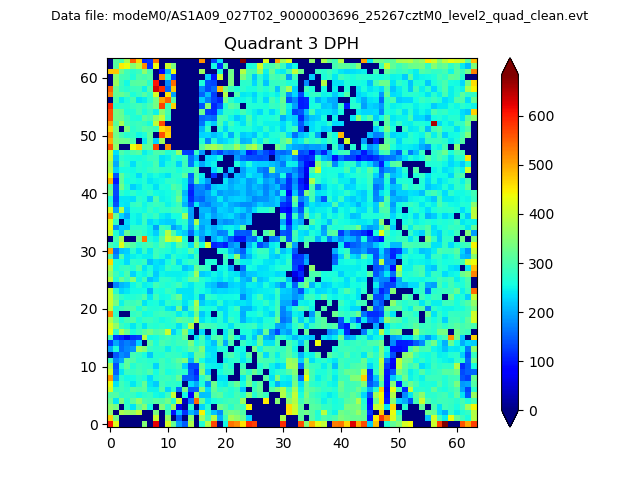 |
 |
Quadrant C |
| Plot type | Count rate plots | Images |
|---|---|---|
| Comparison with Poisson distribution Blue bars denote a histogram of data divided into 1 sec bins. Red curve is a Poisson curve with rate = median count rate of data. |
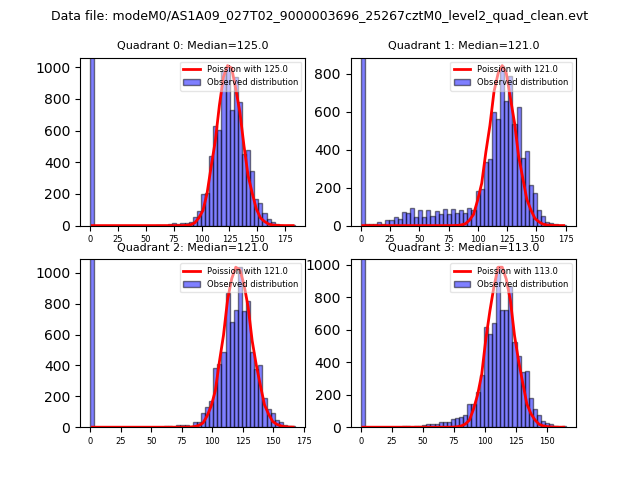 |
 |
| Quadrant-wise count rates Data is divided into 100 sec bins |
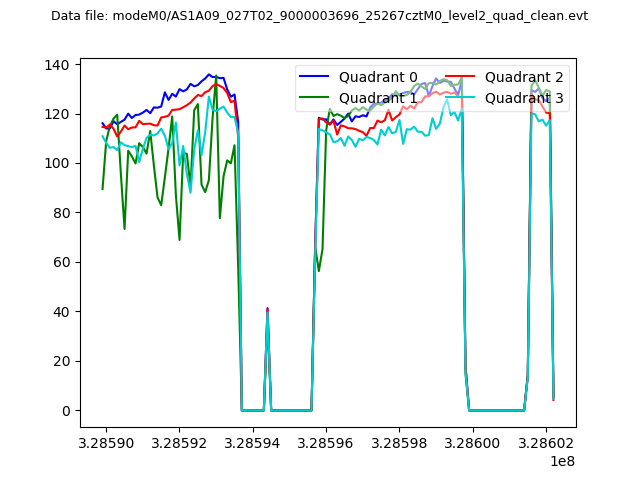 |
|
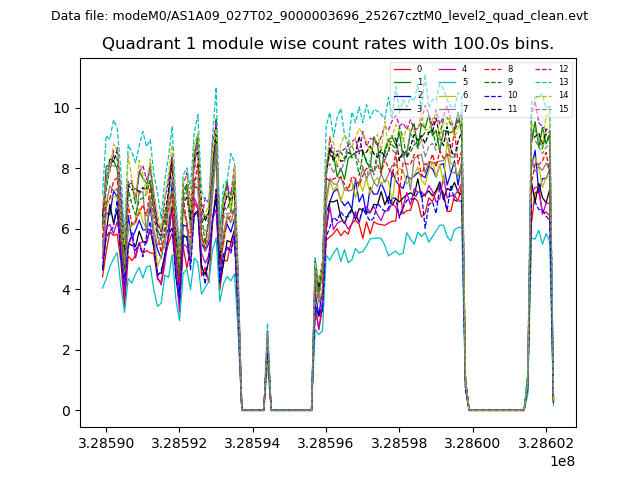
| Module-wise count rates for Quadrant A Data is divided into 100 sec bins |
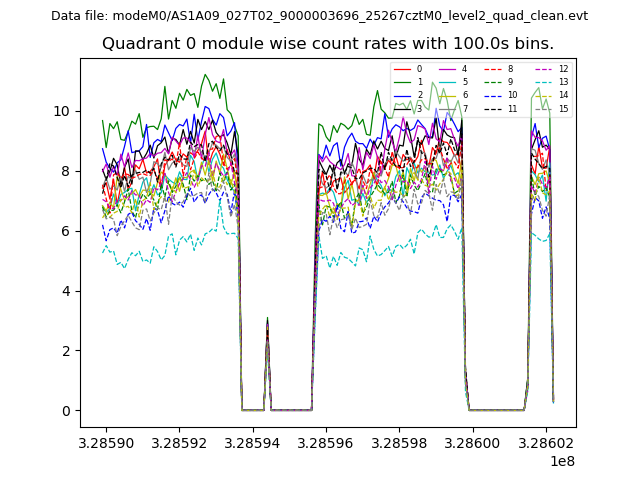 |
 |
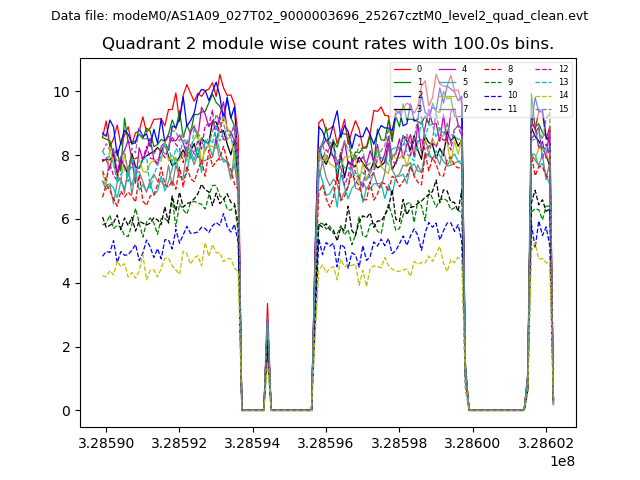
| Module-wise count rates for Quadrant B Data is divided into 100 sec bins |
 |
 |
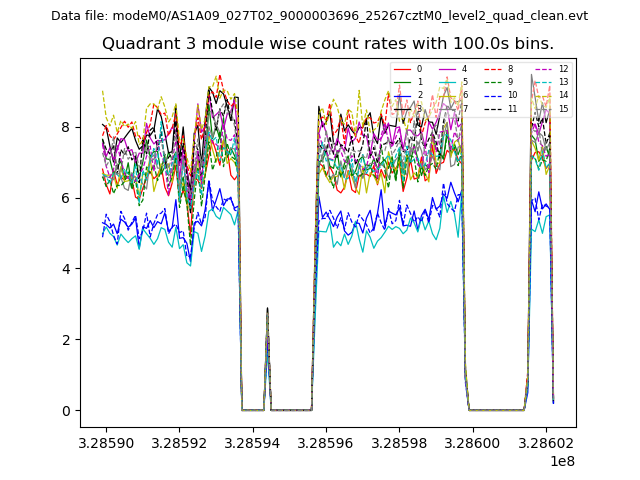
| Module-wise count rates for Quadrant C Data is divided into 100 sec bins |
 |
 |
| Module-wise count rates for Quadrant D Data is divided into 100 sec bins |
 |
 |
| Parameter | Plot |
|---|---|
| CZT HV Monitor | 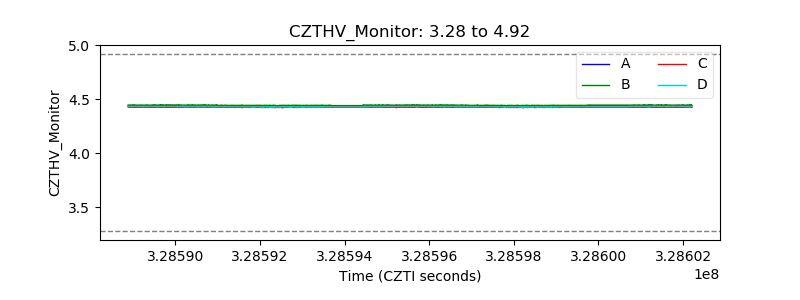 |
| D_VDD | 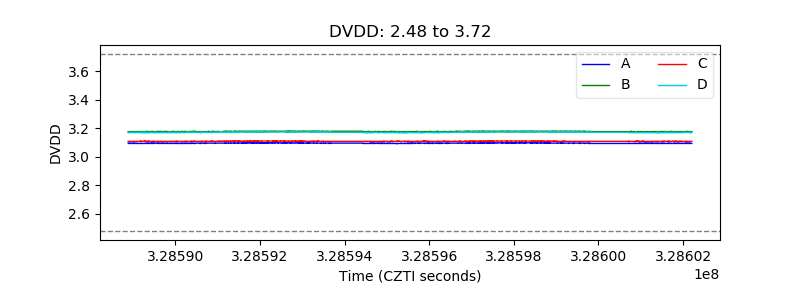 |
| Temperature 1 | 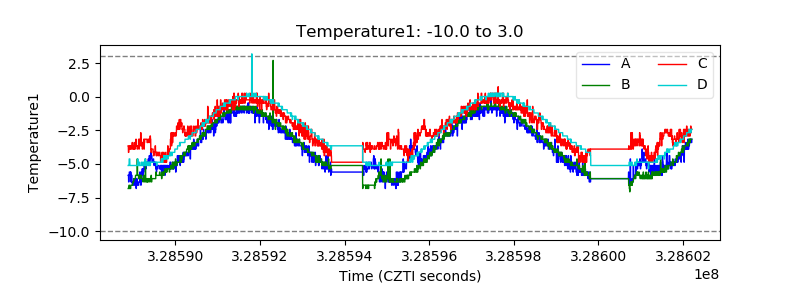 |
| Veto HV Monitor | 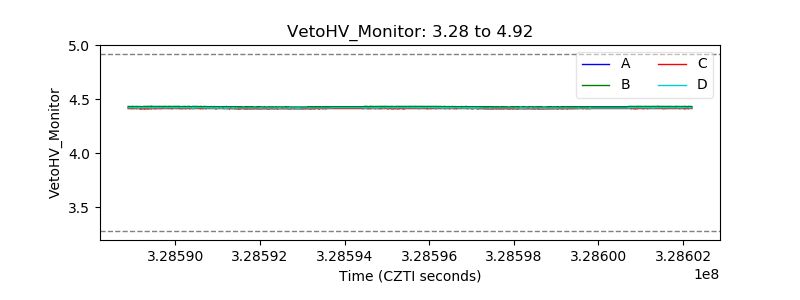 |
| Veto LLD | 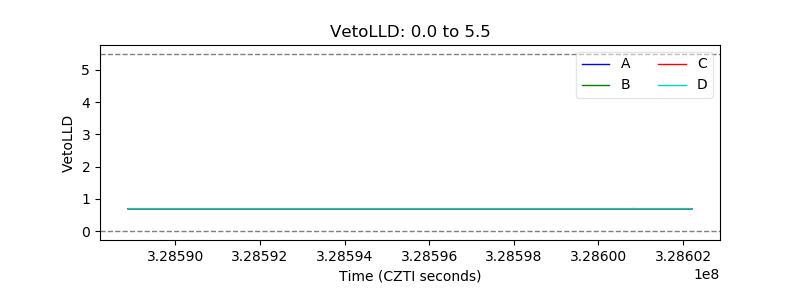 |
| Alpha Counter | 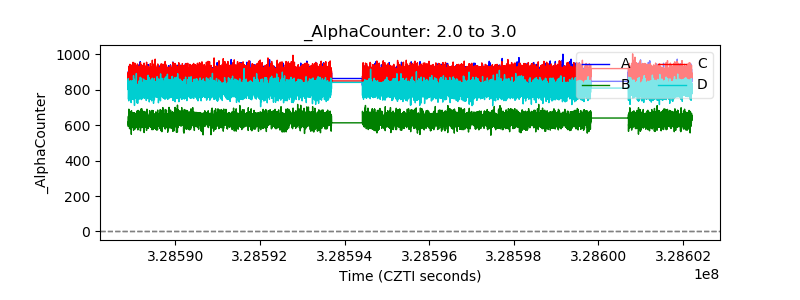 |
| _CPM_Rate | 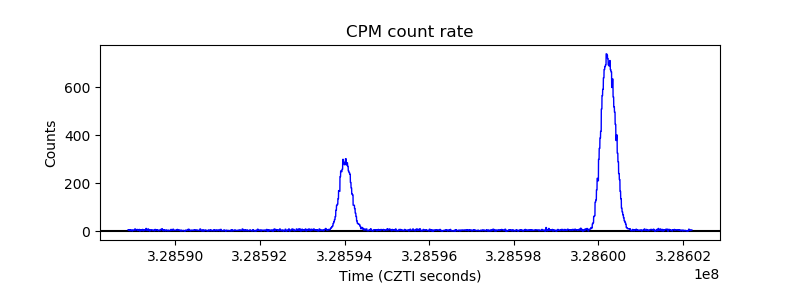 |
| CZT Counter | 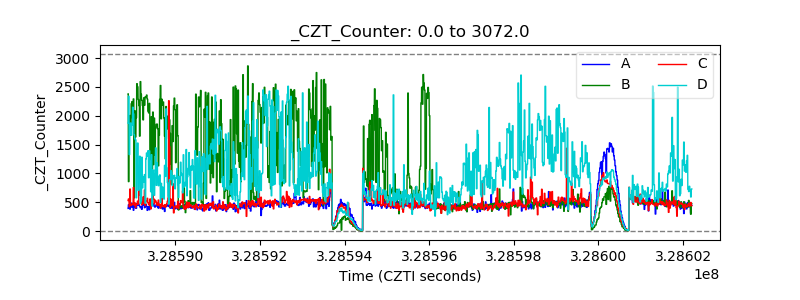 |
| +2.5 Volts monitor |  |
| +5 Volts monitor |  |
| _ROLL_ROT | 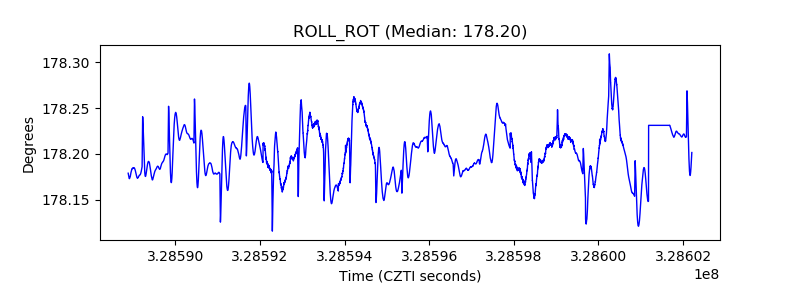 |
| _Roll_DEC | 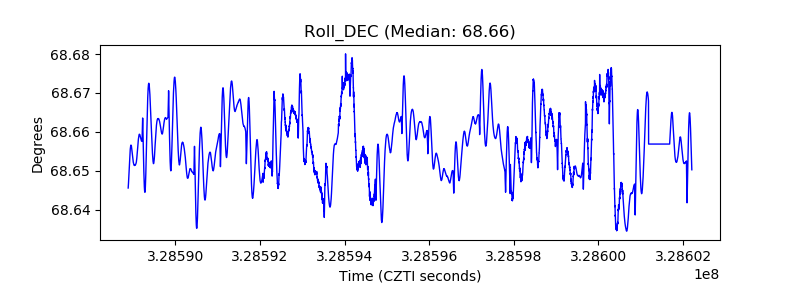 |
| _Roll_RA | 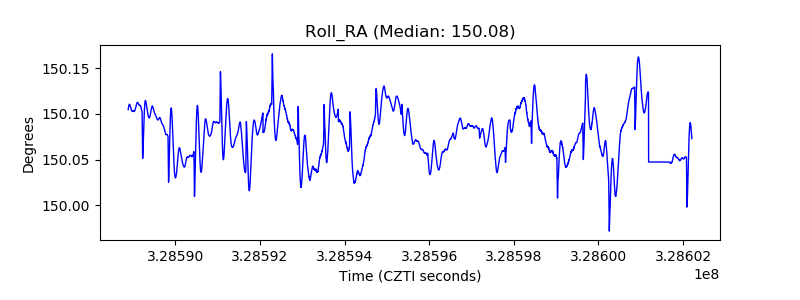 |
| Veto Counter | 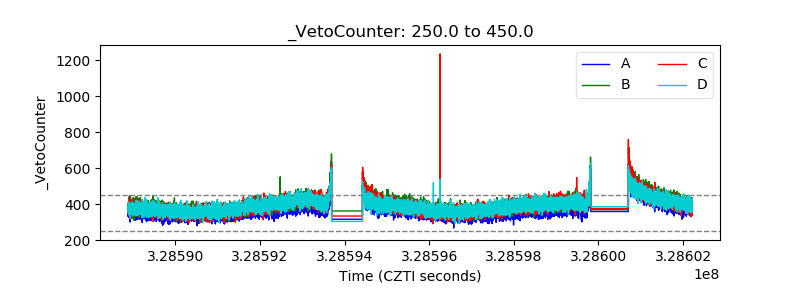 |