| Param | Original file | Final file |
|---|---|---|
| Filename | modeM0/AS1A09_027T02_9000003696_25268cztM0_level2.evt | modeM0/AS1A09_027T02_9000003696_25268cztM0_level2_quad_clean.evt |
| Size (bytes) | 558,751,680 | 104,065,920 |
| Size | 532.9 MB | 99.2 MB |
| Events in quadrant A | 3,177,623 | 695,468 |
| Events in quadrant B | 3,281,908 | 698,112 |
| Events in quadrant C | 3,417,008 | 660,330 |
| Events in quadrant D | 6,595,727 | 634,737 |
| Mode M0 | |||
|---|---|---|---|
| Quadrant | BADHDUFLAG | Total packets | Discarded packets |
| A | 0 | 13649 | 0 |
| B | 0 | 13864 | 0 |
| C | 0 | 14230 | 0 |
| D | 0 | 24355 | 0 |
| Mode M9 | |||
|---|---|---|---|
| Quadrant | BADHDUFLAG | Total packets | Discarded packets |
| A | 0 | 12 | 0 |
| B | 0 | 13 | 0 |
| C | 0 | 13 | 0 |
| D | 0 | 13 | 0 |
| Quadrant | Total seconds | Saturated seconds | Saturation percentage |
|---|---|---|---|
| A | 6642 | 34 | 0.511894% |
| B | 6642 | 45 | 0.677507% |
| C | 6642 | 68 | 1.023788% |
| D | 6642 | 203 | 3.056308% |
Noise dominated data is calculated using 1-second bins in cleaned event files. If a bin has >2000 counts, and if more than 50% of those come from <1% of pixels, then it is considered to be noise-dominated and hence unusable.
| Quadrant | # 1 sec bins | Bins with >0 counts | Bins with >2000 counts | High rate bins dominated by noise | Noise dominated (total time) | Noise dominated (detector-on time) | Marked lightcurve |
|---|---|---|---|---|---|---|---|
| A | 7682 | 6643 | 0 | 0 | 0.00% | 0.00% | 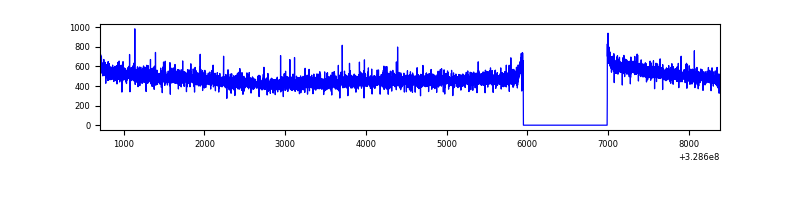 |
| B | 7682 | 6643 | 2 | 2 | 0.03% | 0.03% | 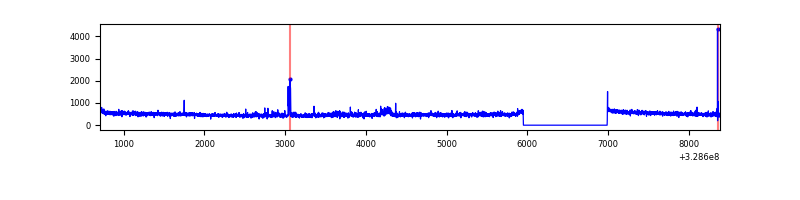 |
| C | 7682 | 6643 | 8 | 8 | 0.10% | 0.12% | 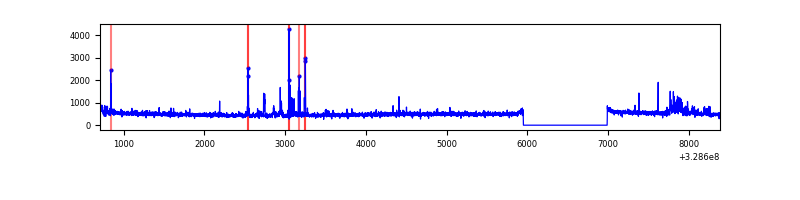 |
| D | 7682 | 6643 | 172 | 172 | 2.24% | 2.59% | 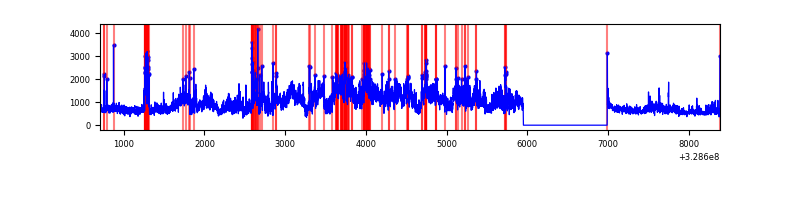 |
Top three noisy pixels from each quadrant. If the there are fewer than three noisy pixels in the level2.evt file, extra rows are filled as -1
| Pixel properties | Quadrant properties | ||||||
|---|---|---|---|---|---|---|---|
| Quadrant | DetID | PixID | Counts | Sigma | Mean | Median | Sigma |
| A | 13 | 254 | 10756 | 60.53 | 822 | 804 | 164.4 |
| A | 0 | 226 | 7227 | 39.07 | 822 | 804 | 164.4 |
| A | 3 | 137 | 7179 | 38.77 | 822 | 804 | 164.4 |
| B | 0 | 190 | 53828 | 341.17 | 811 | 789 | 155.5 |
| B | 15 | 33 | 30859 | 193.42 | 811 | 789 | 155.5 |
| B | 12 | 111 | 18541 | 114.19 | 811 | 789 | 155.5 |
| C | 14 | 238 | 125092 | 692.15 | 774 | 778 | 179.6 |
| C | 0 | 207 | 103258 | 570.58 | 774 | 778 | 179.6 |
| C | 9 | 54 | 82894 | 457.2 | 774 | 778 | 179.6 |
| D | 8 | 195 | 2029766 | 10769.21 | 784 | 761 | 188.4 |
| D | 1 | 52 | 1293204 | 6859.81 | 784 | 761 | 188.4 |
| D | 1 | 239 | 139819 | 738.07 | 784 | 761 | 188.4 |
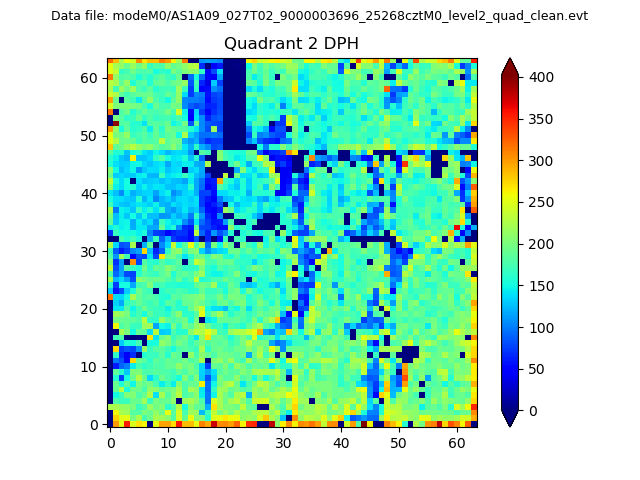
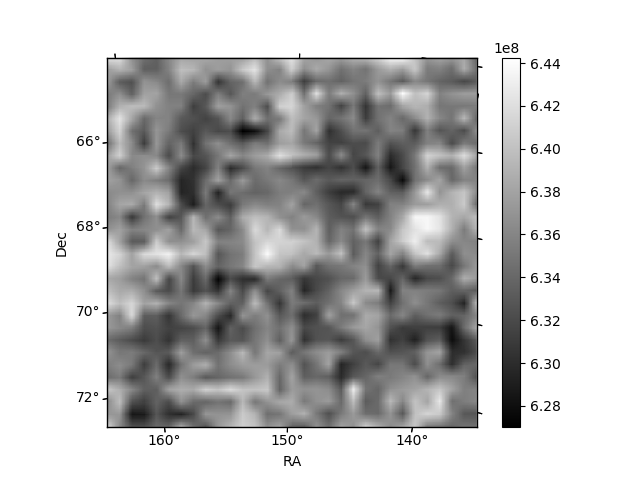
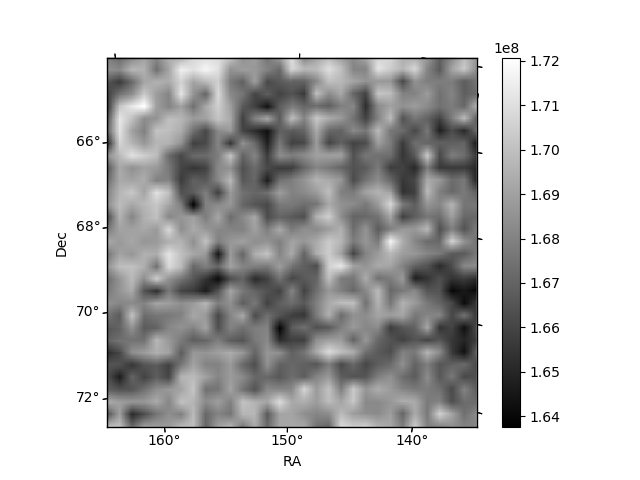
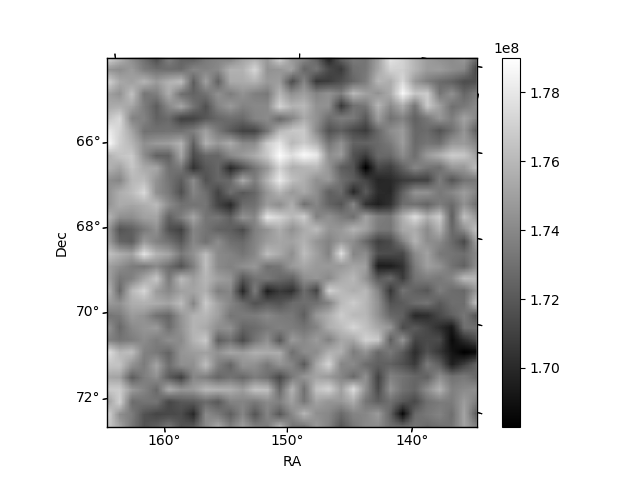
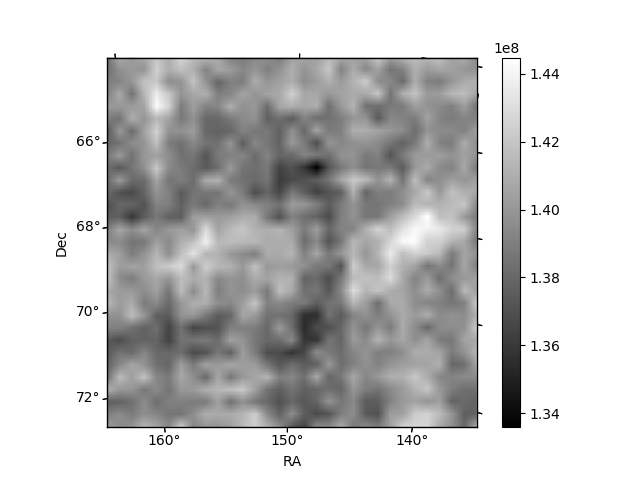
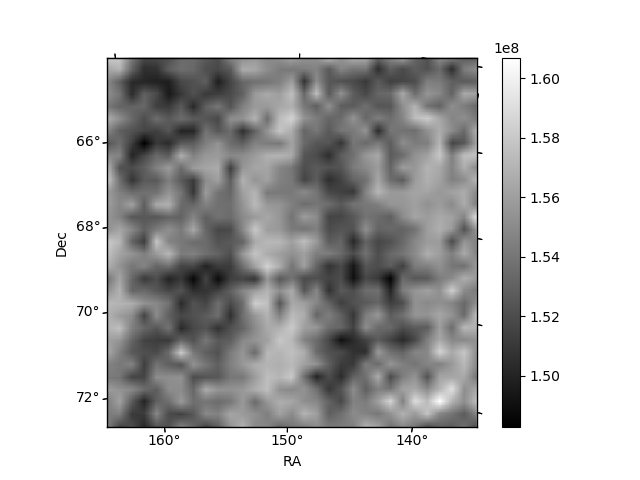
Histogram calculated using DETX and DETY for each event in the final _common_clean file
| Quadrant A | 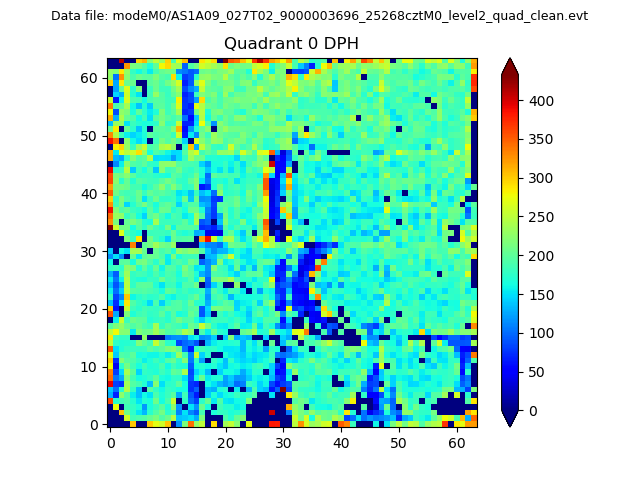 |
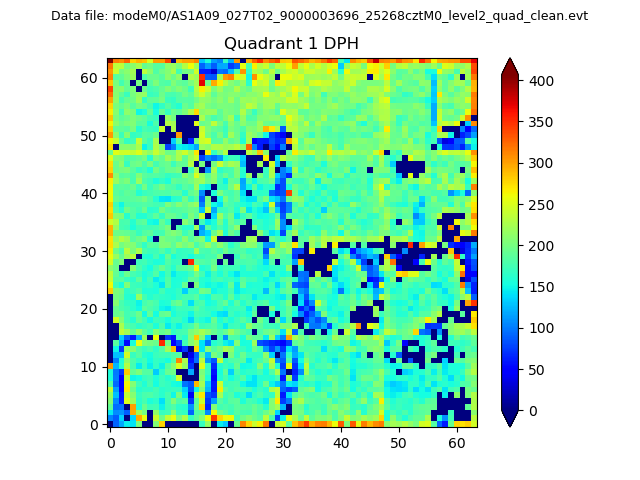 |
Quadrant B |
|---|---|---|---|
| Quadrant D | 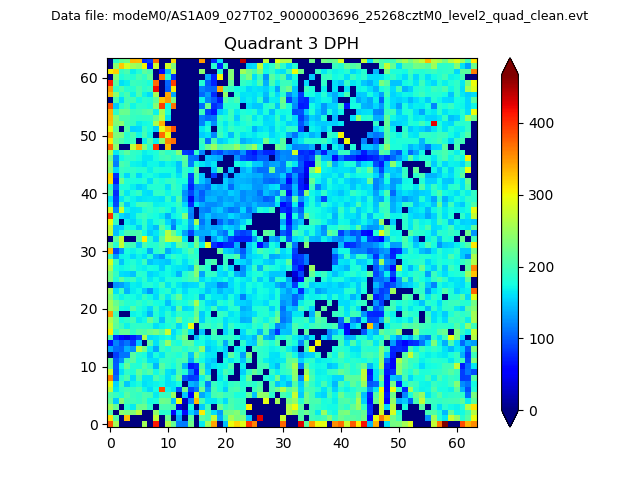 |
 |
Quadrant C |
| Plot type | Count rate plots | Images |
|---|---|---|
| Comparison with Poisson distribution Blue bars denote a histogram of data divided into 1 sec bins. Red curve is a Poisson curve with rate = median count rate of data. |
 |
 |
| Quadrant-wise count rates Data is divided into 100 sec bins |
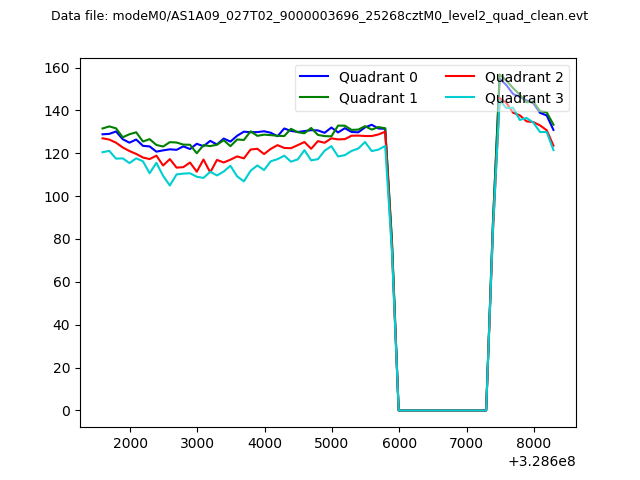 |
|
| Module-wise count rates for Quadrant A Data is divided into 100 sec bins |
 |
 |
| Module-wise count rates for Quadrant B Data is divided into 100 sec bins |
 |
 |
| Module-wise count rates for Quadrant C Data is divided into 100 sec bins |
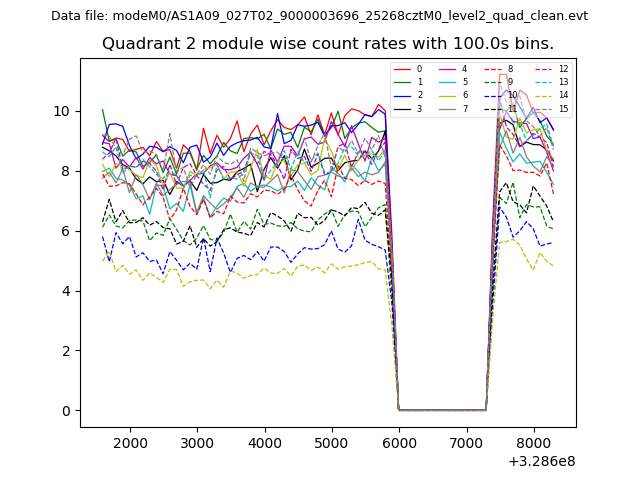 |
 |
| Module-wise count rates for Quadrant D Data is divided into 100 sec bins |
 |
 |
| Parameter | Plot |
|---|---|
| CZT HV Monitor | 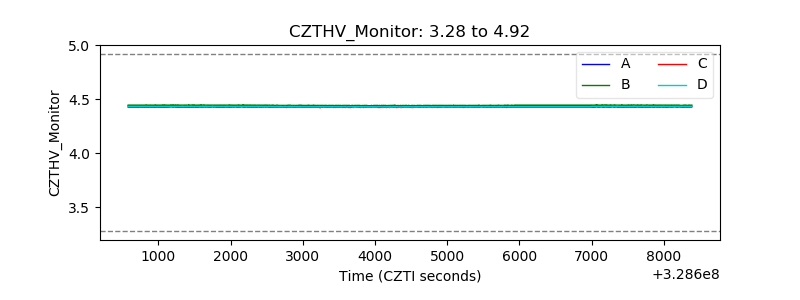 |
| D_VDD | 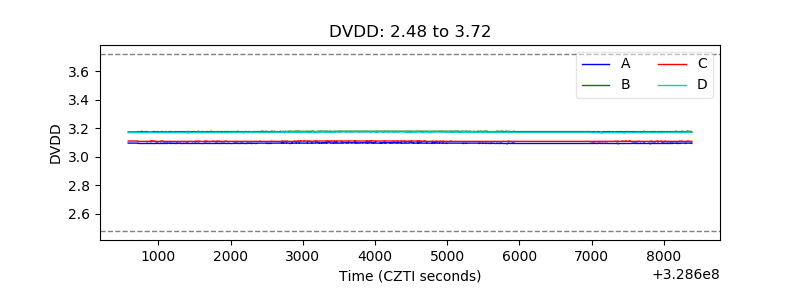 |
| Temperature 1 | 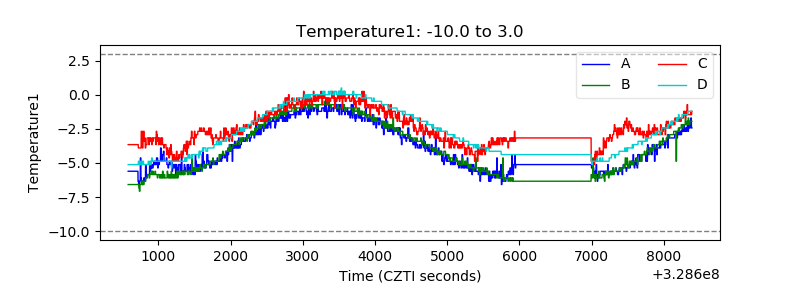 |
| Veto HV Monitor |  |
| Veto LLD | 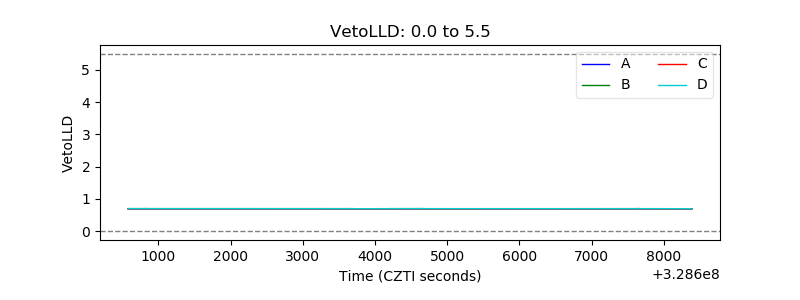 |
| Alpha Counter | 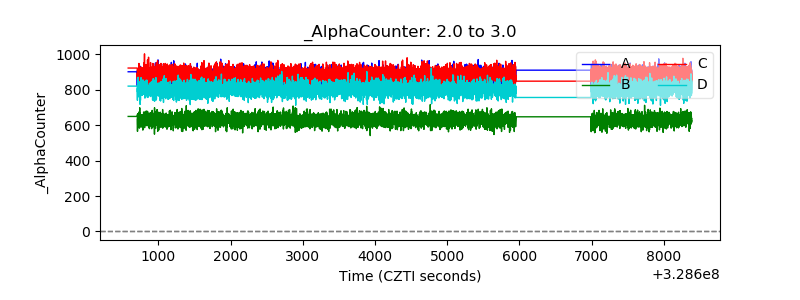 |
| _CPM_Rate | 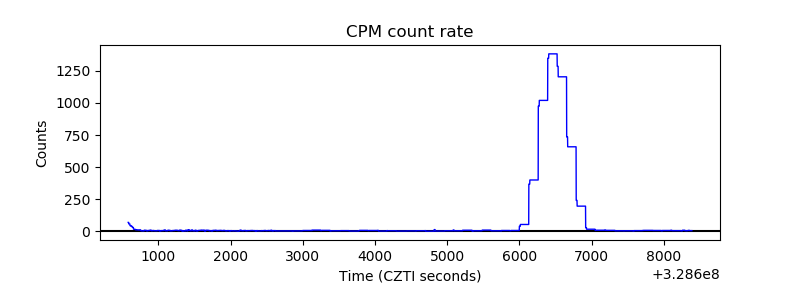 |
| CZT Counter |  |
| +2.5 Volts monitor |  |
| +5 Volts monitor |  |
| _ROLL_ROT | 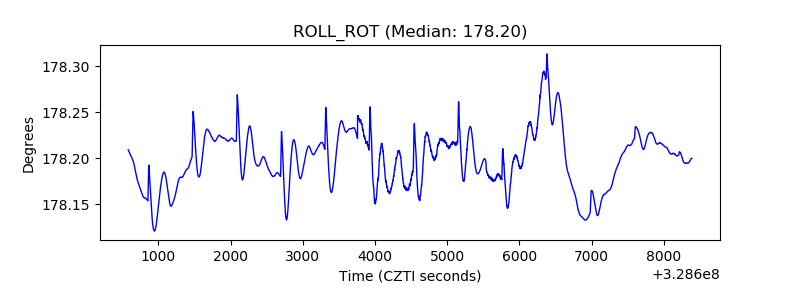 |
| _Roll_DEC |  |
| _Roll_RA | 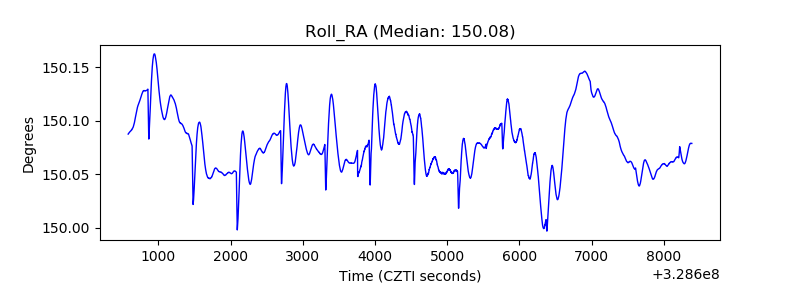 |
| Veto Counter |  |