| Param | Original file | Final file |
|---|---|---|
| Filename | modeM0/AS1A09_027T02_9000003696_25270cztM0_level2.evt | modeM0/AS1A09_027T02_9000003696_25270cztM0_level2_quad_clean.evt |
| Size (bytes) | 490,795,200 | 121,302,720 |
| Size | 468.1 MB | 115.7 MB |
| Events in quadrant A | 2,994,525 | 843,706 |
| Events in quadrant B | 3,230,254 | 840,521 |
| Events in quadrant C | 3,490,019 | 785,726 |
| Events in quadrant D | 4,738,968 | 781,934 |
| Mode M0 | |||
|---|---|---|---|
| Quadrant | BADHDUFLAG | Total packets | Discarded packets |
| A | 0 | 12766 | 0 |
| B | 0 | 13413 | 0 |
| C | 0 | 14338 | 0 |
| D | 0 | 18352 | 0 |
| Mode M9 | |||
|---|---|---|---|
| Quadrant | BADHDUFLAG | Total packets | Discarded packets |
| A | 0 | 11 | 0 |
| B | 0 | 11 | 0 |
| C | 0 | 11 | 0 |
| D | 0 | 11 | 0 |
| Quadrant | Total seconds | Saturated seconds | Saturation percentage |
|---|---|---|---|
| A | 6042 | 59 | 0.976498% |
| B | 6043 | 115 | 1.903028% |
| C | 6043 | 127 | 2.101605% |
| D | 6043 | 140 | 2.316730% |
Noise dominated data is calculated using 1-second bins in cleaned event files. If a bin has >2000 counts, and if more than 50% of those come from <1% of pixels, then it is considered to be noise-dominated and hence unusable.
| Quadrant | # 1 sec bins | Bins with >0 counts | Bins with >2000 counts | High rate bins dominated by noise | Noise dominated (total time) | Noise dominated (detector-on time) | Marked lightcurve |
|---|---|---|---|---|---|---|---|
| A | 7177 | 6043 | 1 | 1 | 0.01% | 0.02% | 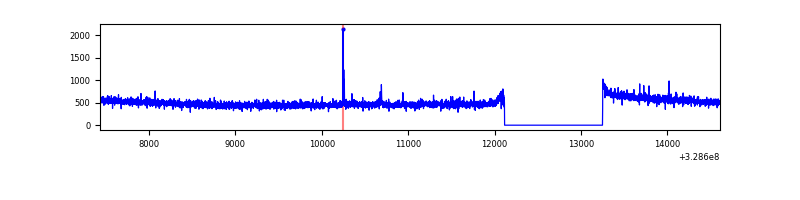 |
| B | 7178 | 6044 | 38 | 38 | 0.53% | 0.63% | 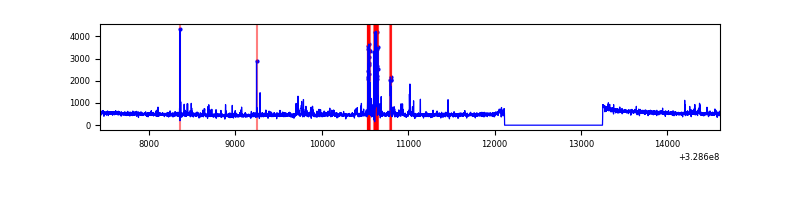 |
| C | 7178 | 6044 | 13 | 13 | 0.18% | 0.22% | 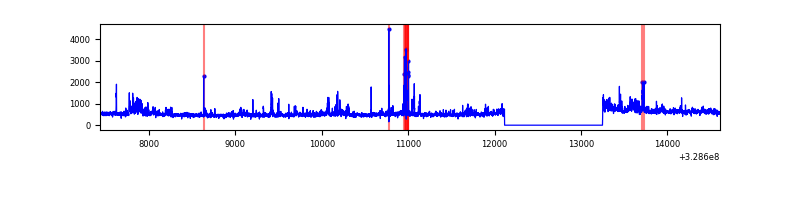 |
| D | 7178 | 6044 | 71 | 71 | 0.99% | 1.17% | 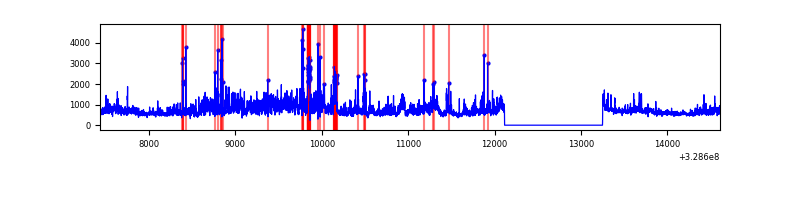 |
Top three noisy pixels from each quadrant. If the there are fewer than three noisy pixels in the level2.evt file, extra rows are filled as -1
| Pixel properties | Quadrant properties | ||||||
|---|---|---|---|---|---|---|---|
| Quadrant | DetID | PixID | Counts | Sigma | Mean | Median | Sigma |
| A | 13 | 254 | 9341 | 55.49 | 772 | 756 | 154.7 |
| A | 11 | 208 | 8298 | 48.75 | 772 | 756 | 154.7 |
| A | 7 | 16 | 7418 | 43.06 | 772 | 756 | 154.7 |
| B | 3 | 64 | 192103 | 1358.9 | 753 | 736 | 140.8 |
| B | 0 | 190 | 66986 | 470.44 | 753 | 736 | 140.8 |
| B | 12 | 111 | 16137 | 109.36 | 753 | 736 | 140.8 |
| C | 0 | 207 | 284086 | 1709.01 | 721 | 726 | 165.8 |
| C | 3 | 233 | 146622 | 879.93 | 721 | 726 | 165.8 |
| C | 14 | 238 | 117450 | 703.99 | 721 | 726 | 165.8 |
| D | 1 | 52 | 1270733 | 7075.43 | 740 | 718 | 179.5 |
| D | 8 | 195 | 460175 | 2559.7 | 740 | 718 | 179.5 |
| D | 12 | 235 | 99110 | 548.16 | 740 | 718 | 179.5 |
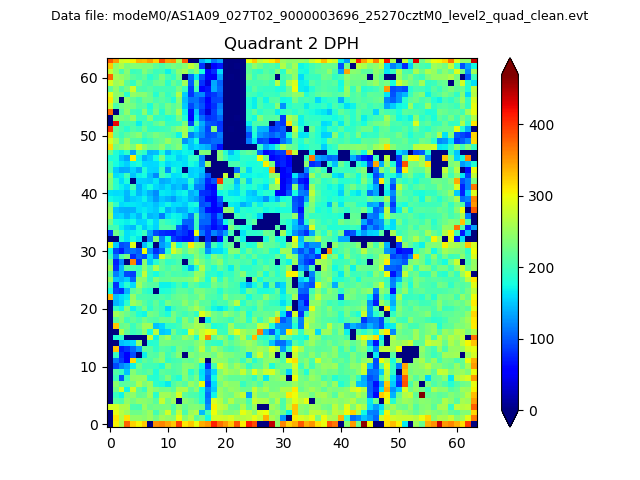
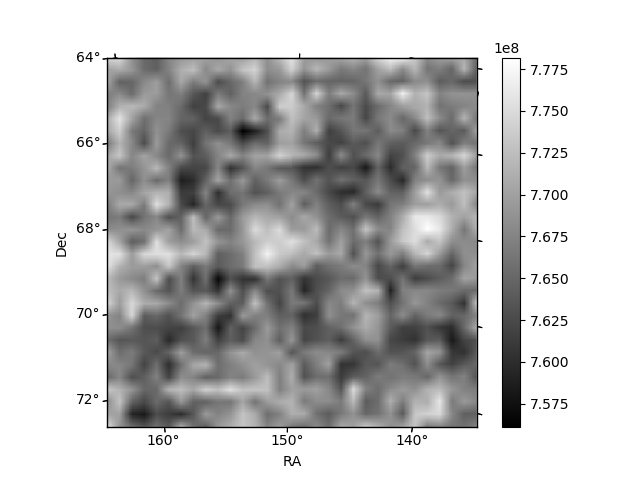
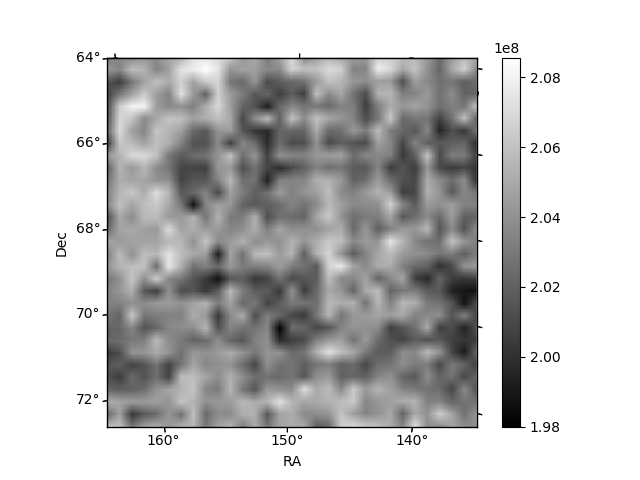
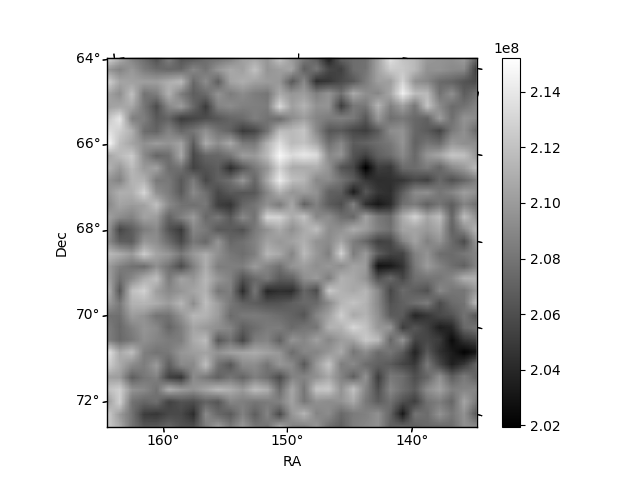
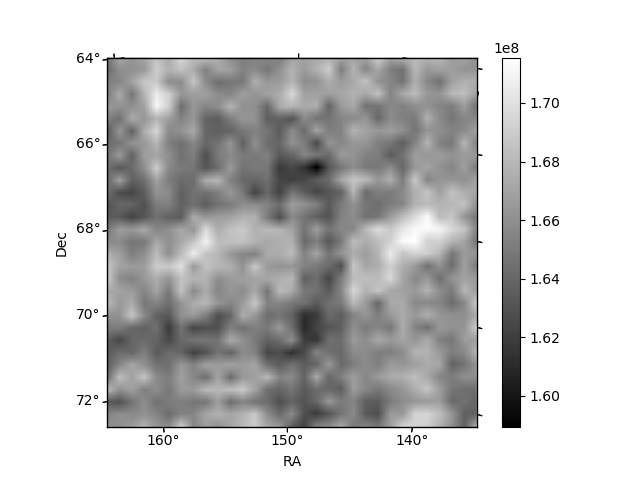
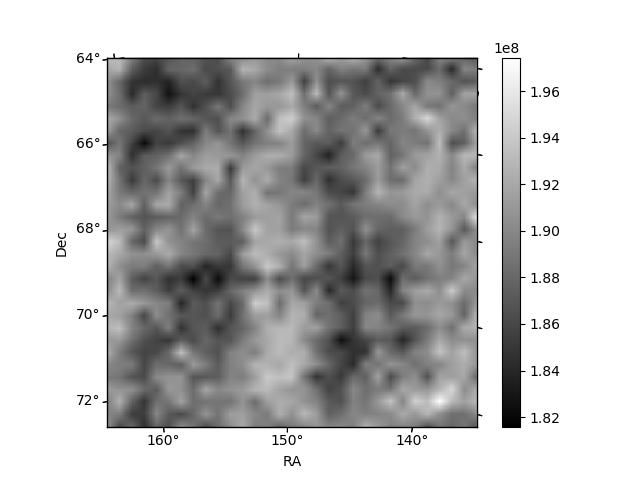
Histogram calculated using DETX and DETY for each event in the final _common_clean file
| Quadrant A | 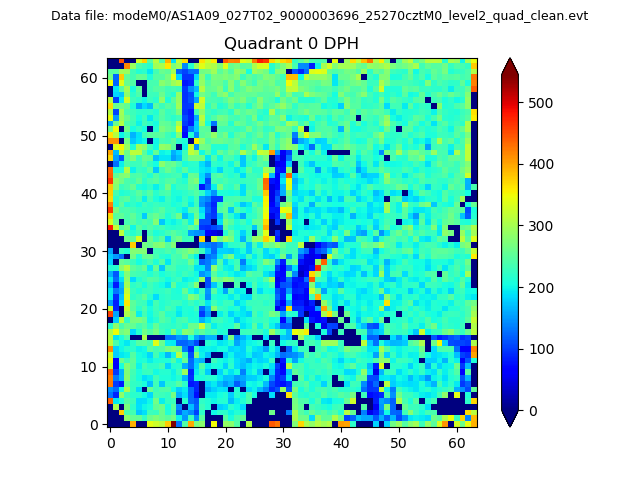 |
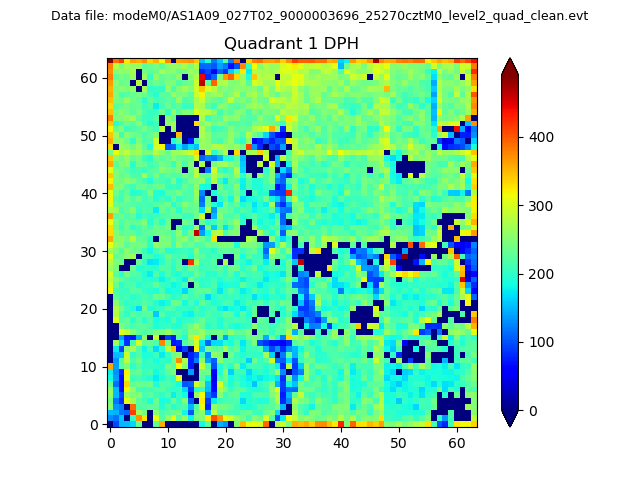 |
Quadrant B |
|---|---|---|---|
| Quadrant D | 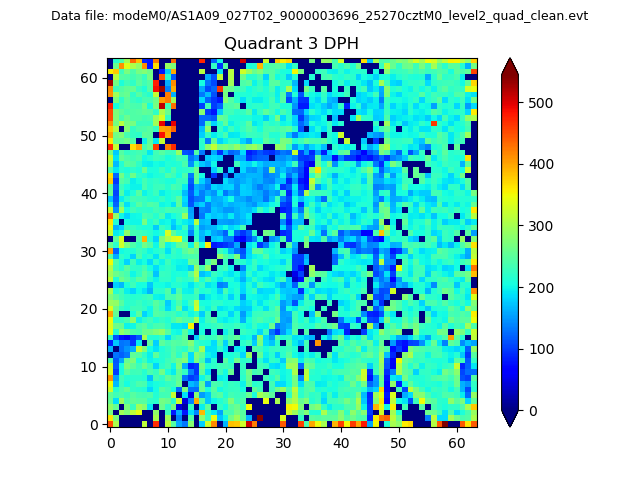 |
 |
Quadrant C |
| Plot type | Count rate plots | Images |
|---|---|---|
| Comparison with Poisson distribution Blue bars denote a histogram of data divided into 1 sec bins. Red curve is a Poisson curve with rate = median count rate of data. |
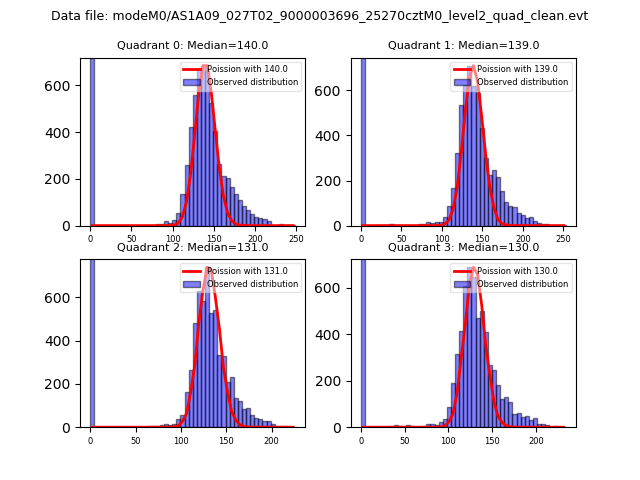 |
 |
| Quadrant-wise count rates Data is divided into 100 sec bins |
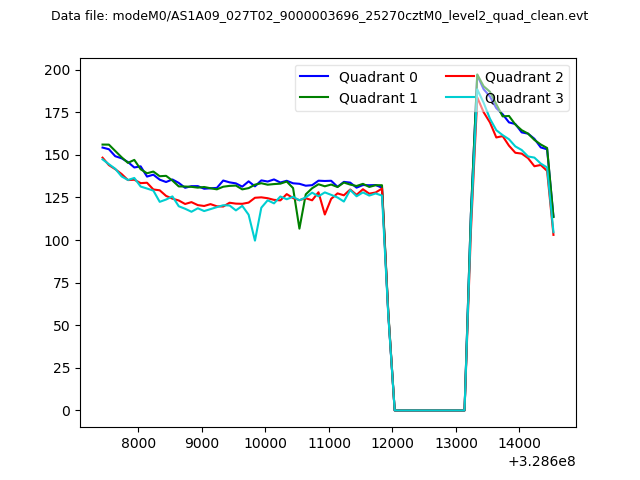 |
|
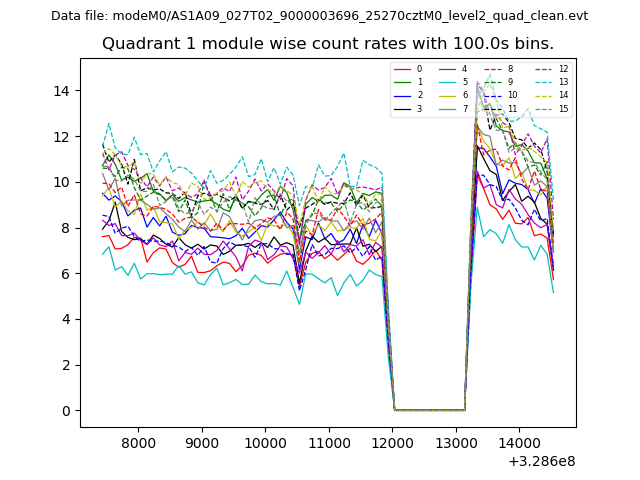
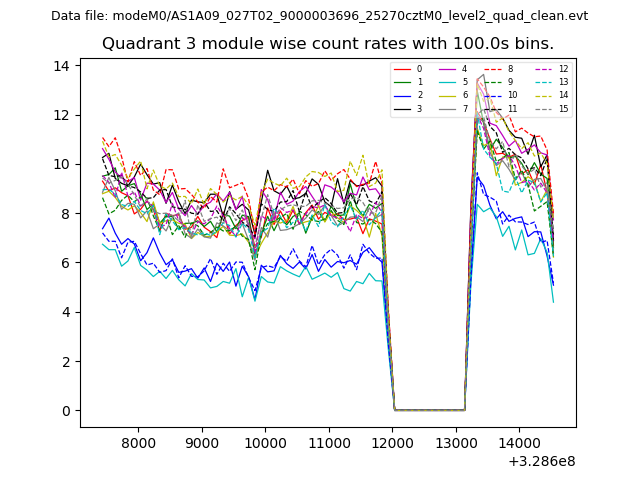
| Module-wise count rates for Quadrant A Data is divided into 100 sec bins |
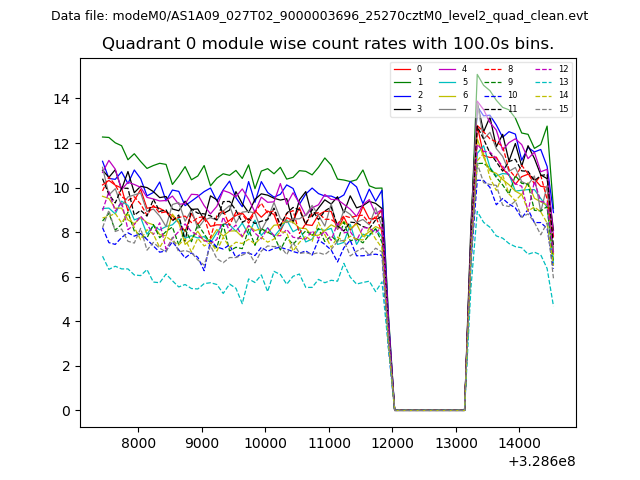 |
 |
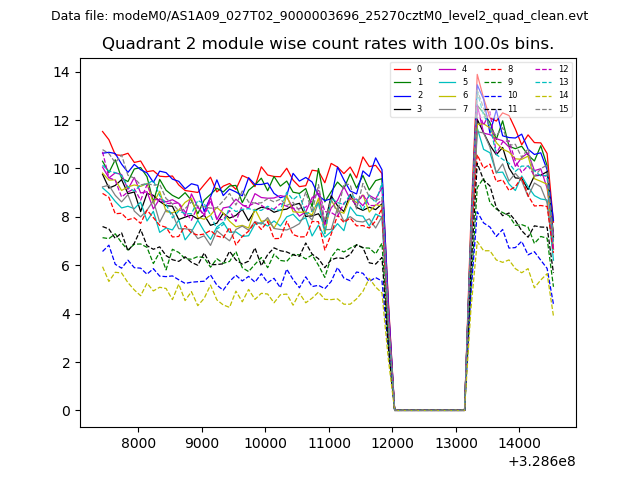
| Module-wise count rates for Quadrant B Data is divided into 100 sec bins |
 |
 |
| Module-wise count rates for Quadrant C Data is divided into 100 sec bins |
 |
 |
| Module-wise count rates for Quadrant D Data is divided into 100 sec bins |
 |
 |
| Parameter | Plot |
|---|---|
| CZT HV Monitor | 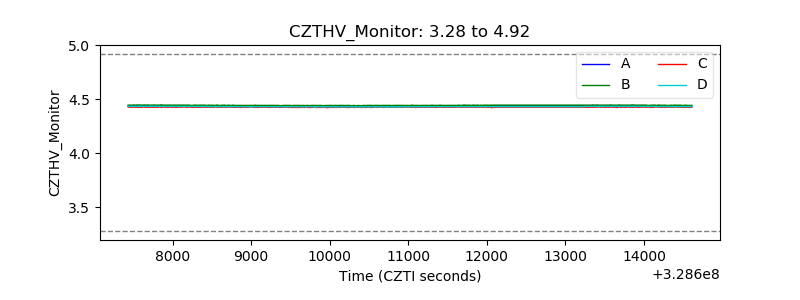 |
| D_VDD | 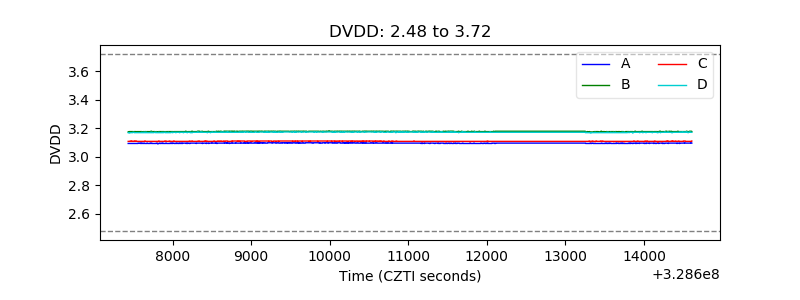 |
| Temperature 1 | 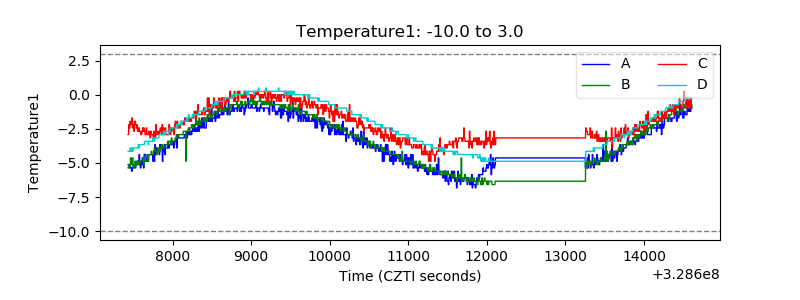 |
| Veto HV Monitor | 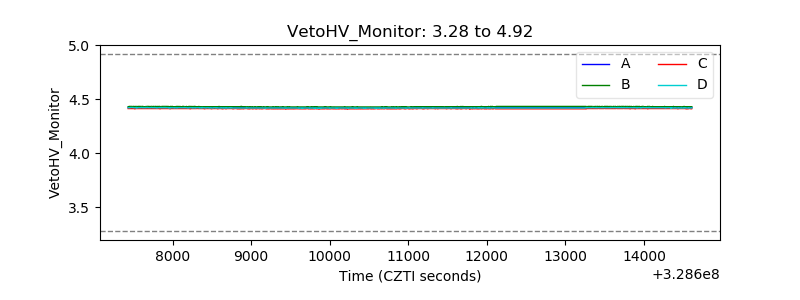 |
| Veto LLD | 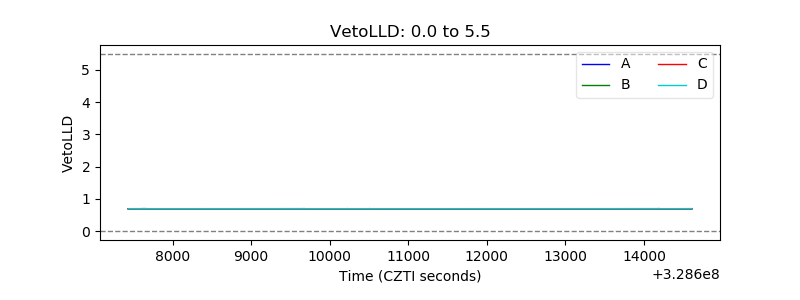 |
| Alpha Counter | 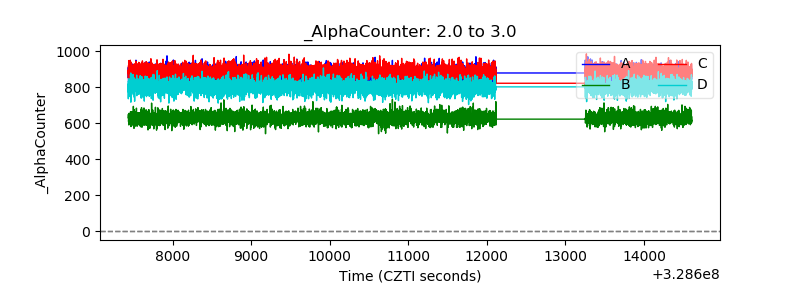 |
| _CPM_Rate | 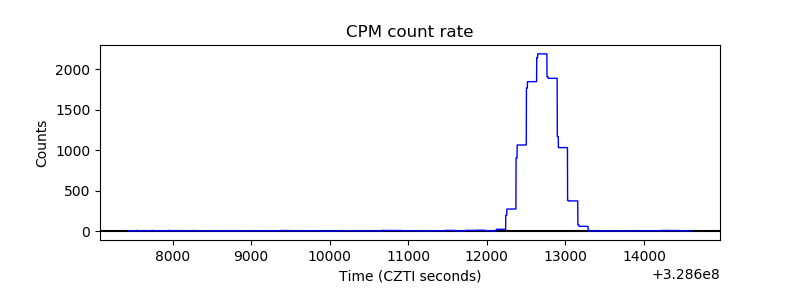 |
| CZT Counter | 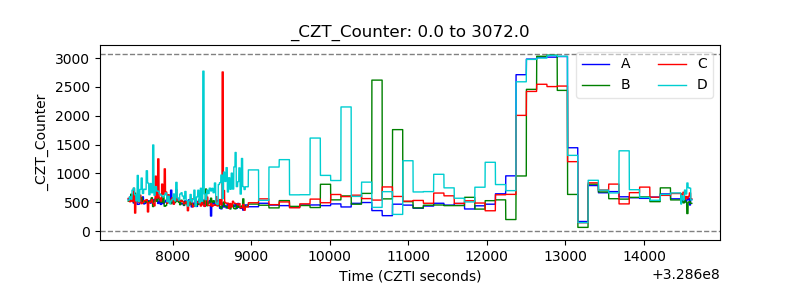 |
| +2.5 Volts monitor |  |
| +5 Volts monitor |  |
| _ROLL_ROT | 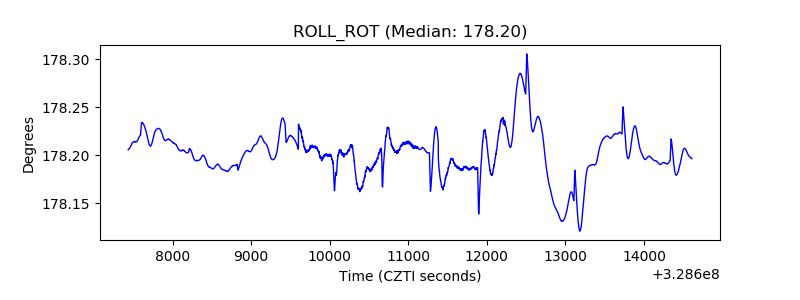 |
| _Roll_DEC | 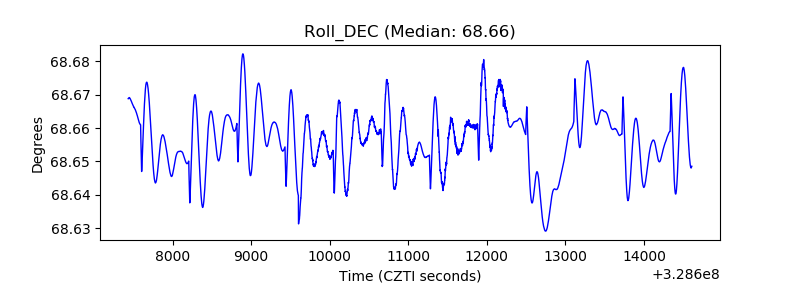 |
| _Roll_RA | 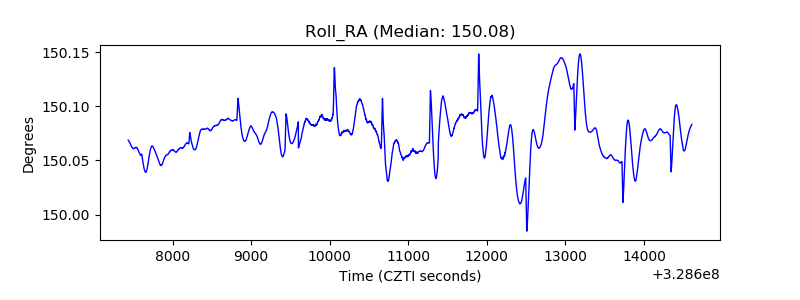 |
| Veto Counter | 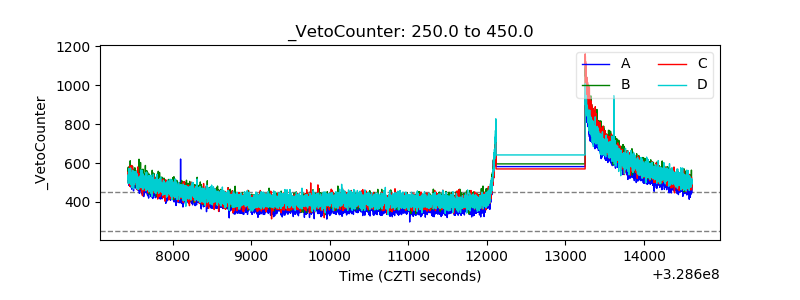 |