| Param | Original file | Final file |
|---|---|---|
| Filename | modeM0/AS1A09_027T02_9000003696_25272cztM0_level2.evt | modeM0/AS1A09_027T02_9000003696_25272cztM0_level2_quad_clean.evt |
| Size (bytes) | 509,319,360 | 118,759,680 |
| Size | 485.7 MB | 113.3 MB |
| Events in quadrant A | 3,097,235 | 829,300 |
| Events in quadrant B | 3,304,553 | 820,395 |
| Events in quadrant C | 3,212,915 | 778,429 |
| Events in quadrant D | 5,409,053 | 755,221 |
| Mode M0 | |||
|---|---|---|---|
| Quadrant | BADHDUFLAG | Total packets | Discarded packets |
| A | 0 | 12799 | 0 |
| B | 0 | 13552 | 0 |
| C | 0 | 13185 | 0 |
| D | 0 | 20366 | 0 |
| Mode M9 | |||
|---|---|---|---|
| Quadrant | BADHDUFLAG | Total packets | Discarded packets |
| A | 0 | 13 | 0 |
| B | 0 | 13 | 0 |
| C | 0 | 13 | 0 |
| D | 0 | 13 | 0 |
| Quadrant | Total seconds | Saturated seconds | Saturation percentage |
|---|---|---|---|
| A | 5921 | 81 | 1.368012% |
| B | 5922 | 120 | 2.026342% |
| C | 5922 | 113 | 1.908139% |
| D | 5922 | 260 | 4.390409% |
Noise dominated data is calculated using 1-second bins in cleaned event files. If a bin has >2000 counts, and if more than 50% of those come from <1% of pixels, then it is considered to be noise-dominated and hence unusable.
| Quadrant | # 1 sec bins | Bins with >0 counts | Bins with >2000 counts | High rate bins dominated by noise | Noise dominated (total time) | Noise dominated (detector-on time) | Marked lightcurve |
|---|---|---|---|---|---|---|---|
| A | 7231 | 5922 | 0 | 0 | 0.00% | 0.00% | 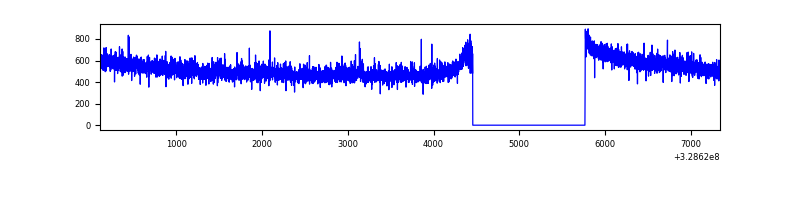 |
| B | 7232 | 5923 | 23 | 23 | 0.32% | 0.39% | 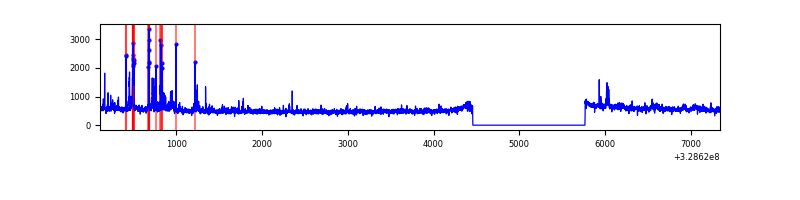 |
| C | 7232 | 5923 | 0 | 0 | 0.00% | 0.00% | 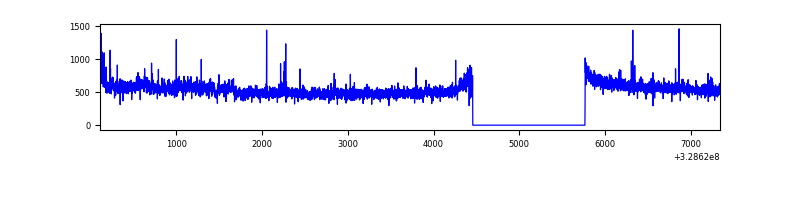 |
| D | 7232 | 5923 | 158 | 158 | 2.18% | 2.67% | 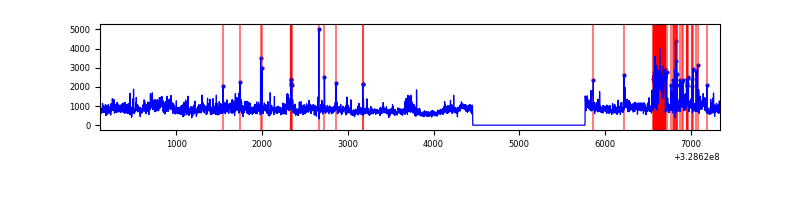 |
Top three noisy pixels from each quadrant. If the there are fewer than three noisy pixels in the level2.evt file, extra rows are filled as -1
| Pixel properties | Quadrant properties | ||||||
|---|---|---|---|---|---|---|---|
| Quadrant | DetID | PixID | Counts | Sigma | Mean | Median | Sigma |
| A | 3 | 1 | 32855 | 205.04 | 795 | 780 | 156.4 |
| A | 13 | 254 | 9907 | 58.34 | 795 | 780 | 156.4 |
| A | 0 | 226 | 7087 | 40.32 | 795 | 780 | 156.4 |
| B | 3 | 64 | 156339 | 1095.6 | 778 | 762 | 142.0 |
| B | 0 | 190 | 58907 | 409.47 | 778 | 762 | 142.0 |
| B | 15 | 33 | 31884 | 219.17 | 778 | 762 | 142.0 |
| C | 14 | 238 | 122957 | 710.97 | 754 | 762 | 171.9 |
| C | 0 | 239 | 86888 | 501.11 | 754 | 762 | 171.9 |
| C | 0 | 207 | 33519 | 190.59 | 754 | 762 | 171.9 |
| D | 8 | 195 | 1264294 | 6906.9 | 768 | 747 | 182.9 |
| D | 1 | 52 | 1029781 | 5624.99 | 768 | 747 | 182.9 |
| D | 12 | 235 | 126791 | 688.99 | 768 | 747 | 182.9 |
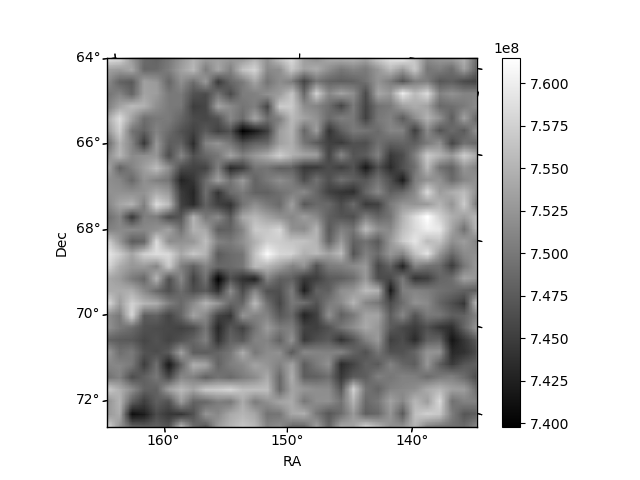
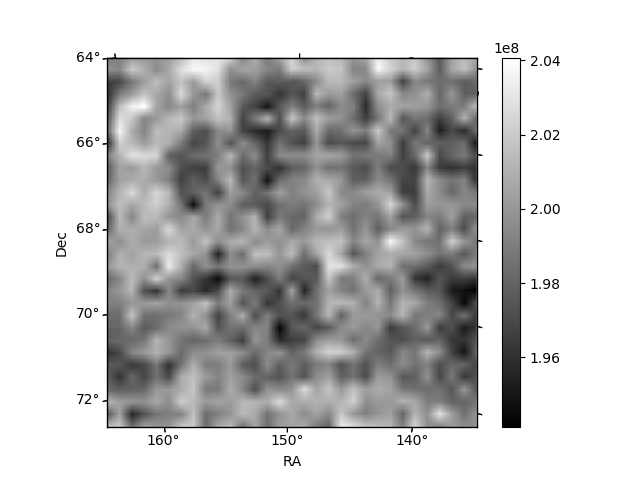
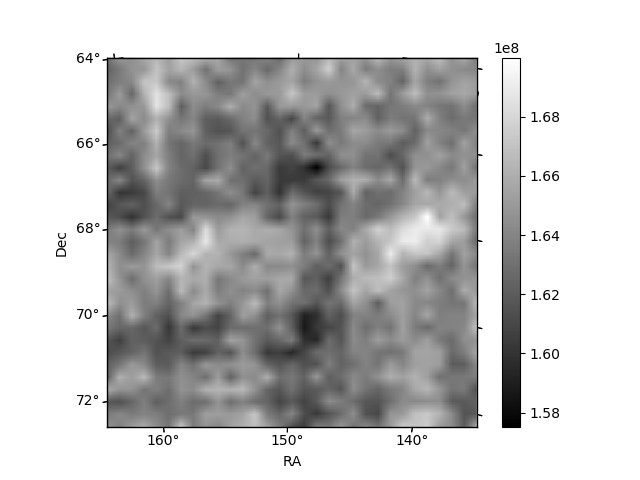
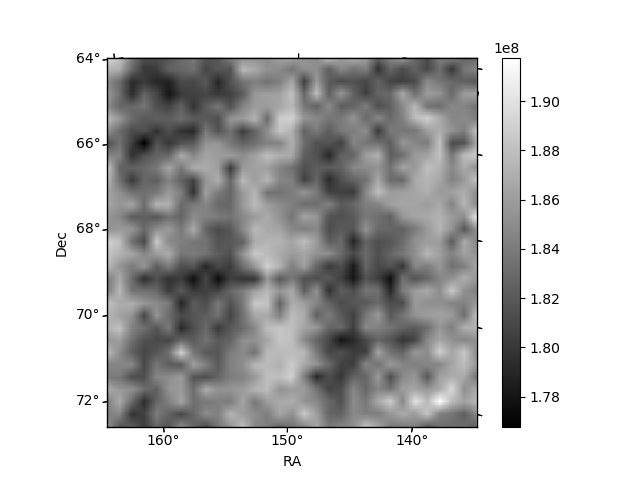
Histogram calculated using DETX and DETY for each event in the final _common_clean file
| Quadrant A | 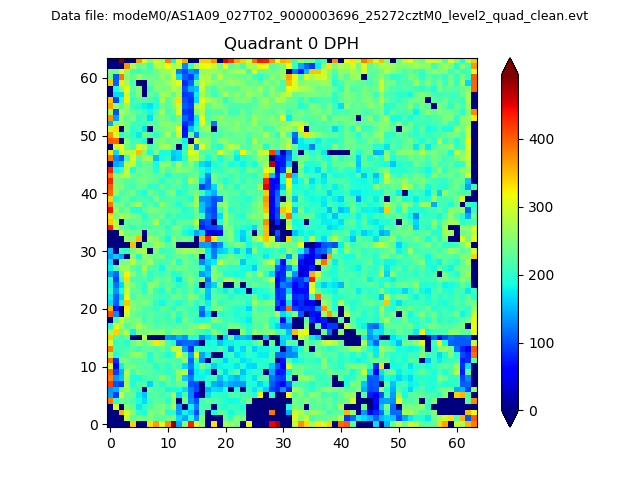 |
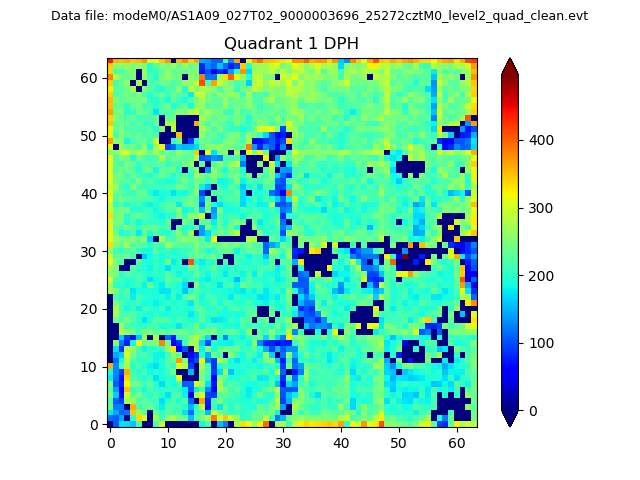 |
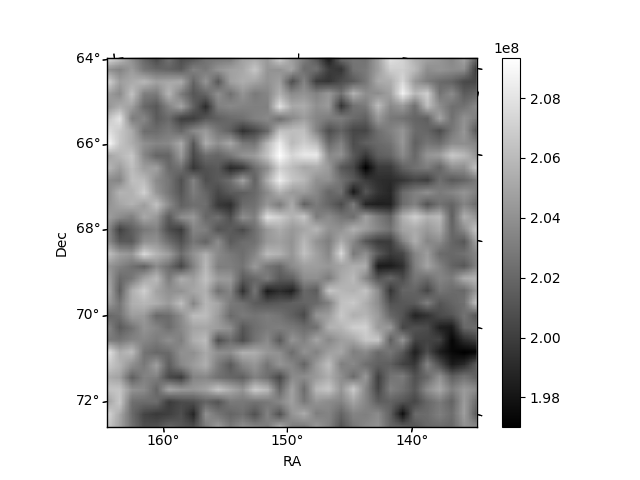
Quadrant B |
|---|---|---|---|
| Quadrant D | 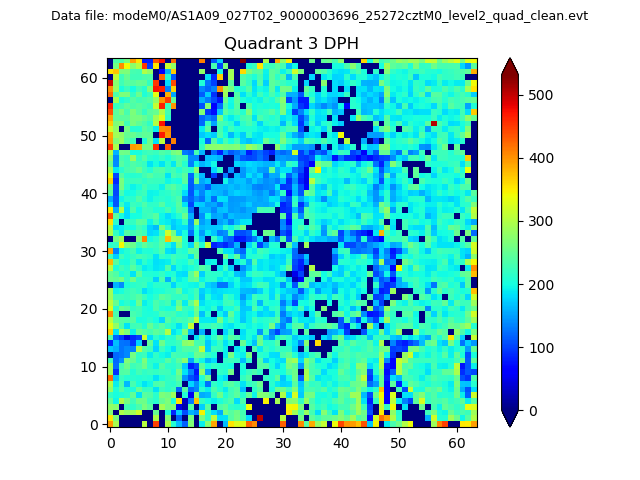 |
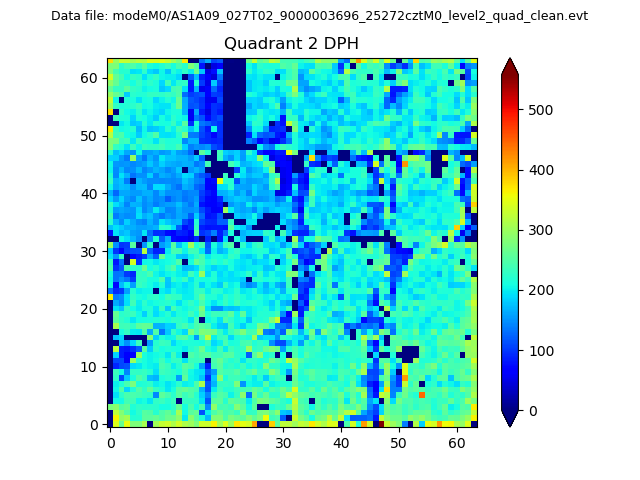 |
Quadrant C |
| Plot type | Count rate plots | Images |
|---|---|---|
| Comparison with Poisson distribution Blue bars denote a histogram of data divided into 1 sec bins. Red curve is a Poisson curve with rate = median count rate of data. |
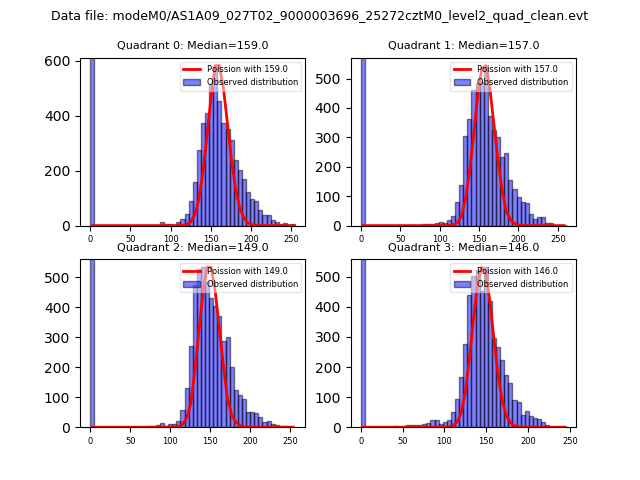 |
 |
| Quadrant-wise count rates Data is divided into 100 sec bins |
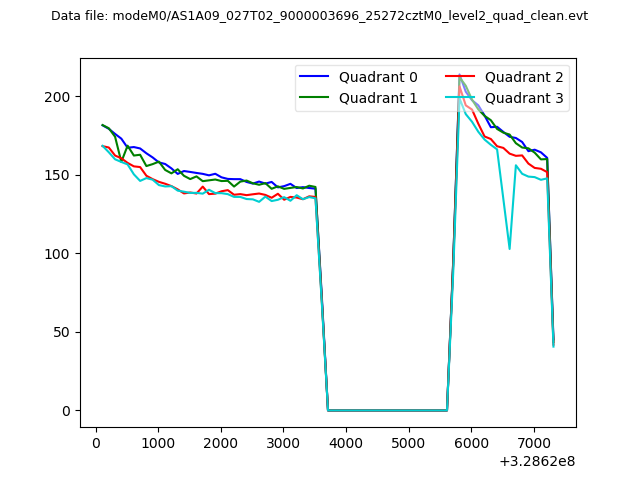 |
|
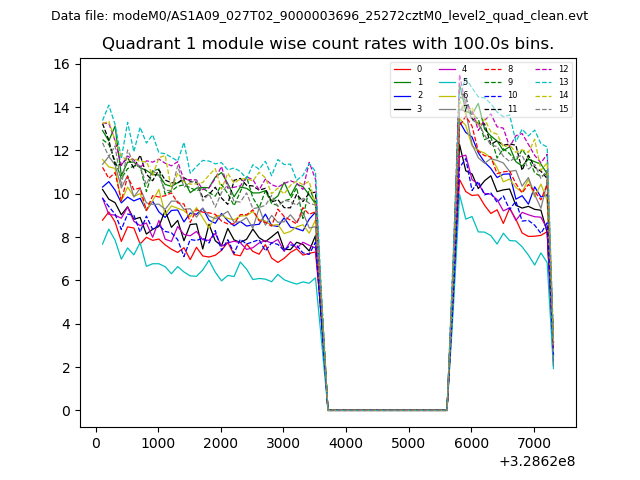
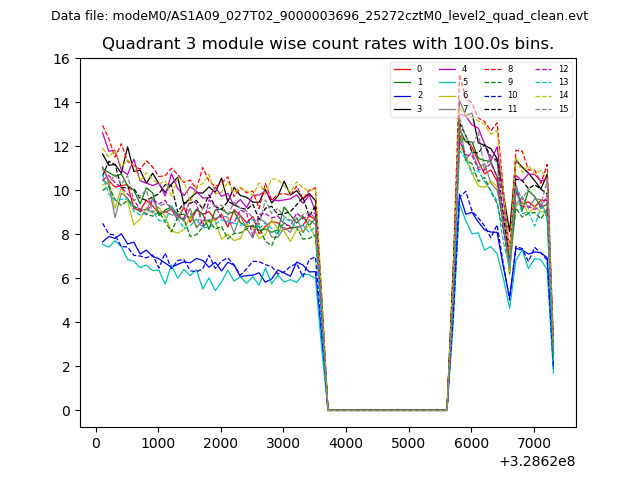
| Module-wise count rates for Quadrant A Data is divided into 100 sec bins |
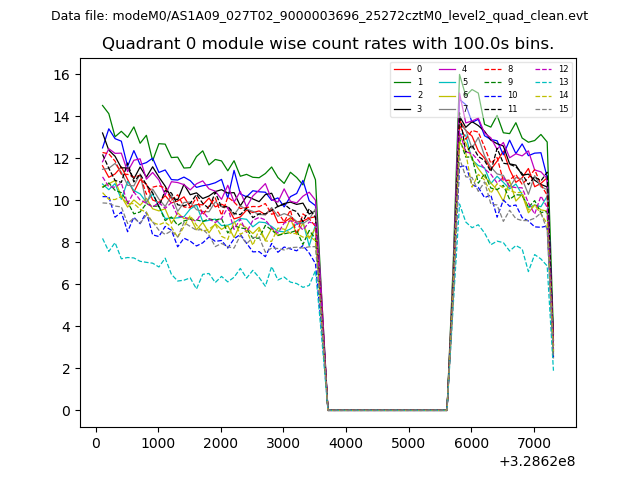 |
 |
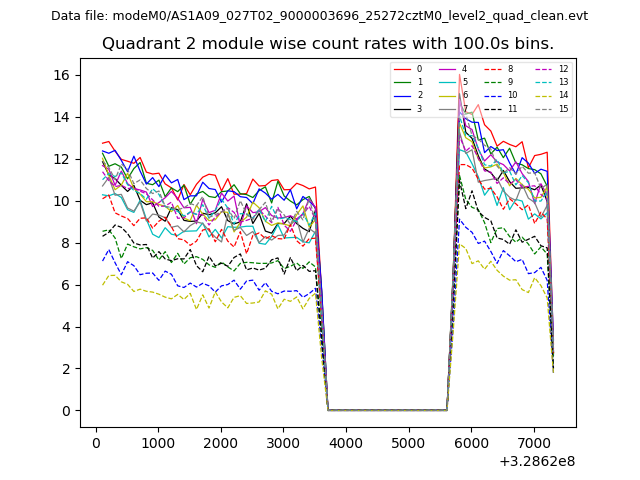
| Module-wise count rates for Quadrant B Data is divided into 100 sec bins |
 |
 |
| Module-wise count rates for Quadrant C Data is divided into 100 sec bins |
 |
 |
| Module-wise count rates for Quadrant D Data is divided into 100 sec bins |
 |
 |
| Parameter | Plot |
|---|---|
| CZT HV Monitor | 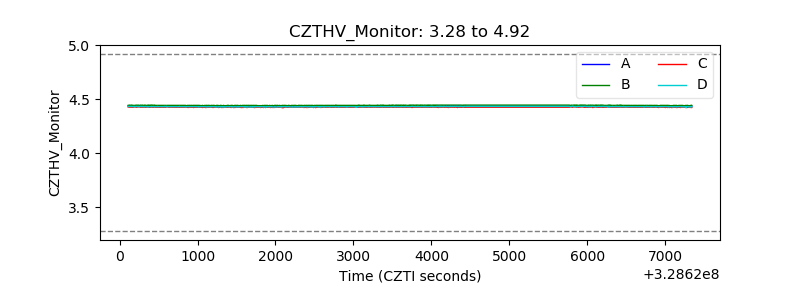 |
| D_VDD | 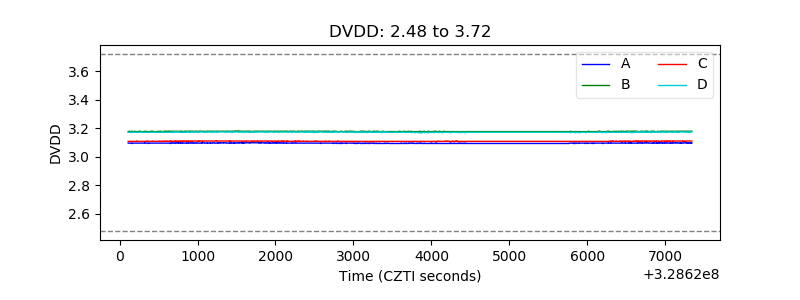 |
| Temperature 1 |  |
| Veto HV Monitor | 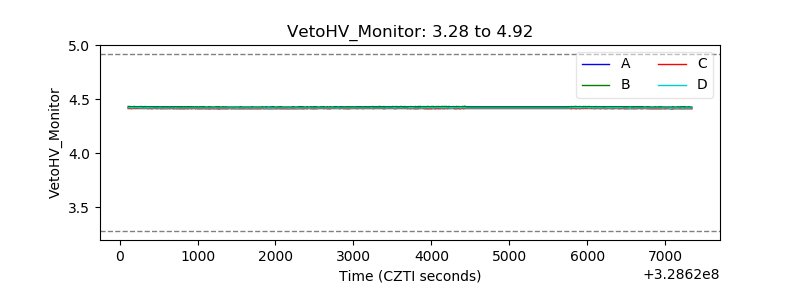 |
| Veto LLD | 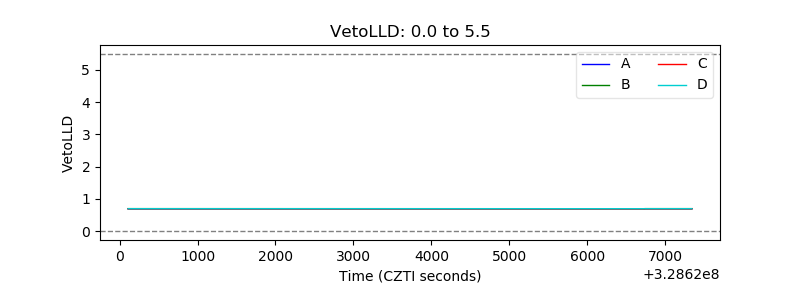 |
| Alpha Counter | 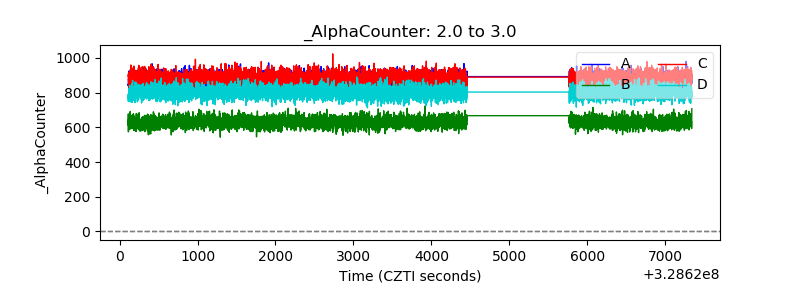 |
| _CPM_Rate | 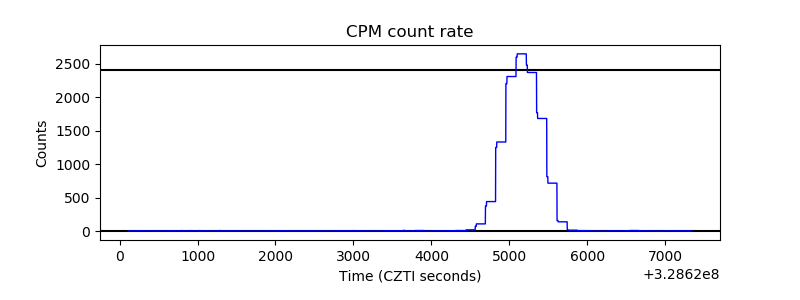 |
| CZT Counter | 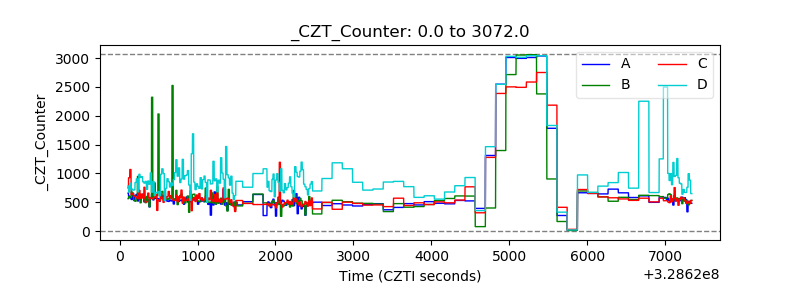 |
| +2.5 Volts monitor |  |
| +5 Volts monitor | 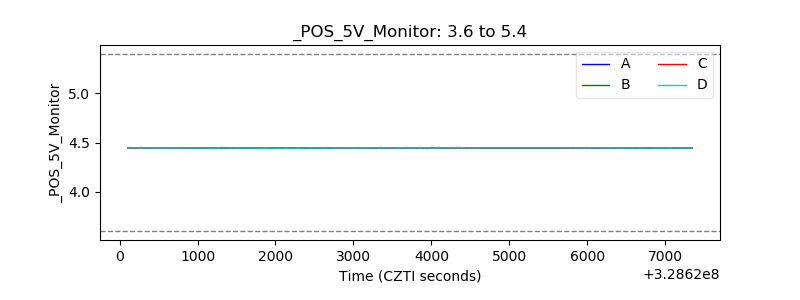 |
| _ROLL_ROT | 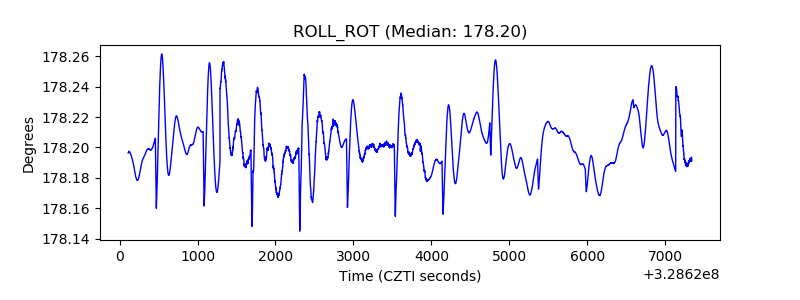 |
| _Roll_DEC | 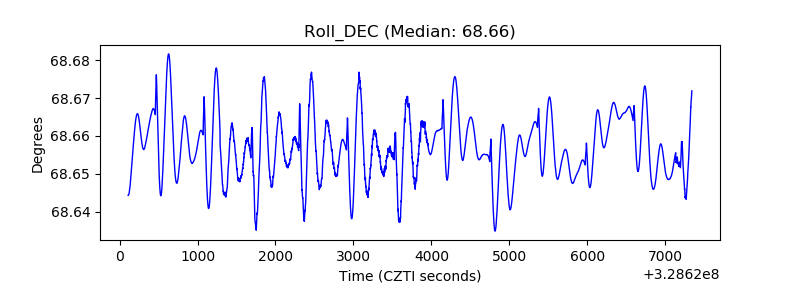 |
| _Roll_RA | 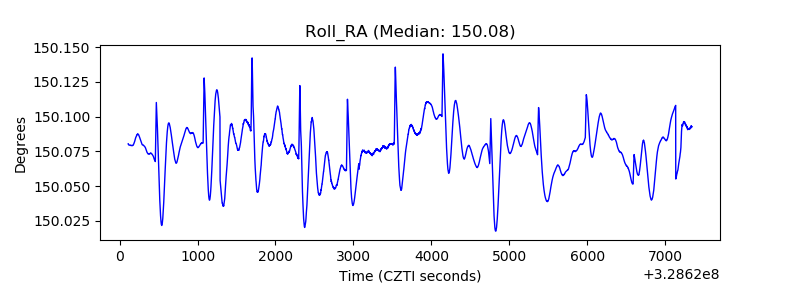 |
| Veto Counter |  |