| Param | Original file | Final file |
|---|---|---|
| Filename | modeM0/AS1A09_027T02_9000003696_25276cztM0_level2.evt | modeM0/AS1A09_027T02_9000003696_25276cztM0_level2_quad_clean.evt |
| Size (bytes) | 557,729,280 | 92,928,960 |
| Size | 531.9 MB | 88.6 MB |
| Events in quadrant A | 2,784,350 | 624,200 |
| Events in quadrant B | 3,944,833 | 600,263 |
| Events in quadrant C | 3,055,440 | 601,697 |
| Events in quadrant D | 6,700,284 | 568,969 |
| Mode M0 | |||
|---|---|---|---|
| Quadrant | BADHDUFLAG | Total packets | Discarded packets |
| A | 0 | 12294 | 0 |
| B | 0 | 15704 | 0 |
| C | 0 | 12837 | 0 |
| D | 0 | 24065 | 0 |
| Mode M9 | |||
|---|---|---|---|
| Quadrant | BADHDUFLAG | Total packets | Discarded packets |
| A | 0 | 5 | 0 |
| B | 0 | 5 | 0 |
| C | 0 | 5 | 0 |
| D | 0 | 5 | 0 |
| Quadrant | Total seconds | Saturated seconds | Saturation percentage |
|---|---|---|---|
| A | 5994 | 27 | 0.450450% |
| B | 5995 | 447 | 7.456214% |
| C | 5995 | 97 | 1.618015% |
| D | 5995 | 481 | 8.023353% |
Noise dominated data is calculated using 1-second bins in cleaned event files. If a bin has >2000 counts, and if more than 50% of those come from <1% of pixels, then it is considered to be noise-dominated and hence unusable.
| Quadrant | # 1 sec bins | Bins with >0 counts | Bins with >2000 counts | High rate bins dominated by noise | Noise dominated (total time) | Noise dominated (detector-on time) | Marked lightcurve |
|---|---|---|---|---|---|---|---|
| A | 6589 | 5995 | 0 | 0 | 0.00% | 0.00% | 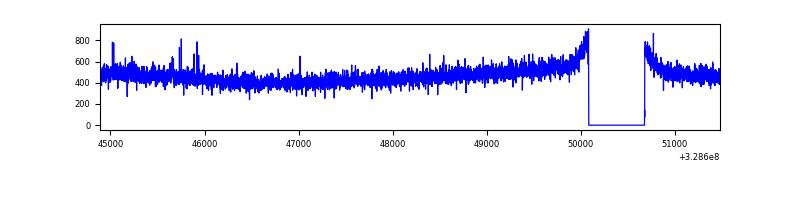 |
| B | 6590 | 5996 | 238 | 238 | 3.61% | 3.97% | 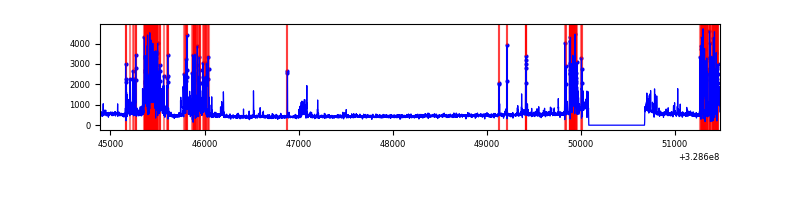 |
| C | 6590 | 5996 | 0 | 0 | 0.00% | 0.00% | 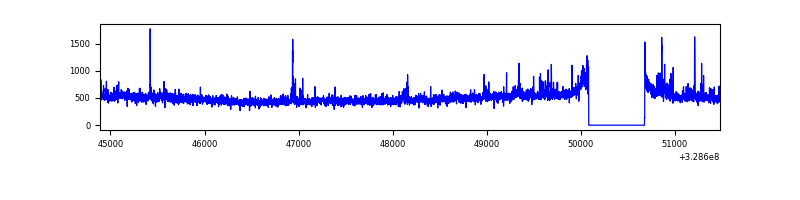 |
| D | 6590 | 5996 | 513 | 513 | 7.78% | 8.56% | 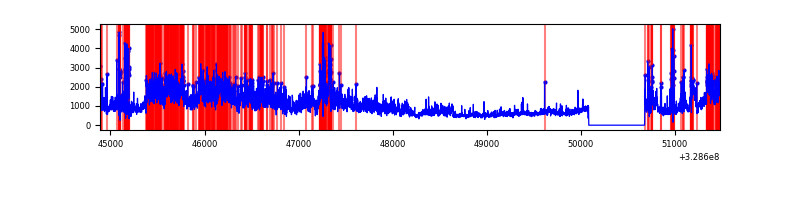 |
Top three noisy pixels from each quadrant. If the there are fewer than three noisy pixels in the level2.evt file, extra rows are filled as -1
| Pixel properties | Quadrant properties | ||||||
|---|---|---|---|---|---|---|---|
| Quadrant | DetID | PixID | Counts | Sigma | Mean | Median | Sigma |
| A | 3 | 1 | 11050 | 72.15 | 717 | 703 | 143.4 |
| A | 13 | 254 | 9786 | 63.33 | 717 | 703 | 143.4 |
| A | 0 | 226 | 6272 | 38.83 | 717 | 703 | 143.4 |
| B | 3 | 64 | 1154834 | 8899.88 | 692 | 676 | 129.7 |
| B | 0 | 219 | 48233 | 366.72 | 692 | 676 | 129.7 |
| B | 12 | 111 | 14984 | 110.33 | 692 | 676 | 129.7 |
| C | 3 | 233 | 135573 | 834.37 | 692 | 696 | 161.7 |
| C | 14 | 238 | 109217 | 671.33 | 692 | 696 | 161.7 |
| C | 0 | 207 | 63999 | 391.6 | 692 | 696 | 161.7 |
| D | 8 | 195 | 3257623 | 19635.76 | 687 | 666 | 165.9 |
| D | 1 | 52 | 571019 | 3438.58 | 687 | 666 | 165.9 |
| D | 12 | 235 | 148012 | 888.33 | 687 | 666 | 165.9 |
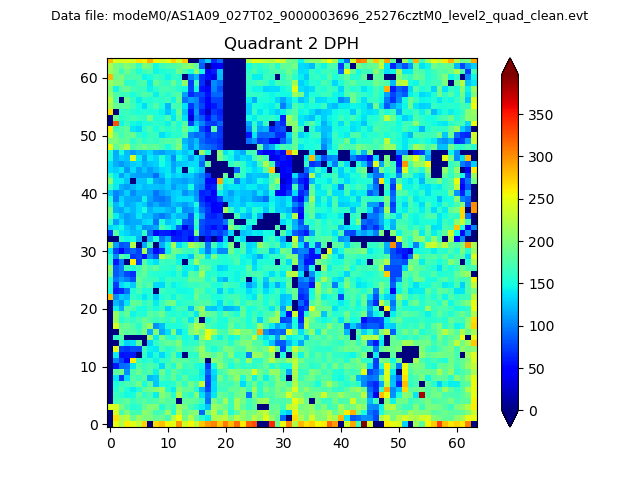
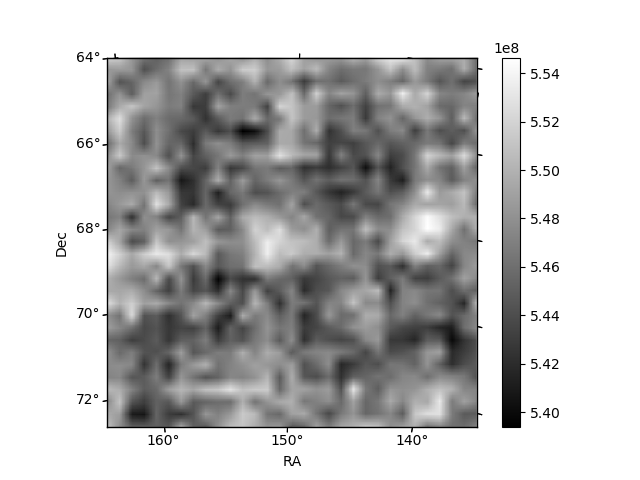
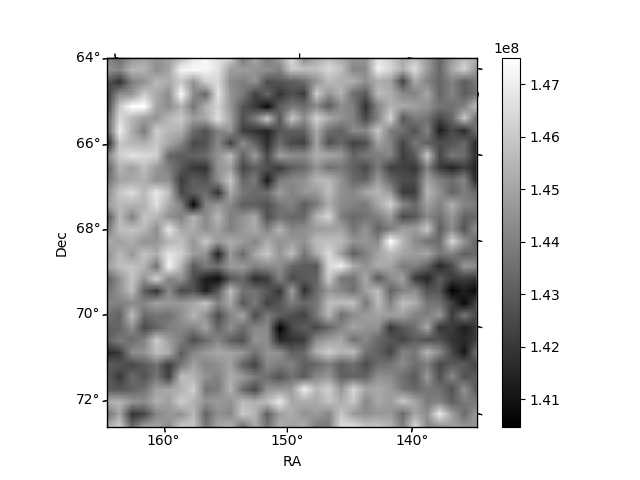
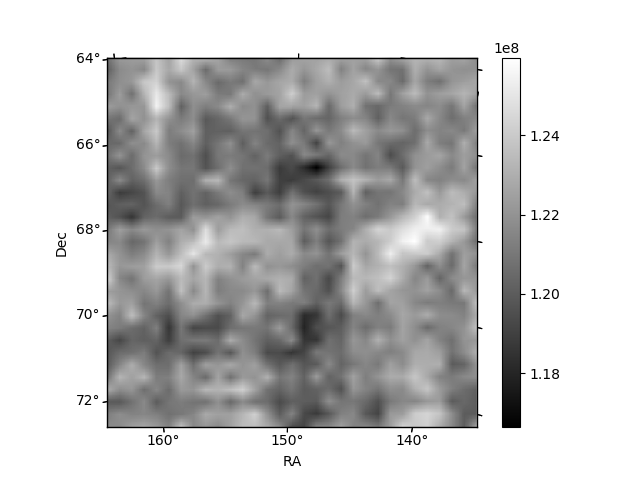
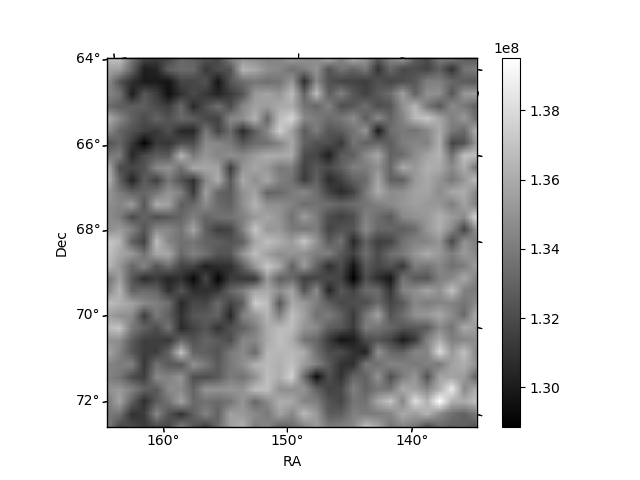
Histogram calculated using DETX and DETY for each event in the final _common_clean file
| Quadrant A | 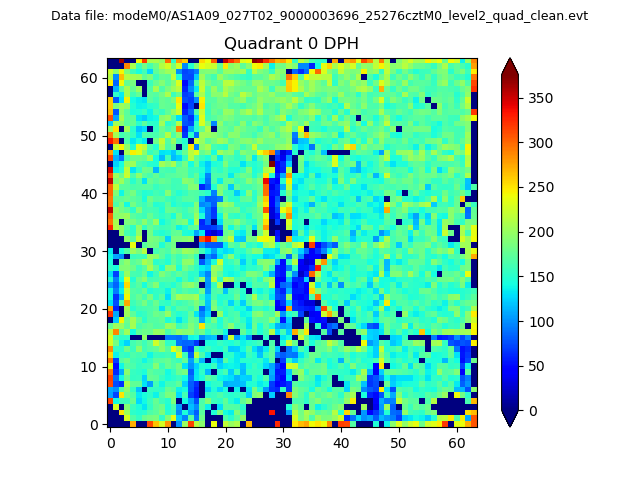 |
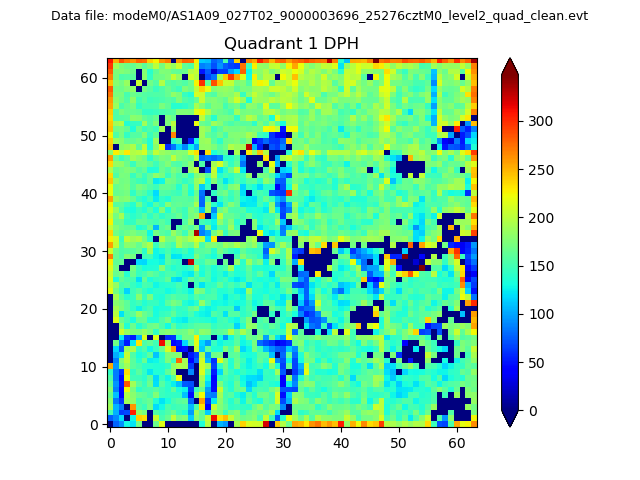 |
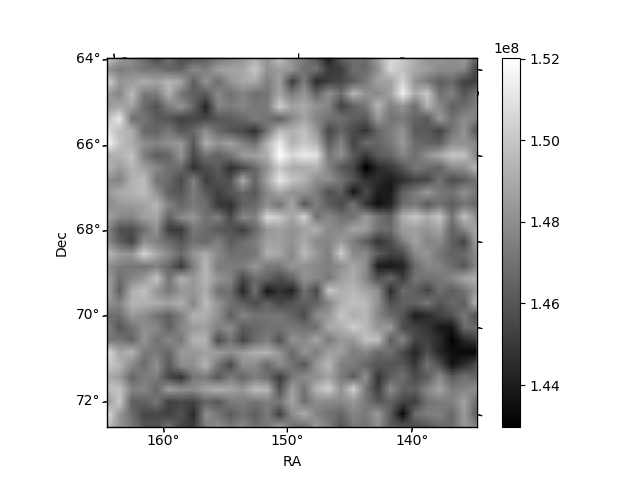
Quadrant B |
|---|---|---|---|
| Quadrant D | 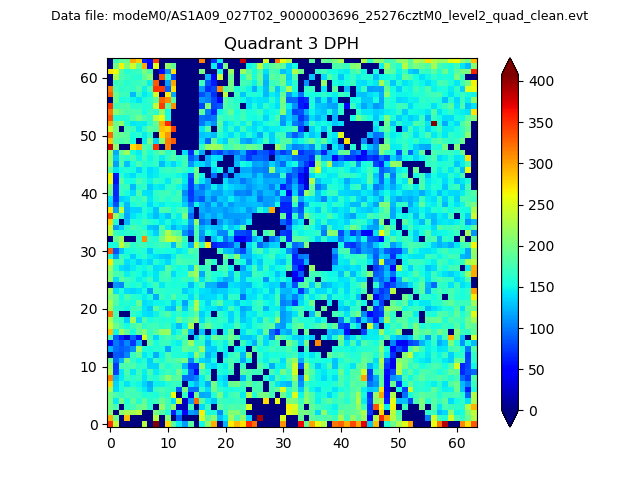 |
 |
Quadrant C |
| Plot type | Count rate plots | Images |
|---|---|---|
| Comparison with Poisson distribution Blue bars denote a histogram of data divided into 1 sec bins. Red curve is a Poisson curve with rate = median count rate of data. |
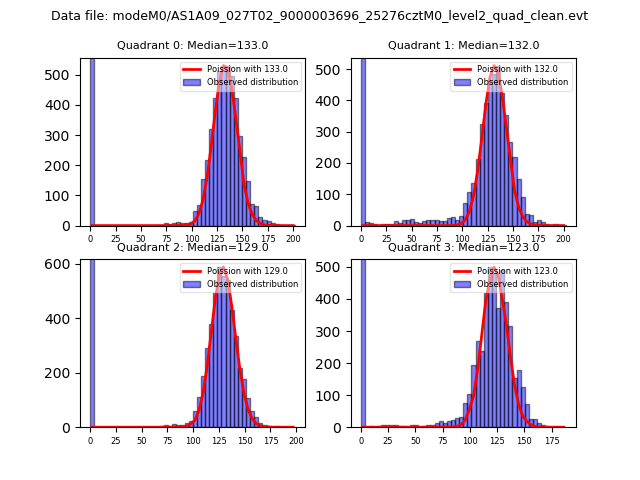 |
 |
| Quadrant-wise count rates Data is divided into 100 sec bins |
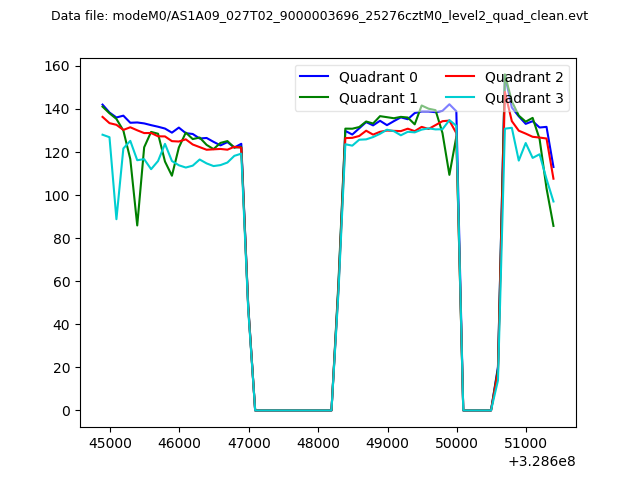 |
|
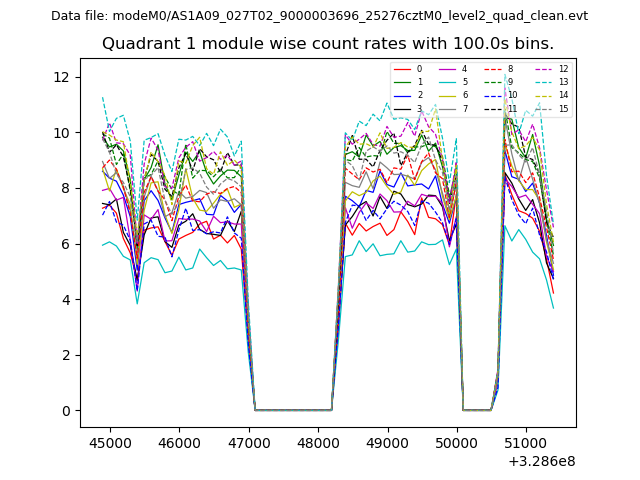
| Module-wise count rates for Quadrant A Data is divided into 100 sec bins |
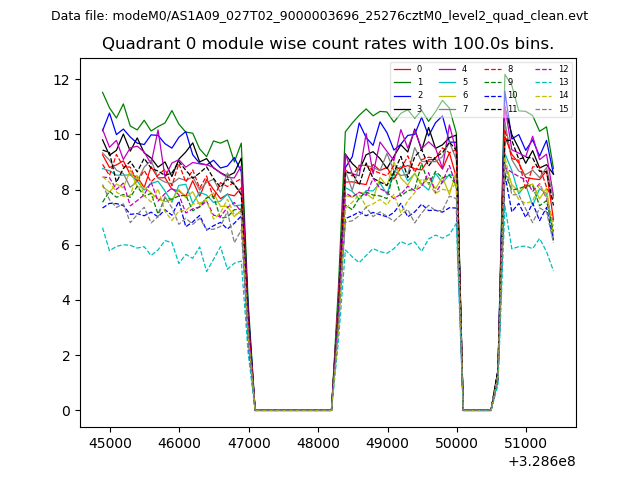 |
 |
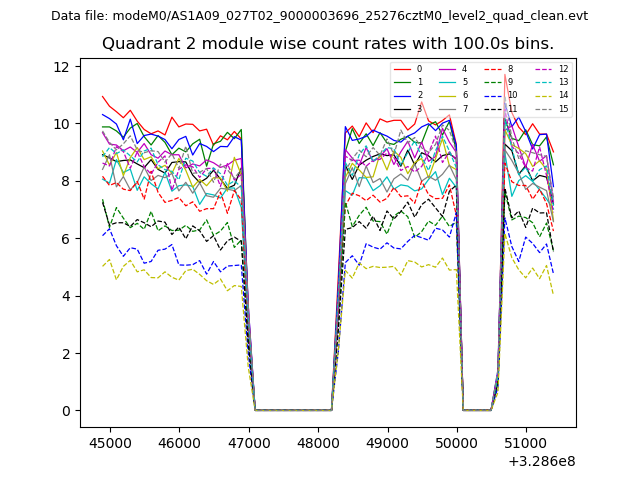
| Module-wise count rates for Quadrant B Data is divided into 100 sec bins |
 |
 |
| Module-wise count rates for Quadrant C Data is divided into 100 sec bins |
 |
 |
| Module-wise count rates for Quadrant D Data is divided into 100 sec bins |
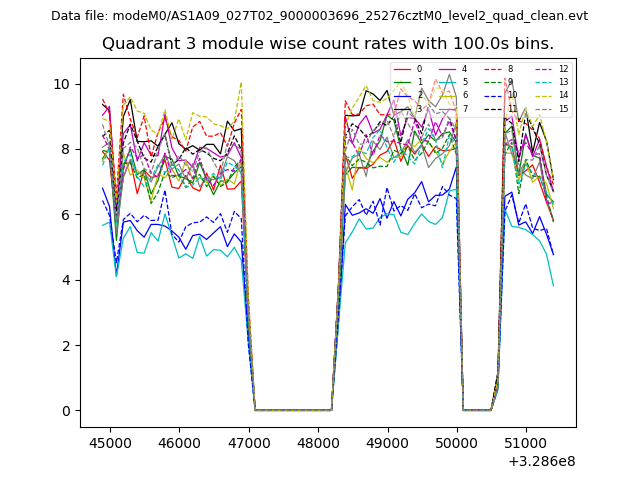 |
 |
| Parameter | Plot |
|---|---|
| CZT HV Monitor | 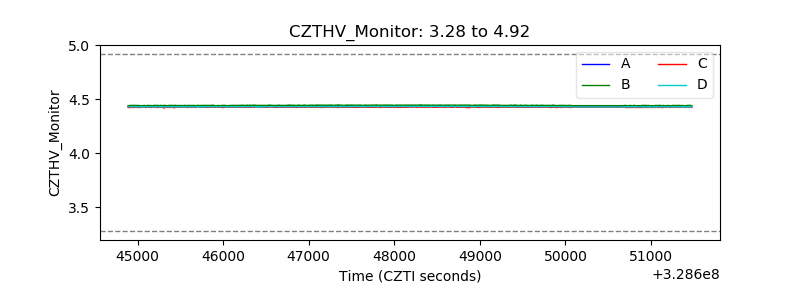 |
| D_VDD | 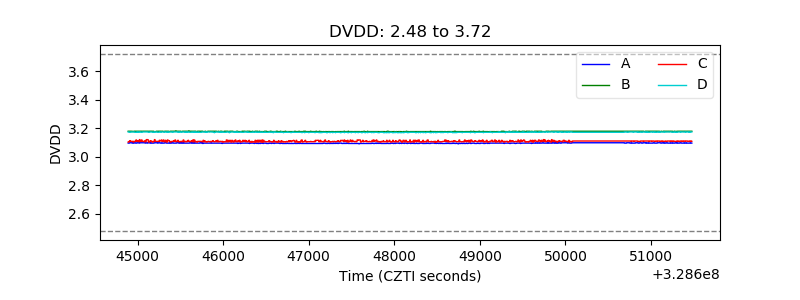 |
| Temperature 1 | 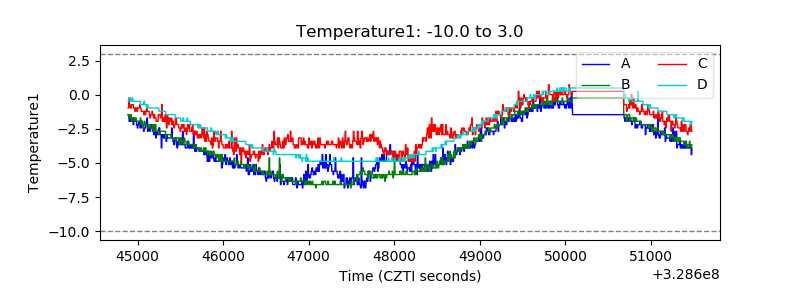 |
| Veto HV Monitor | 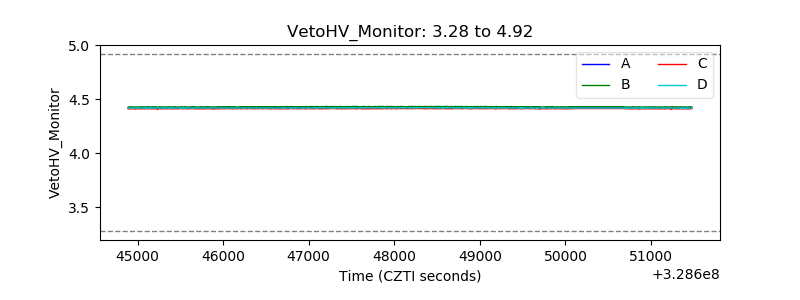 |
| Veto LLD | 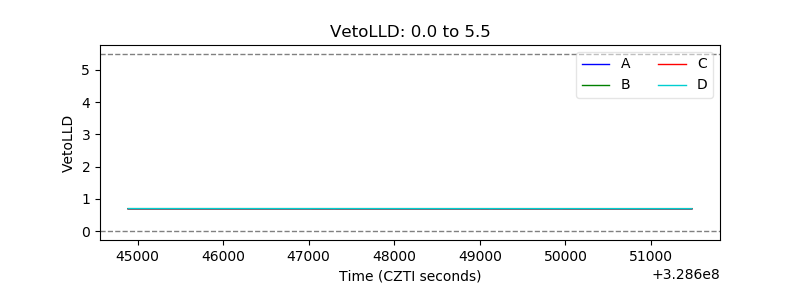 |
| Alpha Counter | 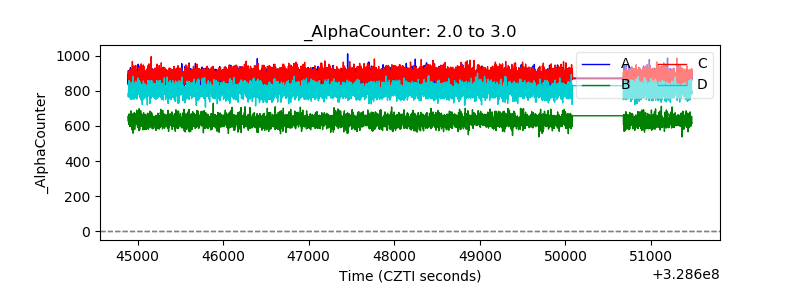 |
| _CPM_Rate | 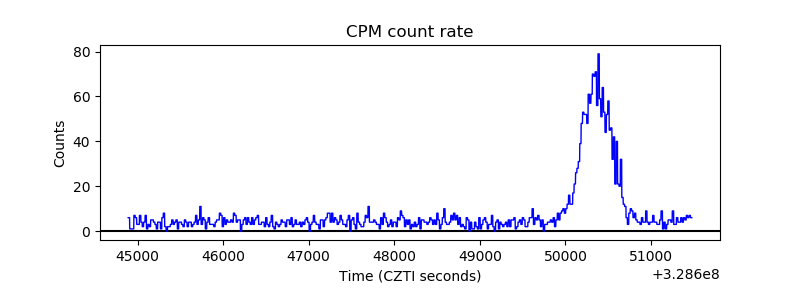 |
| CZT Counter | 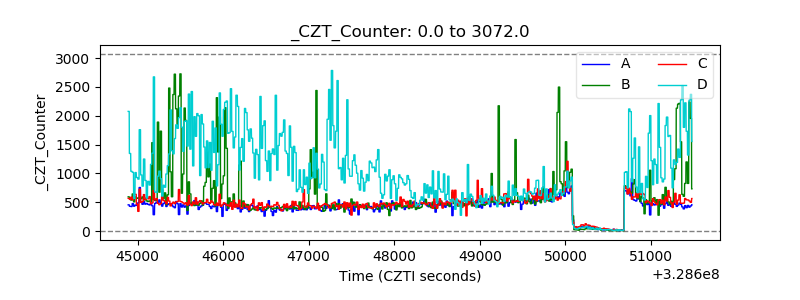 |
| +2.5 Volts monitor |  |
| +5 Volts monitor |  |
| _ROLL_ROT | 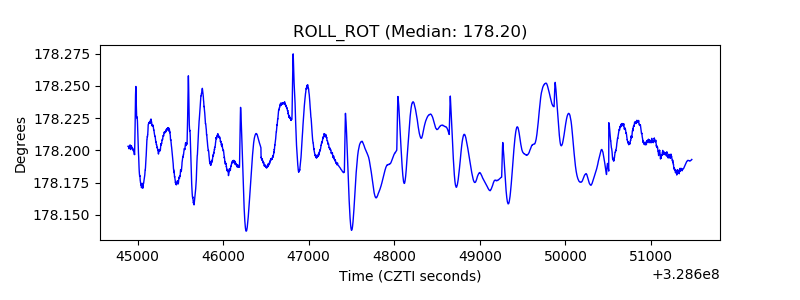 |
| _Roll_DEC | 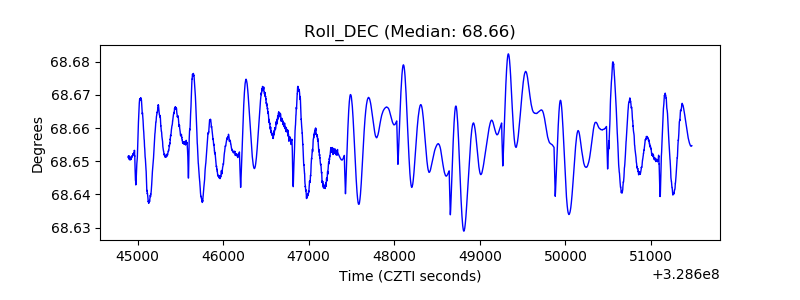 |
| _Roll_RA | 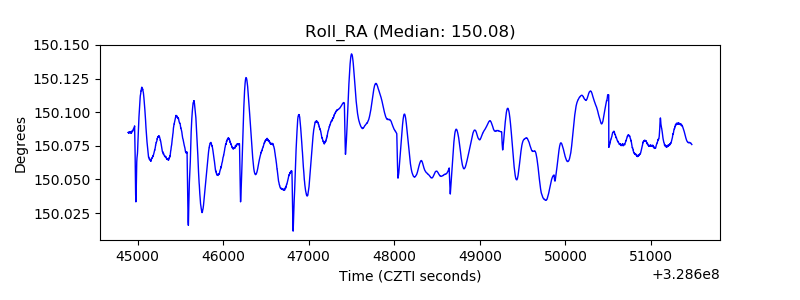 |
| Veto Counter | 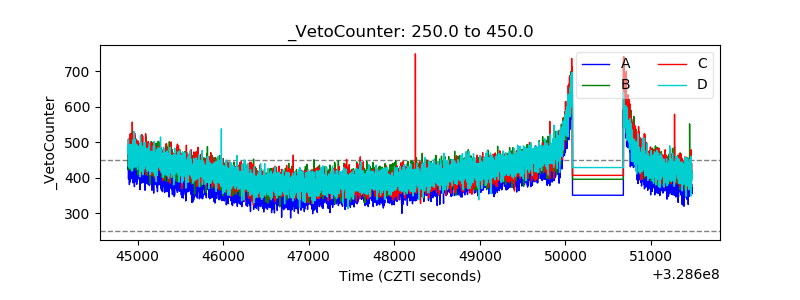 |