| Param | Original file | Final file |
|---|---|---|
| Filename | modeM0/AS1A09_006T01_9000003700cztM0_level2.fits | modeM0/AS1A09_006T01_9000003700cztM0_level2_quad_clean.evt |
| Size (bytes) | 353,050,560 | 340,076,160 |
| Size | 336.7 MB | 324.3 MB |
| Events in quadrant A | 2,205,162 | 2,112,592 |
| Events in quadrant B | 2,065,124 | 2,037,927 |
| Events in quadrant C | 2,104,138 | 1,954,352 |
| Events in quadrant D | 1,807,220 | 1,683,875 |
| Mode M9 | |||
|---|---|---|---|
| Quadrant | BADHDUFLAG | Total packets | Discarded packets |
| A | 0 | 45 | 0 |
| B | 0 | 45 | 0 |
| C | 0 | 45 | 0 |
| D | 0 | 45 | 0 |
| Mode SS | |||
|---|---|---|---|
| Quadrant | BADHDUFLAG | Total packets | Discarded packets |
| A | 0 | 738 | 0 |
| B | 0 | 738 | 0 |
| C | 0 | 738 | 0 |
| D | 0 | 738 | 0 |
| Mode M0 | |||
|---|---|---|---|
| Quadrant | BADHDUFLAG | Total packets | Discarded packets |
| A | 0 | 74823 | 0 |
| B | 0 | 85689 | 0 |
| C | 0 | 79381 | 0 |
| D | 0 | 117570 | 0 |
| Quadrant | Total seconds | Saturated seconds | Saturation percentage |
|---|---|---|---|
| A | 36556 | 171 | 0.467775% |
| B | 36556 | 1326 | 3.627312% |
| C | 36556 | 634 | 1.734325% |
| D | 36556 | 2346 | 6.417551% |
Noise dominated data is calculated using 1-second bins in cleaned event files. If a bin has >2000 counts, and if more than 50% of those come from <1% of pixels, then it is considered to be noise-dominated and hence unusable.
| Quadrant | # 1 sec bins | Bins with >0 counts | Bins with >2000 counts | High rate bins dominated by noise | Noise dominated (total time) | Noise dominated (detector-on time) | Marked lightcurve |
|---|---|---|---|---|---|---|---|
| A | 40816 | 36556 | 0 | 0 | 0.00% | 0.00% |  |
| B | 40816 | 36546 | 0 | 0 | 0.00% | 0.00% |  |
| C | 40816 | 36545 | 0 | 0 | 0.00% | 0.00% | 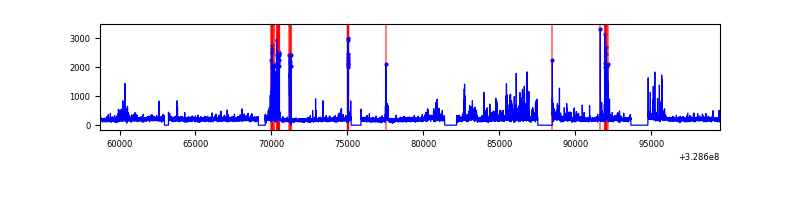 |
| D | 40816 | 36543 | 0 | 0 | 0.00% | 0.00% |  |
Top three noisy pixels from each quadrant. If the there are fewer than three noisy pixels in the level2.evt file, extra rows are filled as -1
| Pixel properties | Quadrant properties | ||||||
|---|---|---|---|---|---|---|---|
| Quadrant | DetID | PixID | Counts | Sigma | Mean | Median | Sigma |
| A | 0 | 29 | 2121 | 11.03 | 573 | 538 | 143.5 |
| A | 7 | 110 | 1795 | 8.76 | 573 | 538 | 143.5 |
| A | 9 | 19 | 1654 | 7.78 | 573 | 538 | 143.5 |
| B | 2 | 9 | 1661 | 10.63 | 544 | 519 | 107.4 |
| B | 2 | 8 | 1383 | 8.04 | 544 | 519 | 107.4 |
| B | 5 | 232 | 1319 | 7.45 | 544 | 519 | 107.4 |
| C | 1 | 81 | 1627 | 7.67 | 555 | 518 | 144.6 |
| C | 1 | 80 | 1597 | 7.46 | 555 | 518 | 144.6 |
| C | 3 | 126 | 1463 | 6.53 | 555 | 518 | 144.6 |
| D | 3 | 14 | 1321 | 6.15 | 515 | 468 | 138.6 |
| D | 6 | 231 | 1258 | 5.7 | 515 | 468 | 138.6 |
| D | 1 | 31 | 1250 | 5.64 | 515 | 468 | 138.6 |
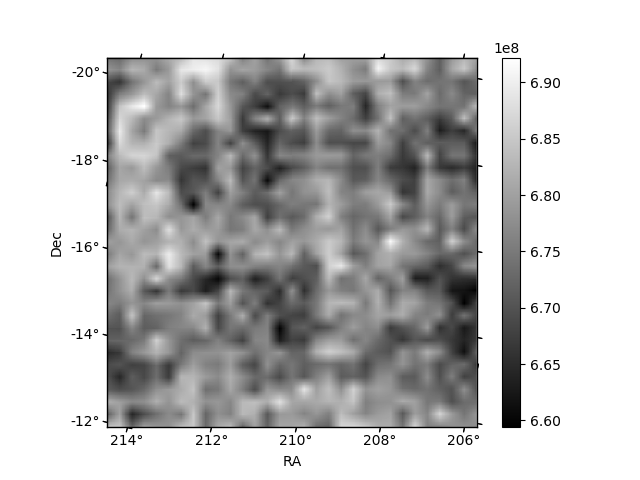
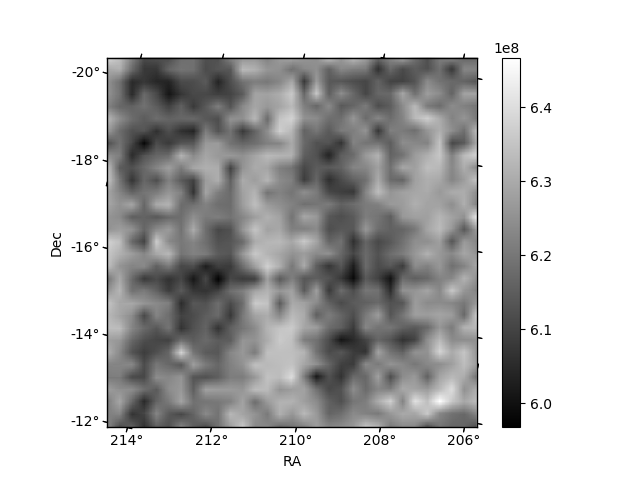
Histogram calculated using DETX and DETY for each event in the final _common_clean file
| Quadrant A | 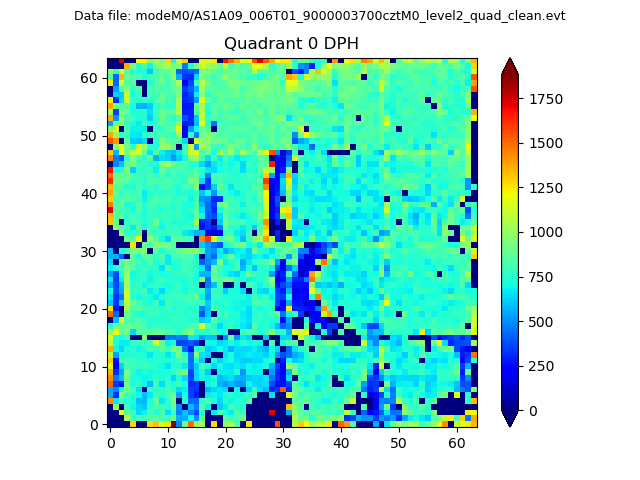 |
 |
Quadrant B |
|---|---|---|---|
| Quadrant D | 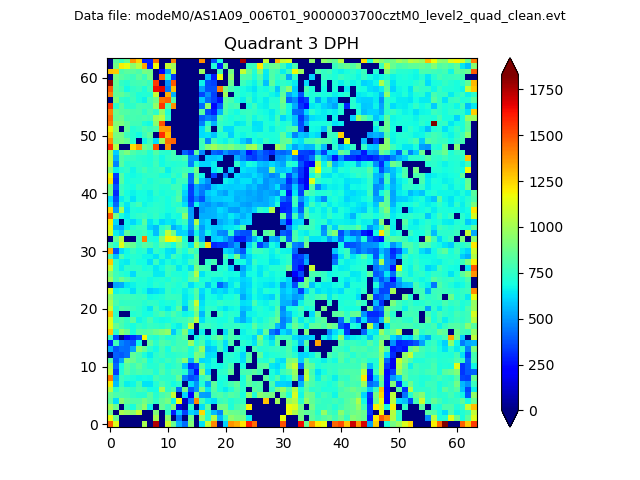 |
 |
Quadrant C |
| Plot type | Count rate plots | Images |
|---|---|---|
| Comparison with Poisson distribution Blue bars denote a histogram of data divided into 1 sec bins. Red curve is a Poisson curve with rate = median count rate of data. |
 |
 |
| Quadrant-wise count rates Data is divided into 100 sec bins |
 |
|
| Module-wise count rates for Quadrant A Data is divided into 100 sec bins |
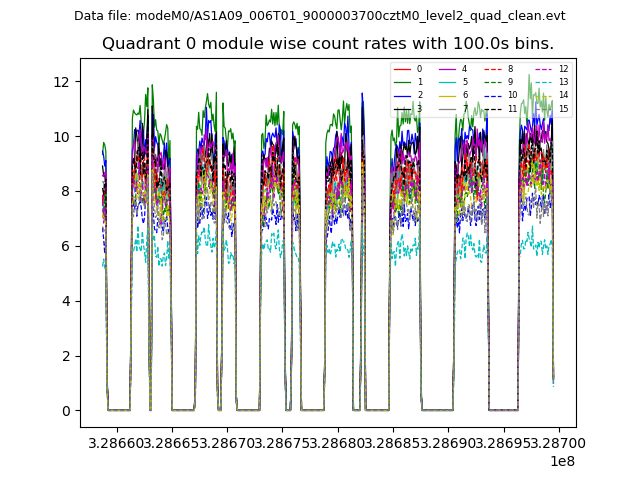 |
 |
| Module-wise count rates for Quadrant B Data is divided into 100 sec bins |
 |
 |
| Module-wise count rates for Quadrant C Data is divided into 100 sec bins |
 |
 |
| Module-wise count rates for Quadrant D Data is divided into 100 sec bins |
 |
 |
| Parameter | Plot |
|---|---|
| CZT HV Monitor |  |
| D_VDD |  |
| Temperature 1 | 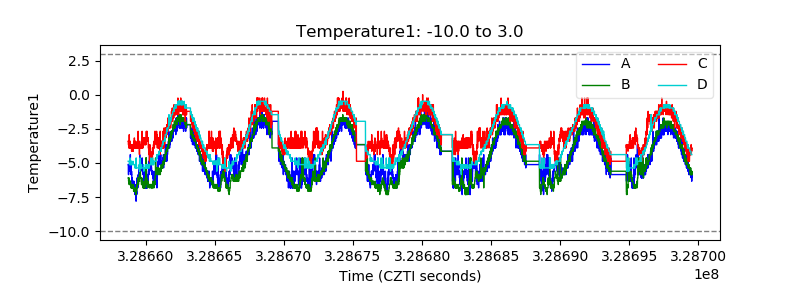 |
| Veto HV Monitor |  |
| Veto LLD |  |
| Alpha Counter |  |
| _CPM_Rate |  |
| CZT Counter |  |
| +2.5 Volts monitor |  |
| +5 Volts monitor |  |
| _ROLL_ROT |  |
| _Roll_DEC | 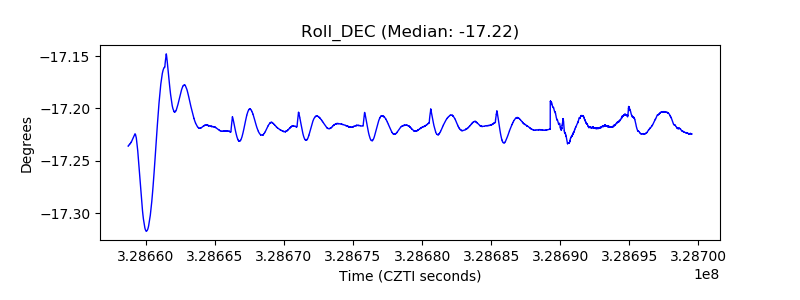 |
| _Roll_RA |  |
| Veto Counter |  |