| Param | Original file | Final file |
|---|---|---|
| Filename | modeM0/AS1A09_006T01_9000003700_25278cztM0_level2.evt | modeM0/AS1A09_006T01_9000003700_25278cztM0_level2_quad_clean.evt |
| Size (bytes) | 544,584,960 | 73,673,280 |
| Size | 519.4 MB | 70.3 MB |
| Events in quadrant A | 2,756,661 | 481,774 |
| Events in quadrant B | 4,489,523 | 443,123 |
| Events in quadrant C | 2,905,005 | 458,956 |
| Events in quadrant D | 5,945,307 | 437,684 |
| Mode M9 | |||
|---|---|---|---|
| Quadrant | BADHDUFLAG | Total packets | Discarded packets |
| A | 0 | 3 | 0 |
| B | 0 | 3 | 0 |
| C | 0 | 3 | 0 |
| D | 0 | 3 | 0 |
| Mode M0 | |||
|---|---|---|---|
| Quadrant | BADHDUFLAG | Total packets | Discarded packets |
| A | 0 | 12040 | 0 |
| B | 0 | 17038 | 0 |
| C | 0 | 12333 | 0 |
| D | 0 | 21789 | 0 |
| Quadrant | Total seconds | Saturated seconds | Saturation percentage |
|---|---|---|---|
| A | 5855 | 27 | 0.461144% |
| B | 5855 | 699 | 11.938514% |
| C | 5855 | 64 | 1.093083% |
| D | 5854 | 254 | 4.338914% |
Noise dominated data is calculated using 1-second bins in cleaned event files. If a bin has >2000 counts, and if more than 50% of those come from <1% of pixels, then it is considered to be noise-dominated and hence unusable.
| Quadrant | # 1 sec bins | Bins with >0 counts | Bins with >2000 counts | High rate bins dominated by noise | Noise dominated (total time) | Noise dominated (detector-on time) | Marked lightcurve |
|---|---|---|---|---|---|---|---|
| A | 6125 | 5856 | 0 | 0 | 0.00% | 0.00% | 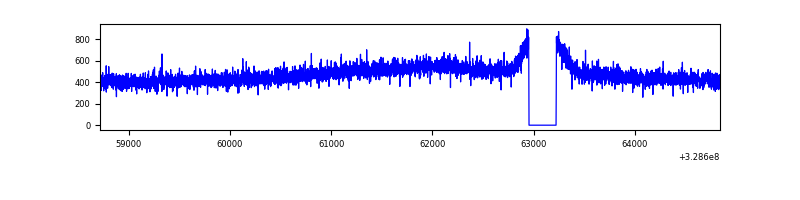 |
| B | 6125 | 5856 | 404 | 404 | 6.60% | 6.90% | 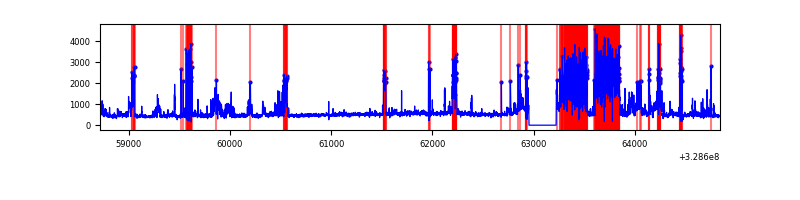 |
| C | 6125 | 5856 | 2 | 2 | 0.03% | 0.03% | 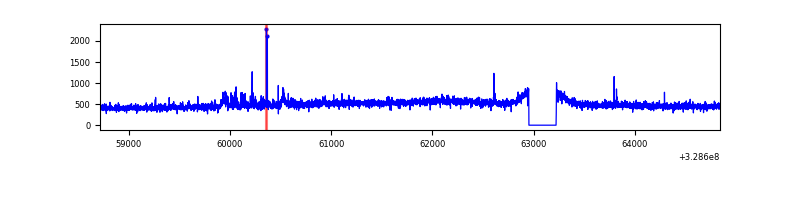 |
| D | 6124 | 5855 | 164 | 164 | 2.68% | 2.80% | 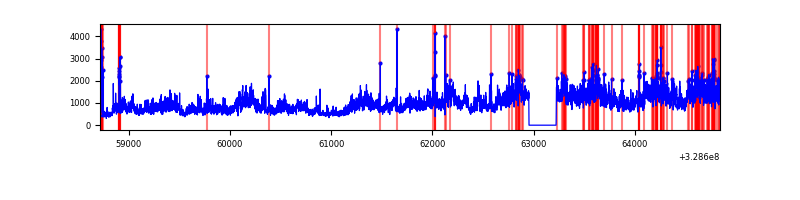 |
Top three noisy pixels from each quadrant. If the there are fewer than three noisy pixels in the level2.evt file, extra rows are filled as -1
| Pixel properties | Quadrant properties | ||||||
|---|---|---|---|---|---|---|---|
| Quadrant | DetID | PixID | Counts | Sigma | Mean | Median | Sigma |
| A | 13 | 254 | 9156 | 58.37 | 714 | 699 | 144.9 |
| A | 3 | 137 | 6584 | 40.62 | 714 | 699 | 144.9 |
| A | 0 | 226 | 6165 | 37.73 | 714 | 699 | 144.9 |
| B | 3 | 64 | 1806445 | 13946.52 | 673 | 654 | 129.5 |
| B | 3 | 112 | 36528 | 277.06 | 673 | 654 | 129.5 |
| B | 12 | 111 | 15973 | 118.31 | 673 | 654 | 129.5 |
| C | 14 | 238 | 107735 | 667.94 | 679 | 682 | 160.3 |
| C | 0 | 207 | 47559 | 292.48 | 679 | 682 | 160.3 |
| C | 0 | 239 | 42414 | 260.38 | 679 | 682 | 160.3 |
| D | 8 | 195 | 2832352 | 16889.09 | 684 | 664 | 167.7 |
| D | 1 | 52 | 485978 | 2894.57 | 684 | 664 | 167.7 |
| D | 2 | 234 | 26918 | 156.59 | 684 | 664 | 167.7 |
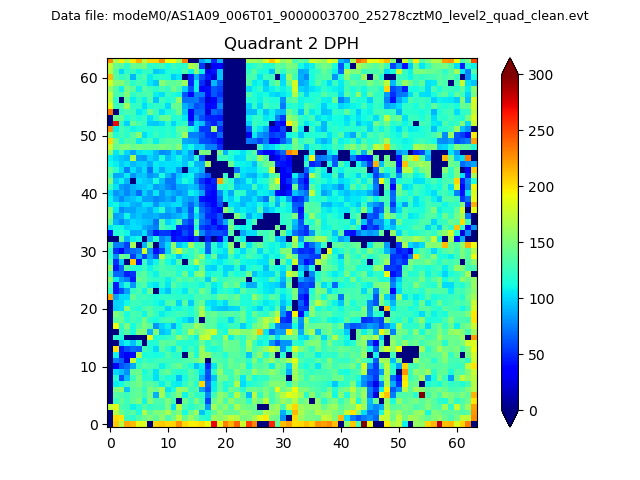
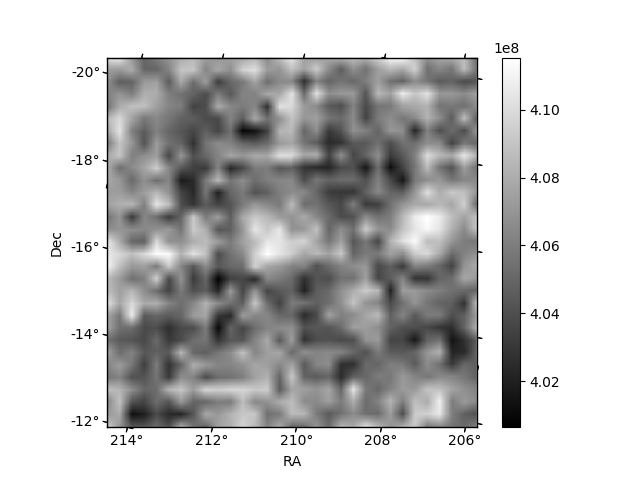
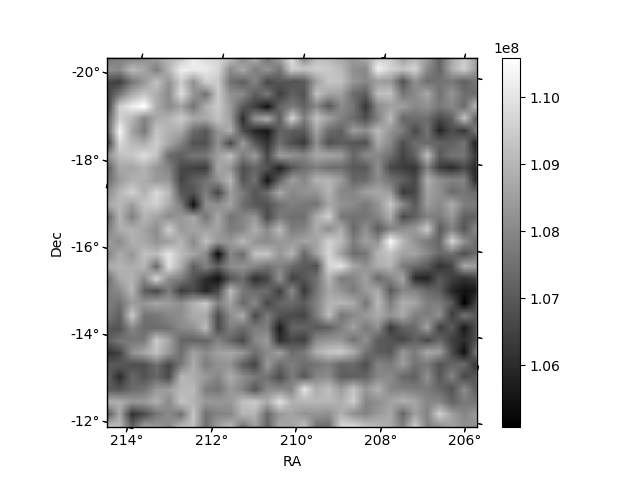
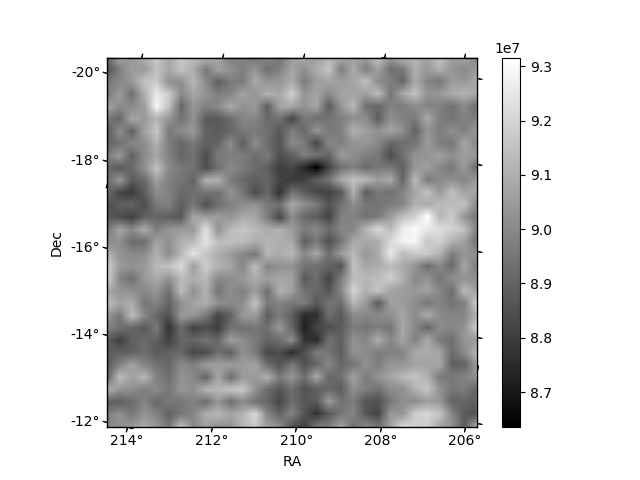
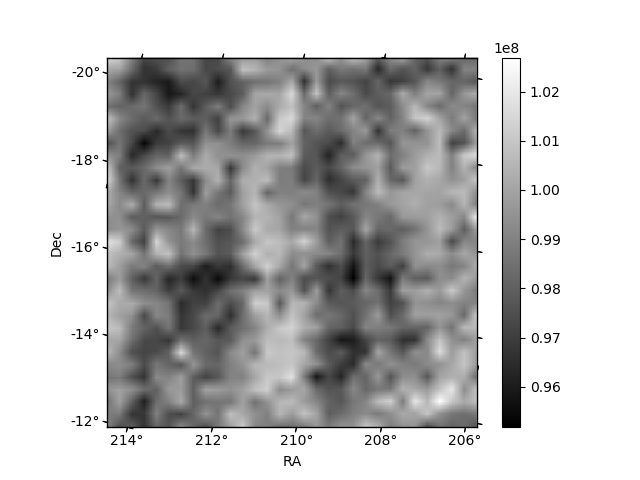
Histogram calculated using DETX and DETY for each event in the final _common_clean file
| Quadrant A | 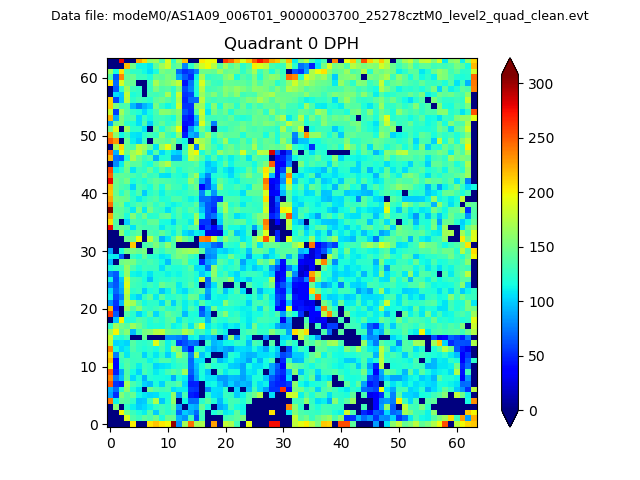 |
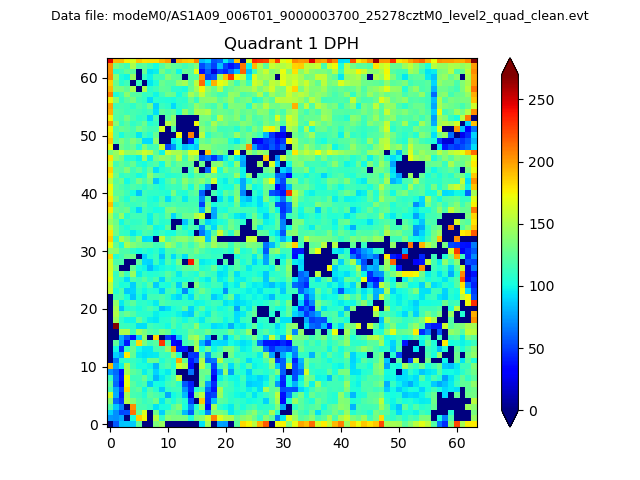 |
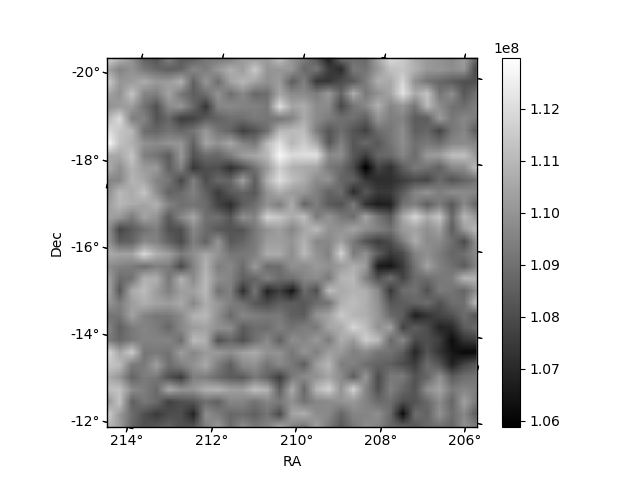
Quadrant B |
|---|---|---|---|
| Quadrant D | 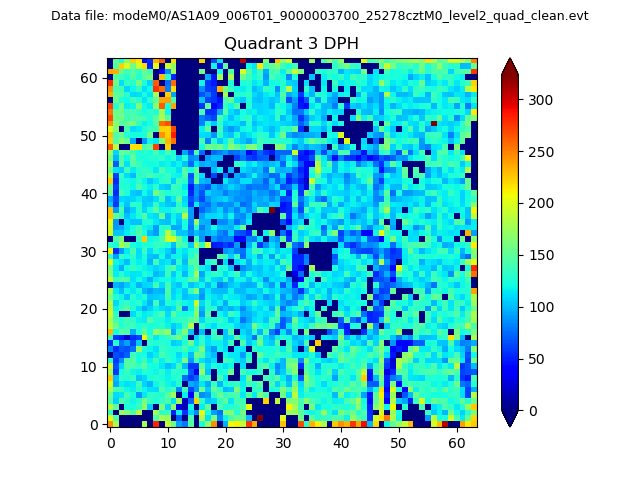 |
 |
Quadrant C |
| Plot type | Count rate plots | Images |
|---|---|---|
| Comparison with Poisson distribution Blue bars denote a histogram of data divided into 1 sec bins. Red curve is a Poisson curve with rate = median count rate of data. |
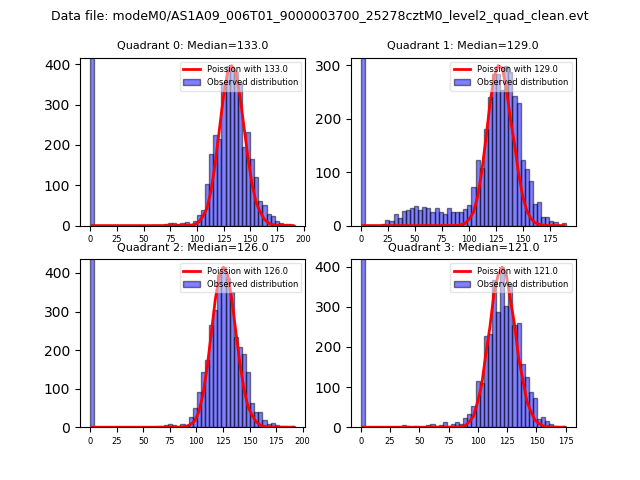 |
 |
| Quadrant-wise count rates Data is divided into 100 sec bins |
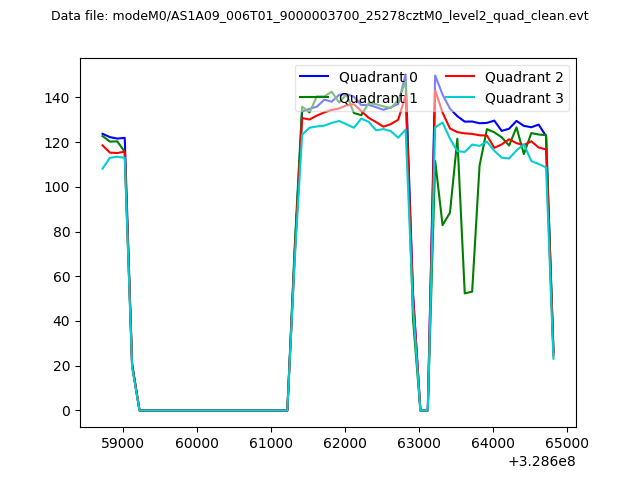 |
|
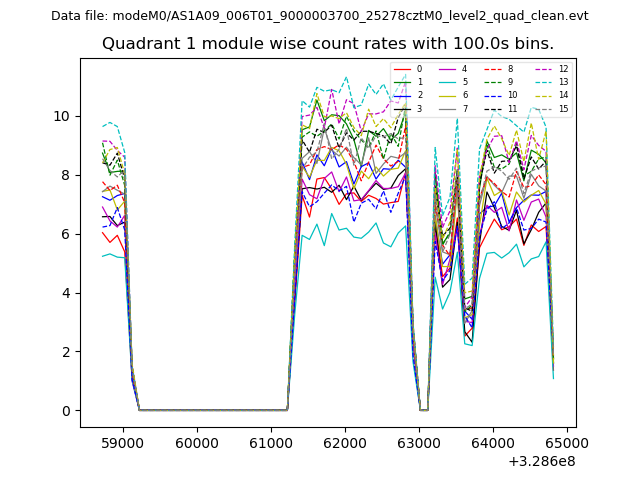
| Module-wise count rates for Quadrant A Data is divided into 100 sec bins |
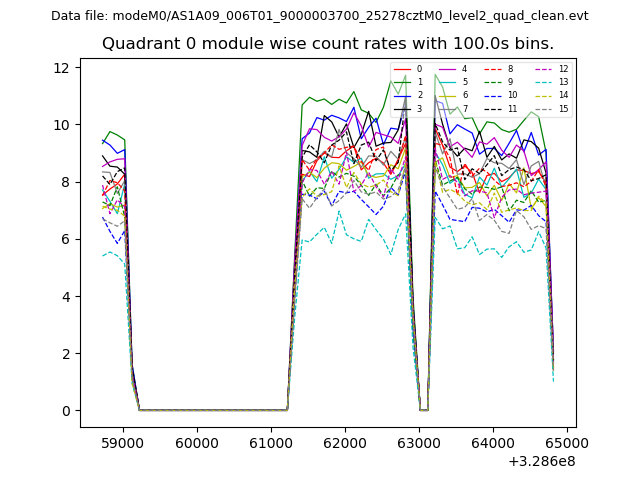 |
 |
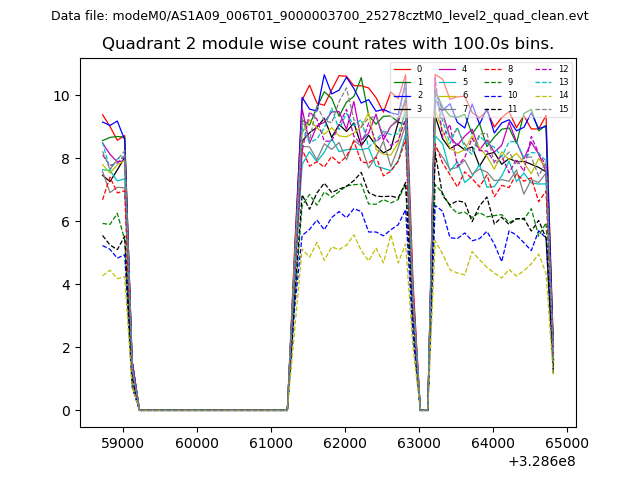
| Module-wise count rates for Quadrant B Data is divided into 100 sec bins |
 |
 |
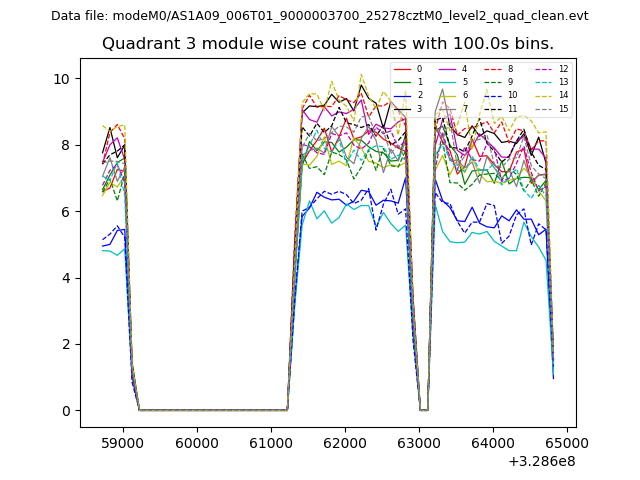
| Module-wise count rates for Quadrant C Data is divided into 100 sec bins |
 |
 |
| Module-wise count rates for Quadrant D Data is divided into 100 sec bins |
 |
 |
| Parameter | Plot |
|---|---|
| CZT HV Monitor | 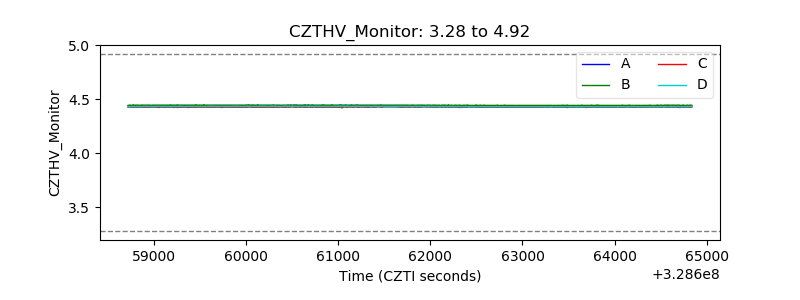 |
| D_VDD | 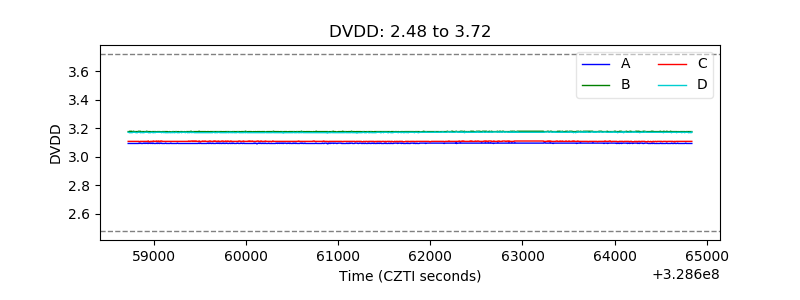 |
| Temperature 1 | 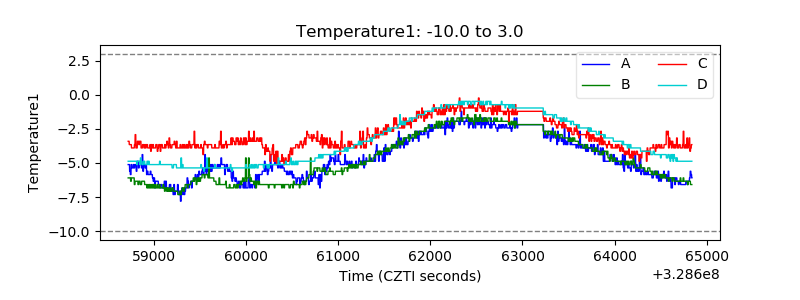 |
| Veto HV Monitor | 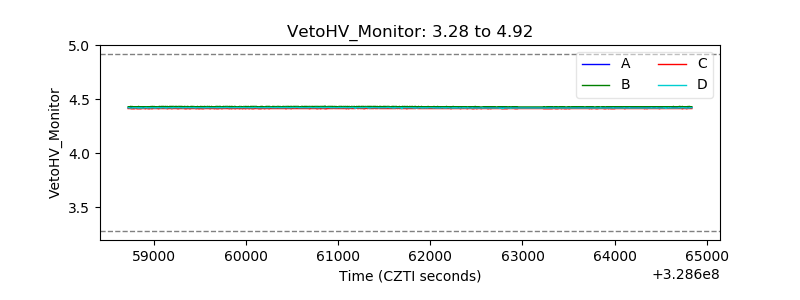 |
| Veto LLD | 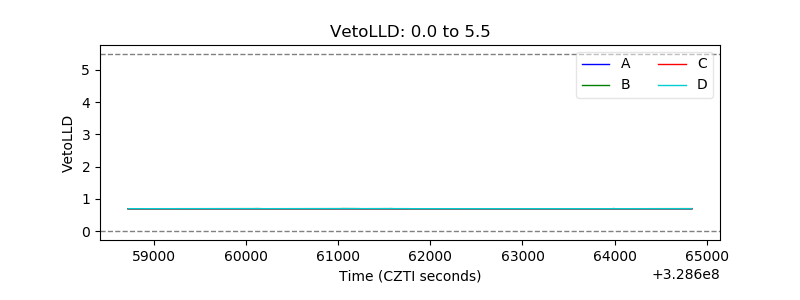 |
| Alpha Counter | 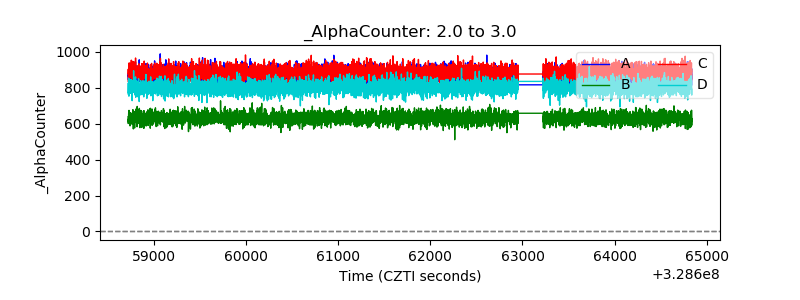 |
| _CPM_Rate | 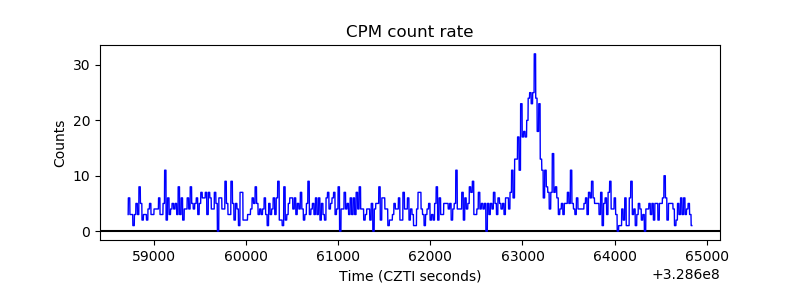 |
| CZT Counter | 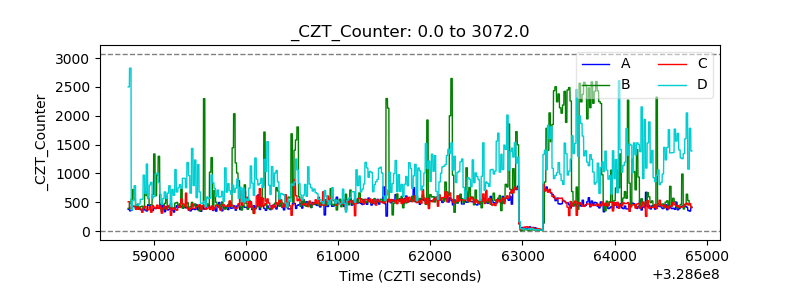 |
| +2.5 Volts monitor |  |
| +5 Volts monitor |  |
| _ROLL_ROT | 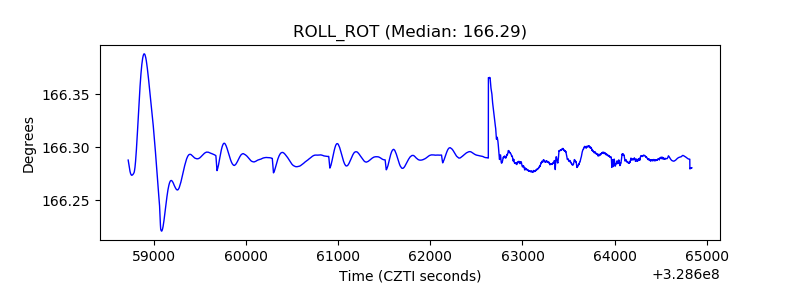 |
| _Roll_DEC | 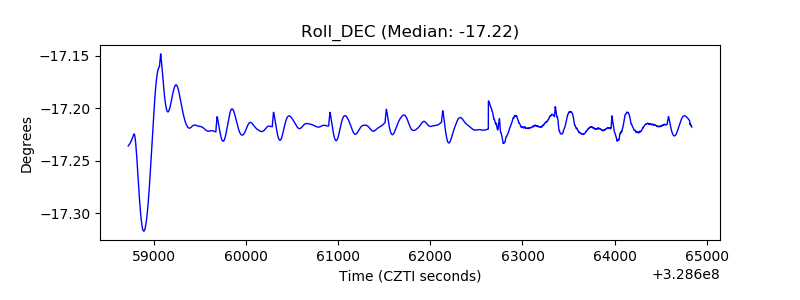 |
| _Roll_RA | 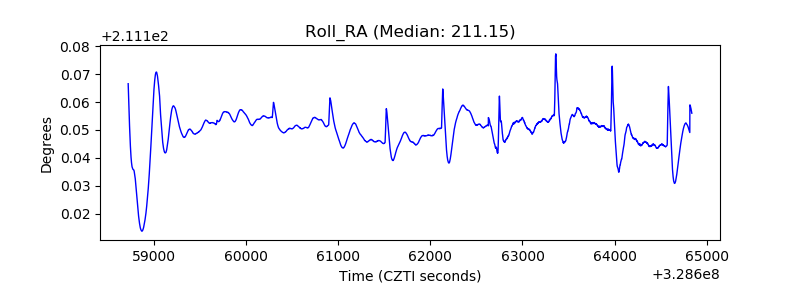 |
| Veto Counter | 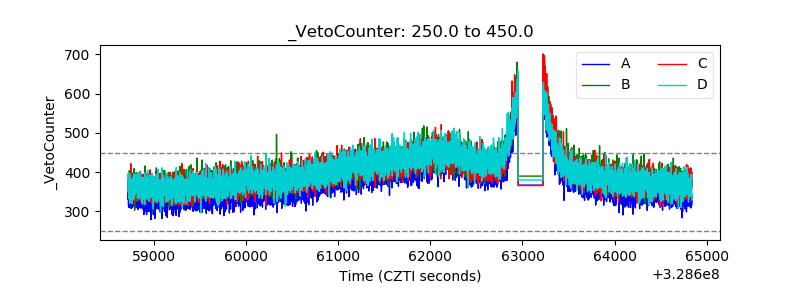 |