| Param | Original file | Final file |
|---|---|---|
| Filename | modeM0/AS1A09_006T01_9000003700_25279cztM0_level2.evt | modeM0/AS1A09_006T01_9000003700_25279cztM0_level2_quad_clean.evt |
| Size (bytes) | 714,254,400 | 95,417,280 |
| Size | 681.2 MB | 91.0 MB |
| Events in quadrant A | 3,416,222 | 626,839 |
| Events in quadrant B | 4,793,127 | 600,753 |
| Events in quadrant C | 3,936,835 | 591,955 |
| Events in quadrant D | 8,986,514 | 555,955 |
| Mode M9 | |||
|---|---|---|---|
| Quadrant | BADHDUFLAG | Total packets | Discarded packets |
| A | 0 | 5 | 0 |
| B | 0 | 5 | 0 |
| C | 0 | 5 | 0 |
| D | 0 | 5 | 0 |
| Mode M0 | |||
|---|---|---|---|
| Quadrant | BADHDUFLAG | Total packets | Discarded packets |
| A | 0 | 15014 | 0 |
| B | 0 | 19043 | 0 |
| C | 0 | 16339 | 0 |
| D | 0 | 31934 | 0 |
| Quadrant | Total seconds | Saturated seconds | Saturation percentage |
|---|---|---|---|
| A | 7377 | 33 | 0.447336% |
| B | 7378 | 481 | 6.519382% |
| C | 7378 | 169 | 2.290594% |
| D | 7377 | 678 | 9.190728% |
Noise dominated data is calculated using 1-second bins in cleaned event files. If a bin has >2000 counts, and if more than 50% of those come from <1% of pixels, then it is considered to be noise-dominated and hence unusable.
| Quadrant | # 1 sec bins | Bins with >0 counts | Bins with >2000 counts | High rate bins dominated by noise | Noise dominated (total time) | Noise dominated (detector-on time) | Marked lightcurve |
|---|---|---|---|---|---|---|---|
| A | 7842 | 7378 | 2 | 2 | 0.03% | 0.03% | 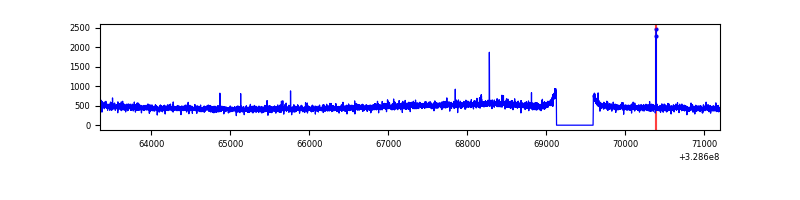 |
| B | 7843 | 7379 | 298 | 298 | 3.80% | 4.04% | 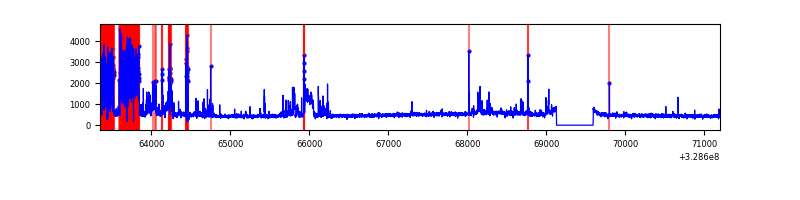 |
| C | 7842 | 7378 | 83 | 83 | 1.06% | 1.12% | 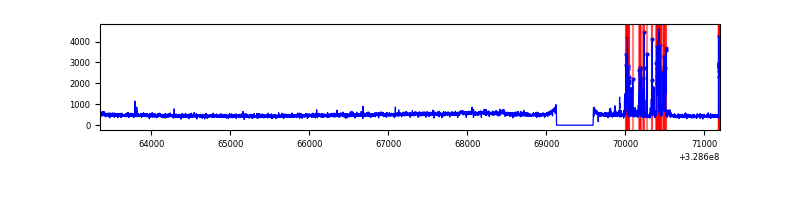 |
| D | 7842 | 7378 | 587 | 587 | 7.49% | 7.96% | 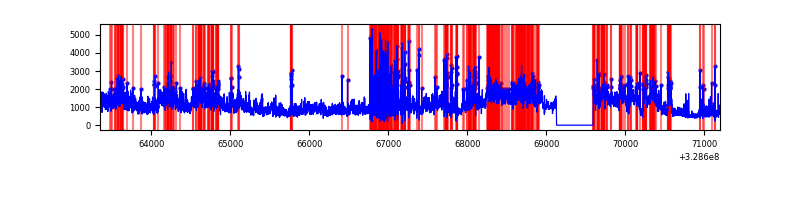 |
Top three noisy pixels from each quadrant. If the there are fewer than three noisy pixels in the level2.evt file, extra rows are filled as -1
| Pixel properties | Quadrant properties | ||||||
|---|---|---|---|---|---|---|---|
| Quadrant | DetID | PixID | Counts | Sigma | Mean | Median | Sigma |
| A | 13 | 254 | 11189 | 57.31 | 884 | 866 | 180.1 |
| A | 13 | 170 | 8728 | 43.65 | 884 | 866 | 180.1 |
| A | 3 | 137 | 7994 | 39.57 | 884 | 866 | 180.1 |
| B | 3 | 64 | 1418324 | 8624.3 | 852 | 831 | 164.4 |
| B | 3 | 112 | 21375 | 124.99 | 852 | 831 | 164.4 |
| B | 12 | 111 | 20106 | 117.27 | 852 | 831 | 164.4 |
| C | 0 | 239 | 526745 | 2683.34 | 831 | 836 | 196.0 |
| C | 14 | 238 | 131847 | 668.46 | 831 | 836 | 196.0 |
| C | 3 | 233 | 21618 | 106.04 | 831 | 836 | 196.0 |
| D | 8 | 195 | 3658471 | 18013.68 | 826 | 799 | 203.0 |
| D | 1 | 52 | 2149298 | 10581.15 | 826 | 799 | 203.0 |
| D | 2 | 234 | 33476 | 160.93 | 826 | 799 | 203.0 |
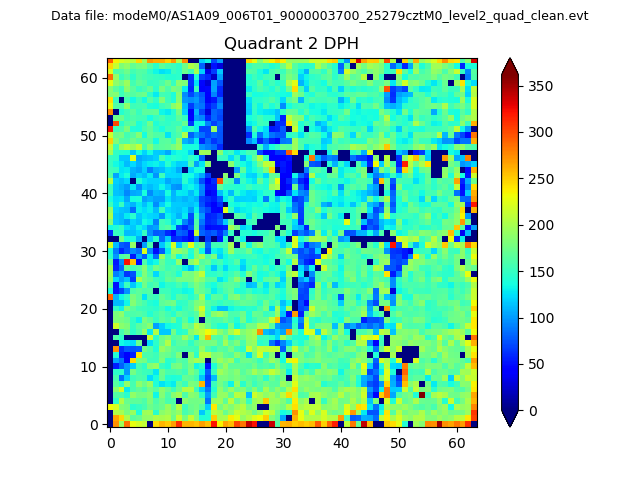
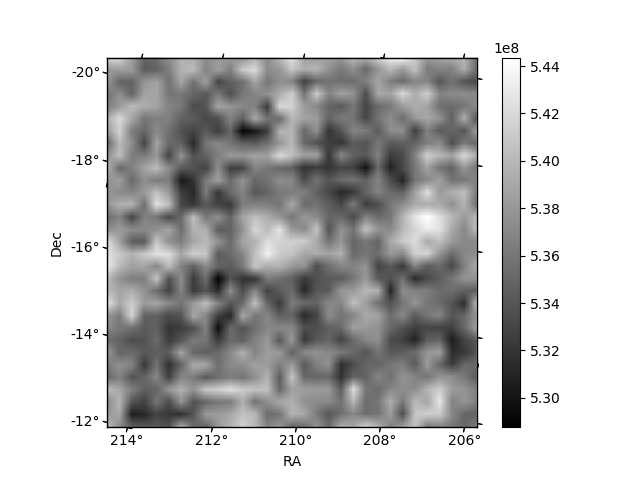
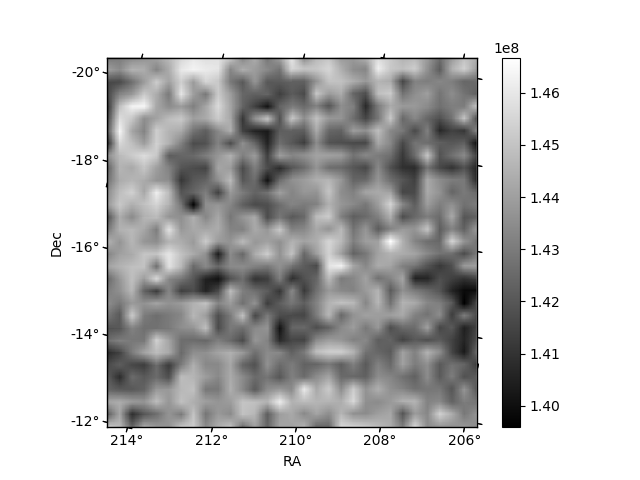
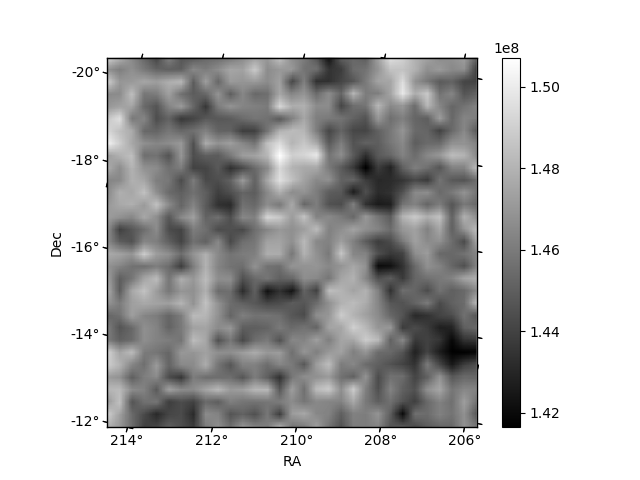
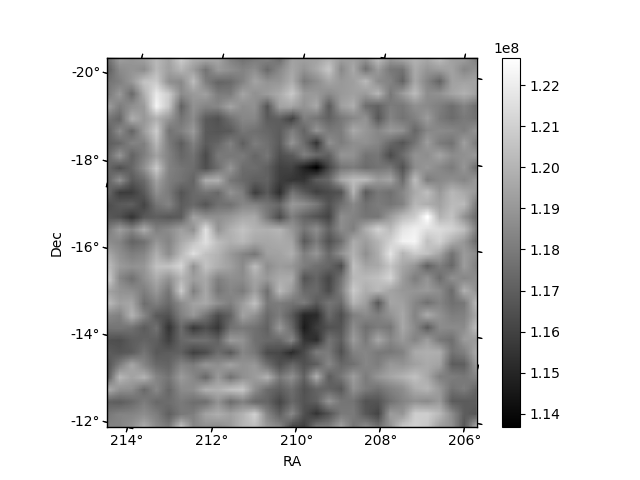
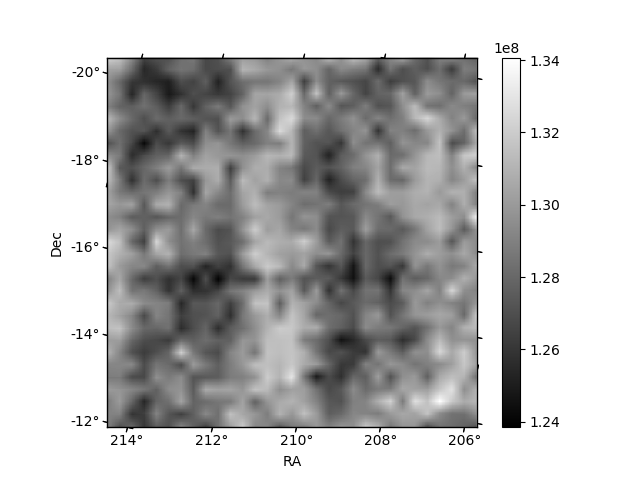
Histogram calculated using DETX and DETY for each event in the final _common_clean file
| Quadrant A | 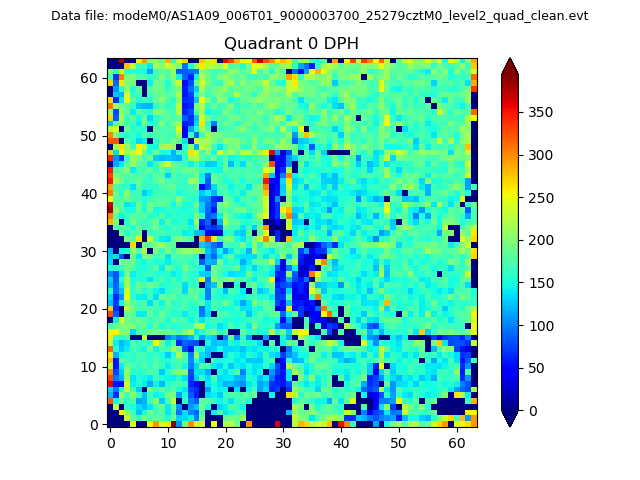 |
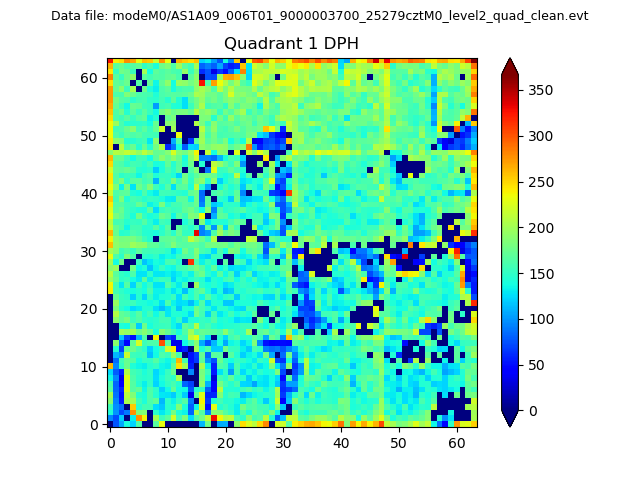 |
Quadrant B |
|---|---|---|---|
| Quadrant D | 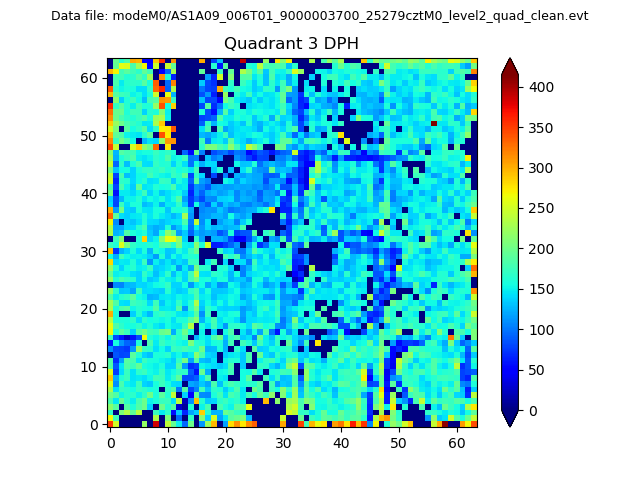 |
 |
Quadrant C |
| Plot type | Count rate plots | Images |
|---|---|---|
| Comparison with Poisson distribution Blue bars denote a histogram of data divided into 1 sec bins. Red curve is a Poisson curve with rate = median count rate of data. |
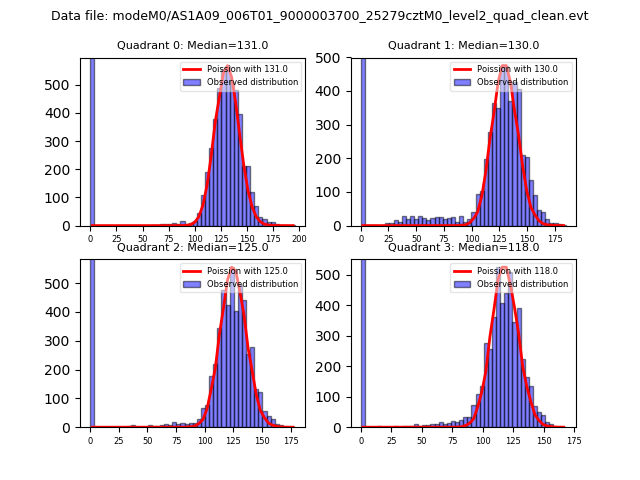 |
 |
| Quadrant-wise count rates Data is divided into 100 sec bins |
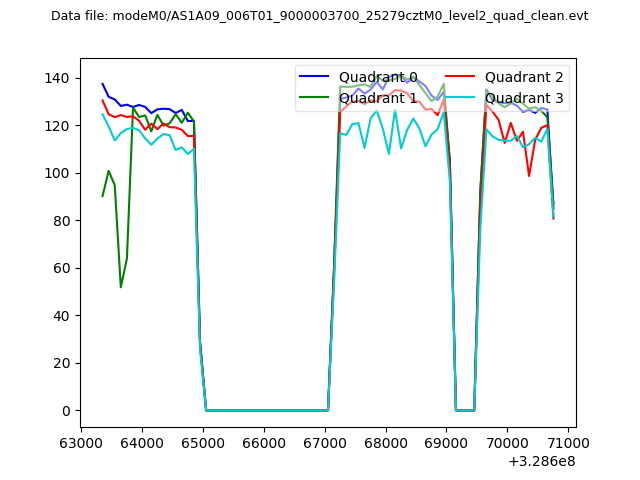 |
|
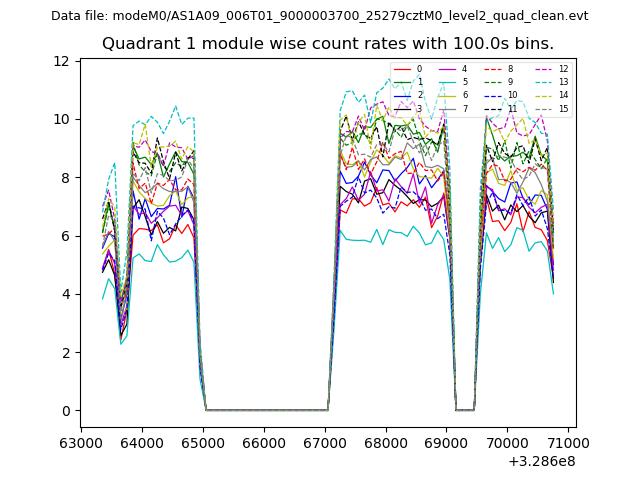
| Module-wise count rates for Quadrant A Data is divided into 100 sec bins |
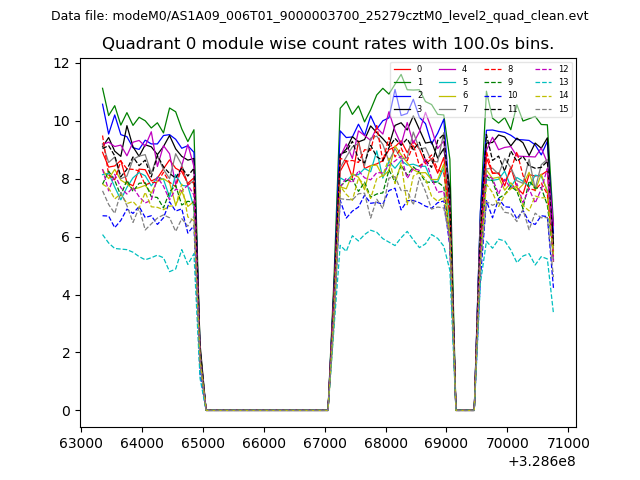 |
 |
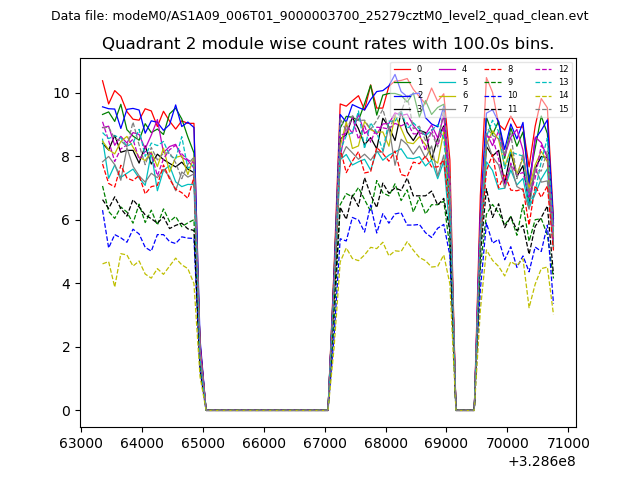
| Module-wise count rates for Quadrant B Data is divided into 100 sec bins |
 |
 |
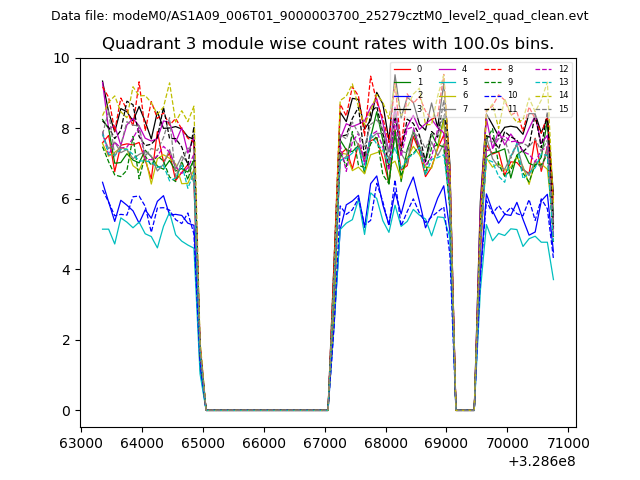
| Module-wise count rates for Quadrant C Data is divided into 100 sec bins |
 |
 |
| Module-wise count rates for Quadrant D Data is divided into 100 sec bins |
 |
 |
| Parameter | Plot |
|---|---|
| CZT HV Monitor |  |
| D_VDD | 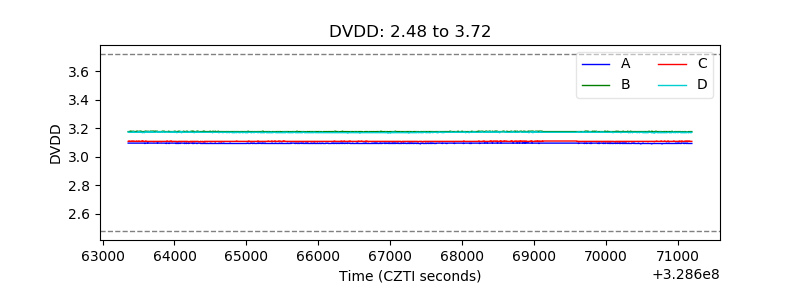 |
| Temperature 1 | 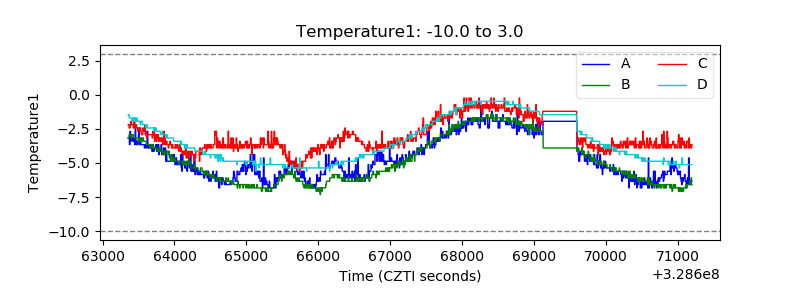 |
| Veto HV Monitor | 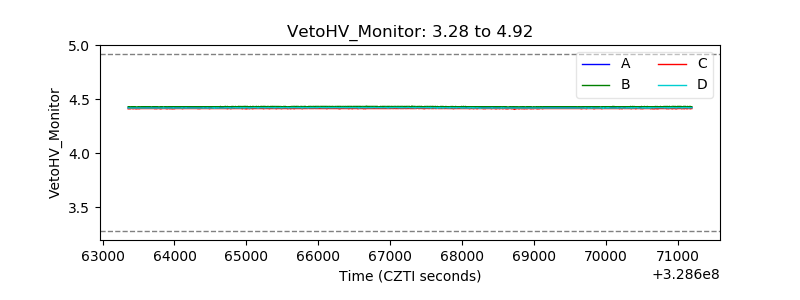 |
| Veto LLD | 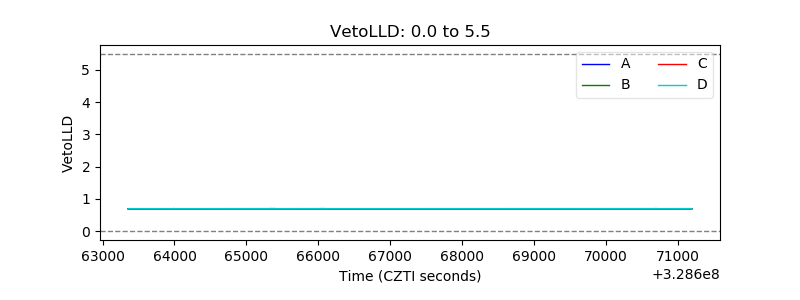 |
| Alpha Counter | 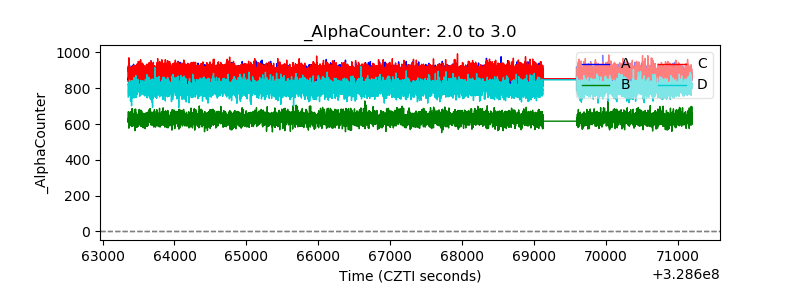 |
| _CPM_Rate | 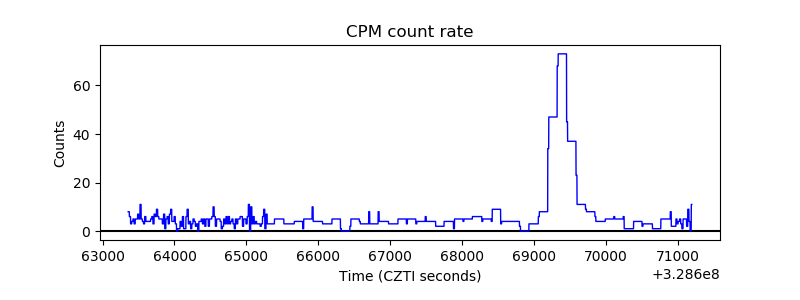 |
| CZT Counter | 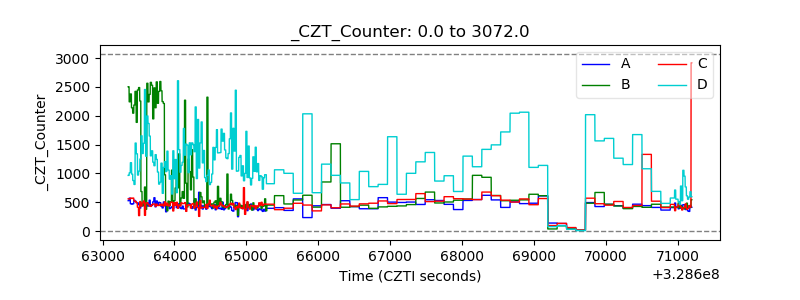 |
| +2.5 Volts monitor | 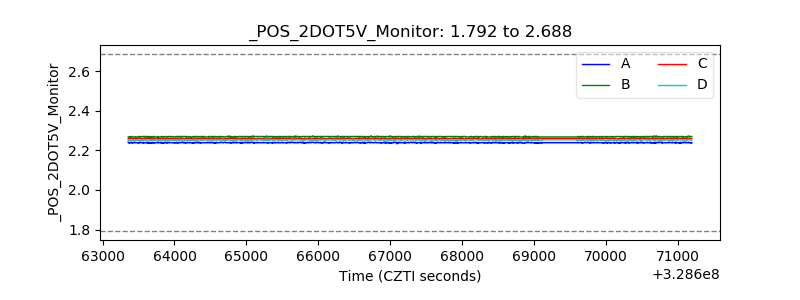 |
| +5 Volts monitor | 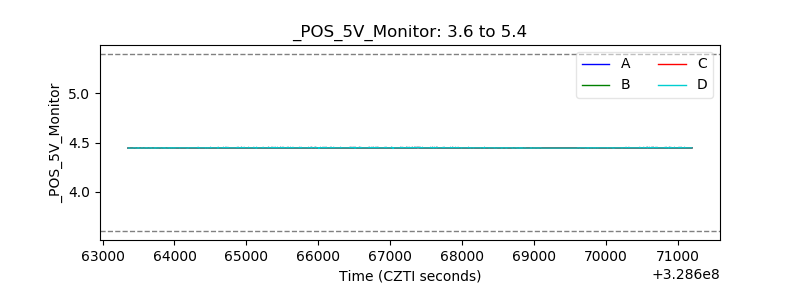 |
| _ROLL_ROT | 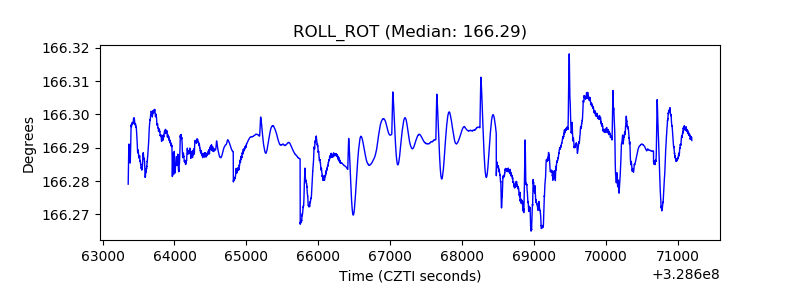 |
| _Roll_DEC | 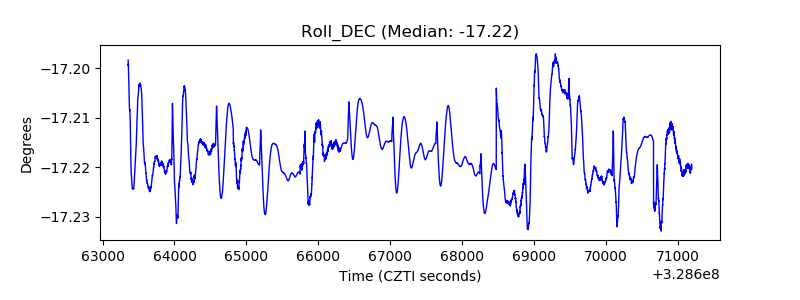 |
| _Roll_RA | 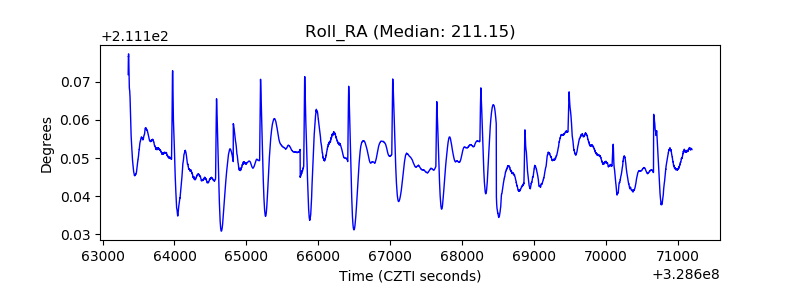 |
| Veto Counter | 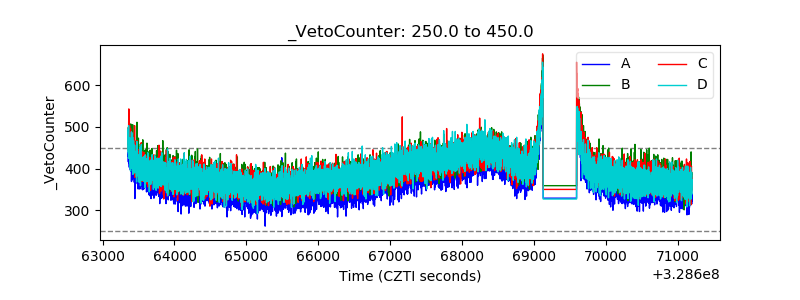 |