| Param | Original file | Final file |
|---|---|---|
| Filename | modeM0/AS1A09_006T01_9000003700_25281cztM0_level2.evt | modeM0/AS1A09_006T01_9000003700_25281cztM0_level2_quad_clean.evt |
| Size (bytes) | 972,201,600 | 147,173,760 |
| Size | 927.2 MB | 140.4 MB |
| Events in quadrant A | 5,920,635 | 925,796 |
| Events in quadrant B | 6,580,047 | 929,241 |
| Events in quadrant C | 6,784,172 | 874,092 |
| Events in quadrant D | 9,301,471 | 851,805 |
| Mode M9 | |||
|---|---|---|---|
| Quadrant | BADHDUFLAG | Total packets | Discarded packets |
| A | 0 | 15 | 0 |
| B | 0 | 15 | 0 |
| C | 0 | 15 | 0 |
| D | 0 | 15 | 0 |
| Mode M0 | |||
|---|---|---|---|
| Quadrant | BADHDUFLAG | Total packets | Discarded packets |
| A | 0 | 25721 | 0 |
| B | 0 | 27574 | 0 |
| C | 0 | 28148 | 0 |
| D | 0 | 36142 | 0 |
| Quadrant | Total seconds | Saturated seconds | Saturation percentage |
|---|---|---|---|
| A | 12678 | 46 | 0.362833% |
| B | 12679 | 285 | 2.247811% |
| C | 12679 | 314 | 2.476536% |
| D | 12679 | 438 | 3.454531% |
Noise dominated data is calculated using 1-second bins in cleaned event files. If a bin has >2000 counts, and if more than 50% of those come from <1% of pixels, then it is considered to be noise-dominated and hence unusable.
| Quadrant | # 1 sec bins | Bins with >0 counts | Bins with >2000 counts | High rate bins dominated by noise | Noise dominated (total time) | Noise dominated (detector-on time) | Marked lightcurve |
|---|---|---|---|---|---|---|---|
| A | 14123 | 12680 | 2 | 2 | 0.01% | 0.02% | 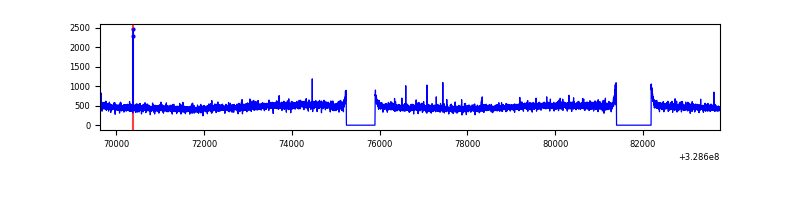 |
| B | 14124 | 12681 | 112 | 112 | 0.79% | 0.88% | 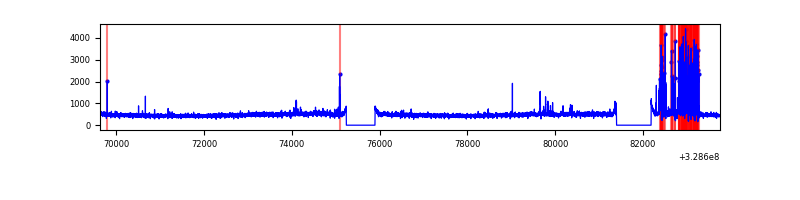 |
| C | 14124 | 12681 | 187 | 187 | 1.32% | 1.47% | 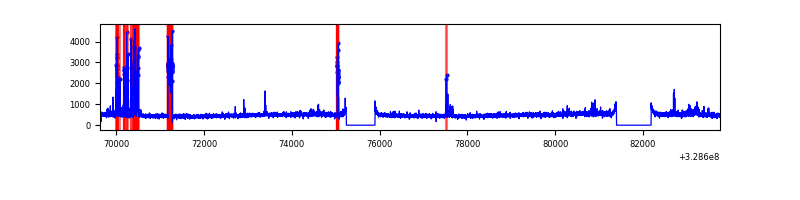 |
| D | 14124 | 12681 | 384 | 384 | 2.72% | 3.03% | 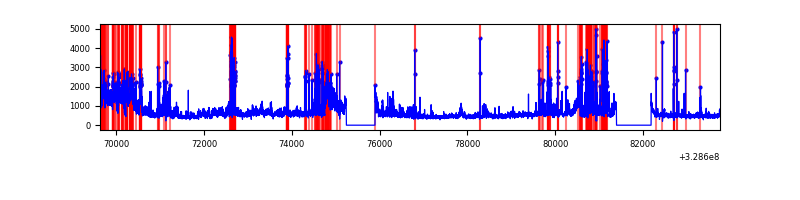 |
Top three noisy pixels from each quadrant. If the there are fewer than three noisy pixels in the level2.evt file, extra rows are filled as -1
| Pixel properties | Quadrant properties | ||||||
|---|---|---|---|---|---|---|---|
| Quadrant | DetID | PixID | Counts | Sigma | Mean | Median | Sigma |
| A | 13 | 254 | 19728 | 59.15 | 1533 | 1501 | 308.1 |
| A | 3 | 137 | 14272 | 41.44 | 1533 | 1501 | 308.1 |
| A | 0 | 226 | 12981 | 37.25 | 1533 | 1501 | 308.1 |
| B | 3 | 64 | 615968 | 2120.11 | 1507 | 1471 | 289.8 |
| B | 12 | 111 | 35912 | 118.82 | 1507 | 1471 | 289.8 |
| B | 11 | 111 | 31694 | 104.27 | 1507 | 1471 | 289.8 |
| C | 0 | 239 | 735437 | 2173.57 | 1440 | 1449 | 337.7 |
| C | 14 | 238 | 228037 | 671.0 | 1440 | 1449 | 337.7 |
| C | 0 | 207 | 144829 | 424.59 | 1440 | 1449 | 337.7 |
| D | 1 | 52 | 2044324 | 5771.71 | 1462 | 1420 | 354.0 |
| D | 8 | 195 | 1522375 | 4297.08 | 1462 | 1420 | 354.0 |
| D | 5 | 222 | 105911 | 295.21 | 1462 | 1420 | 354.0 |
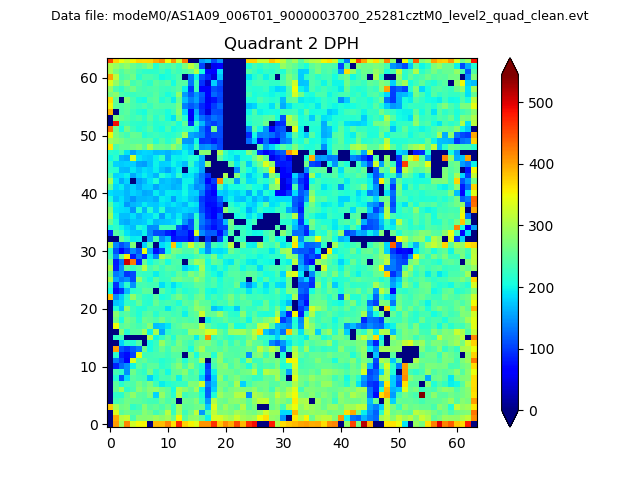
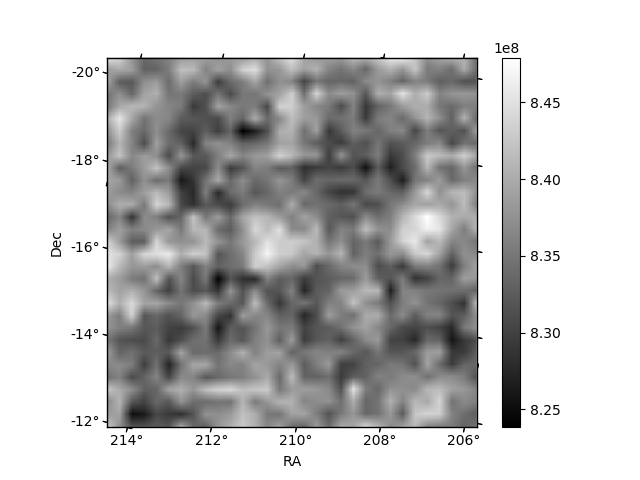
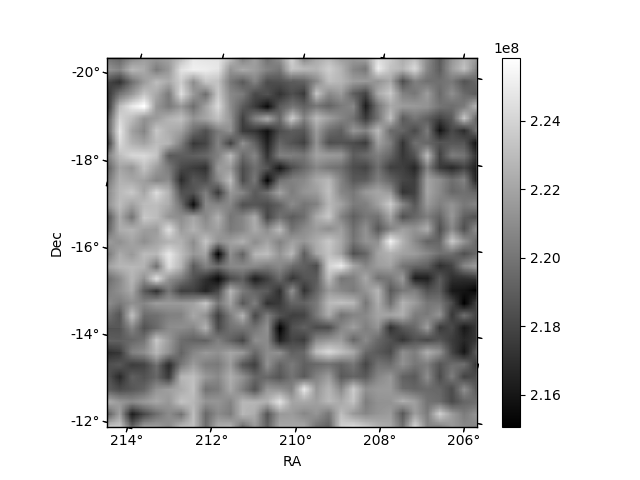
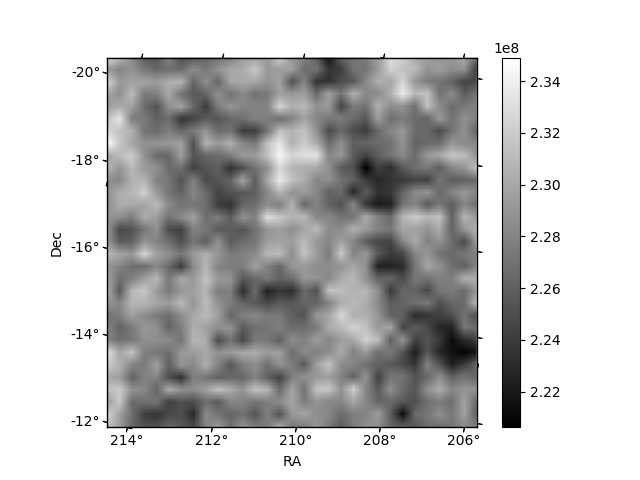
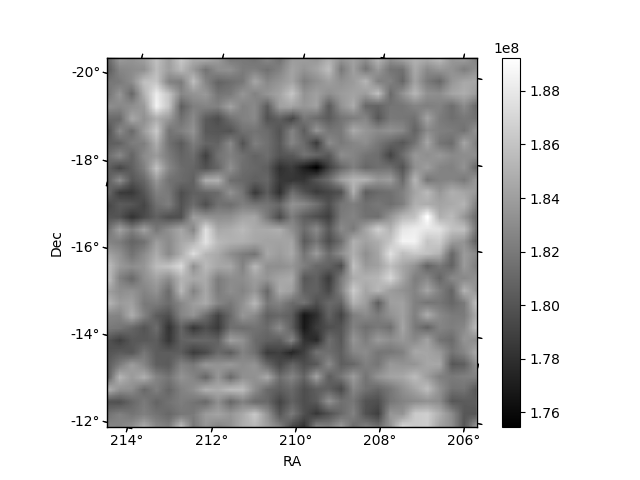
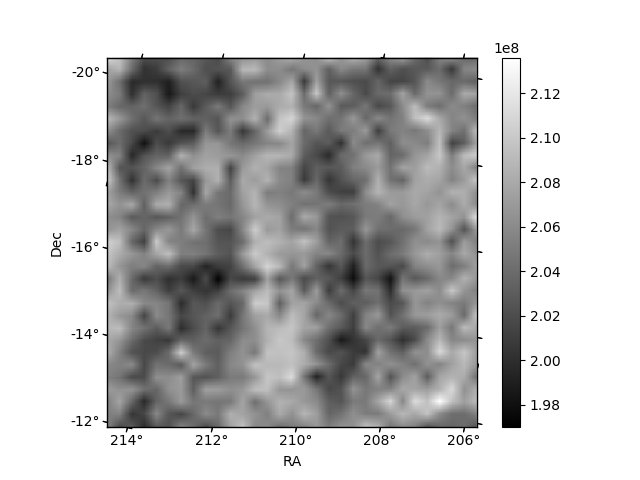
Histogram calculated using DETX and DETY for each event in the final _common_clean file
| Quadrant A | 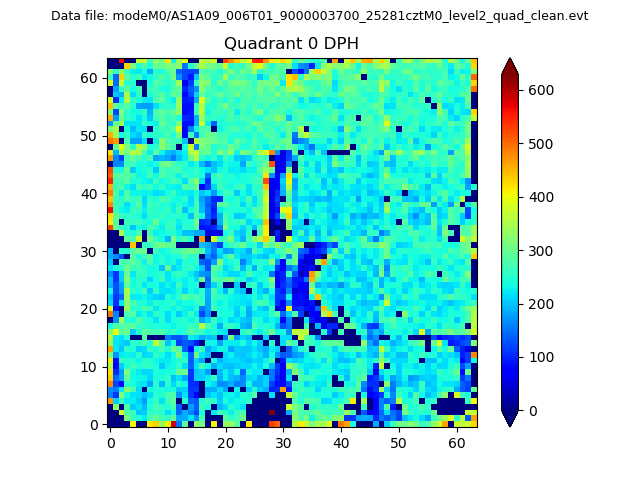 |
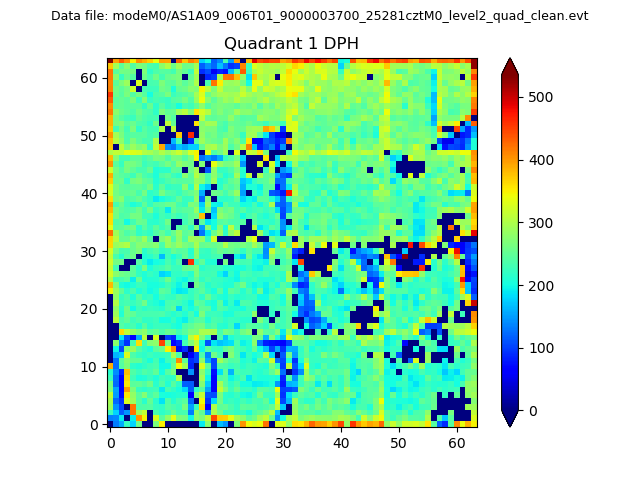 |
Quadrant B |
|---|---|---|---|
| Quadrant D | 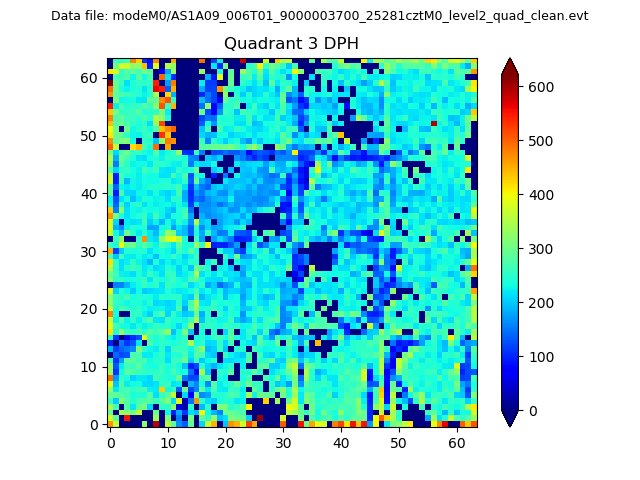 |
 |
Quadrant C |
| Plot type | Count rate plots | Images |
|---|---|---|
| Comparison with Poisson distribution Blue bars denote a histogram of data divided into 1 sec bins. Red curve is a Poisson curve with rate = median count rate of data. |
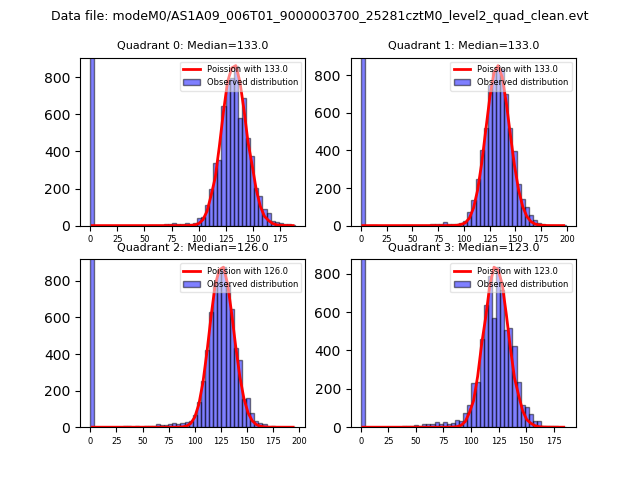 |
 |
| Quadrant-wise count rates Data is divided into 100 sec bins |
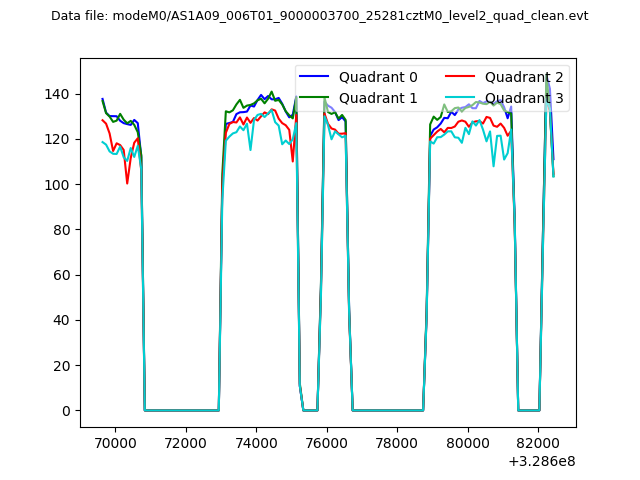 |
|
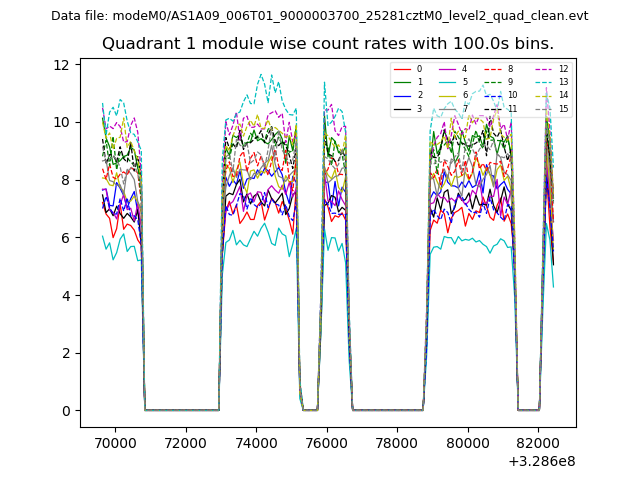
| Module-wise count rates for Quadrant A Data is divided into 100 sec bins |
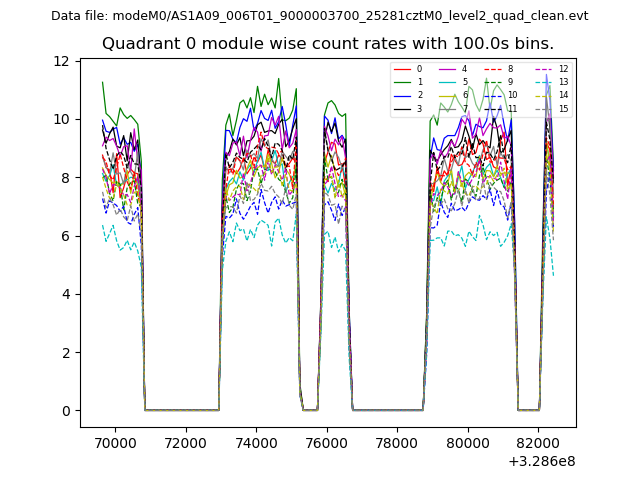 |
 |
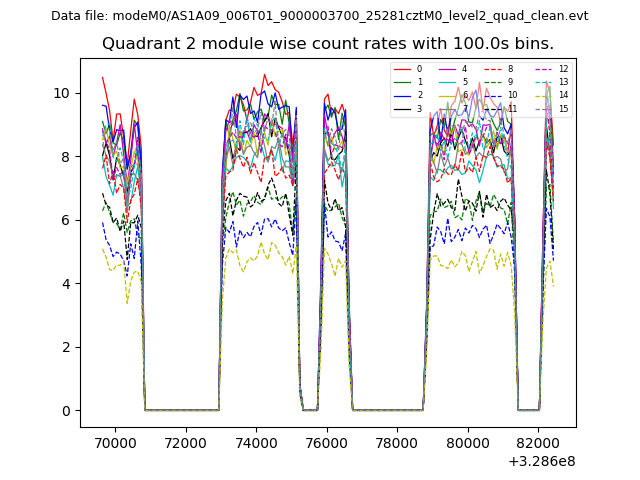
| Module-wise count rates for Quadrant B Data is divided into 100 sec bins |
 |
 |
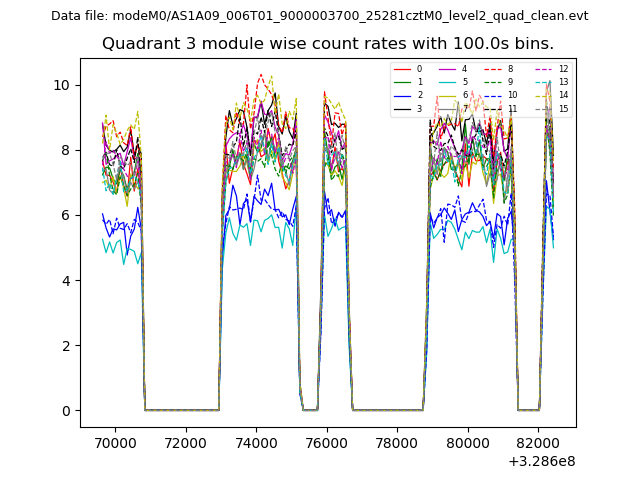
| Module-wise count rates for Quadrant C Data is divided into 100 sec bins |
 |
 |
| Module-wise count rates for Quadrant D Data is divided into 100 sec bins |
 |
 |
| Parameter | Plot |
|---|---|
| CZT HV Monitor | 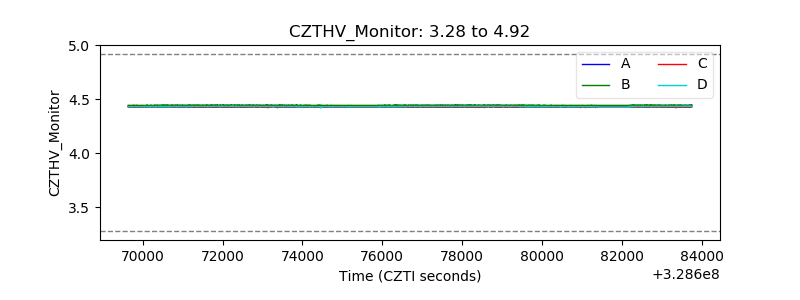 |
| D_VDD | 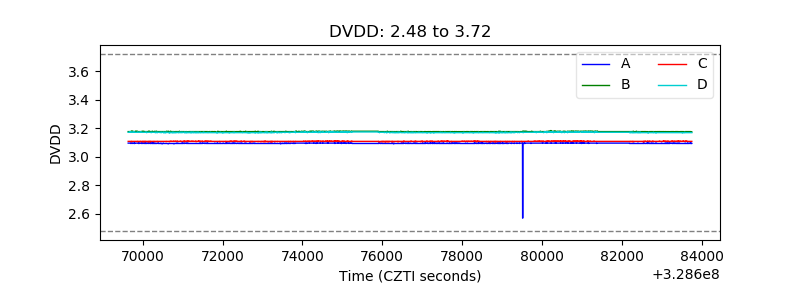 |
| Temperature 1 | 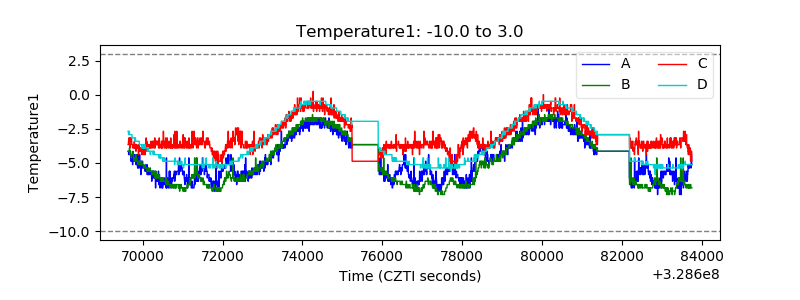 |
| Veto HV Monitor | 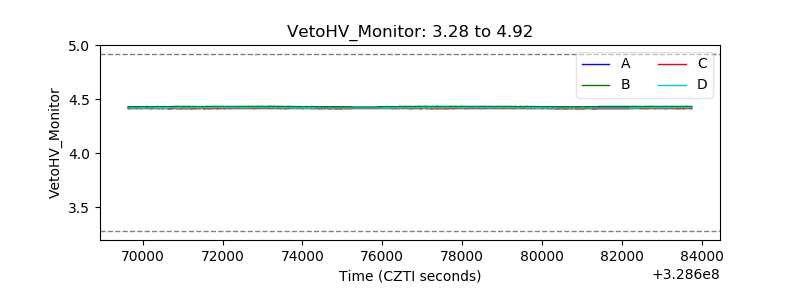 |
| Veto LLD | 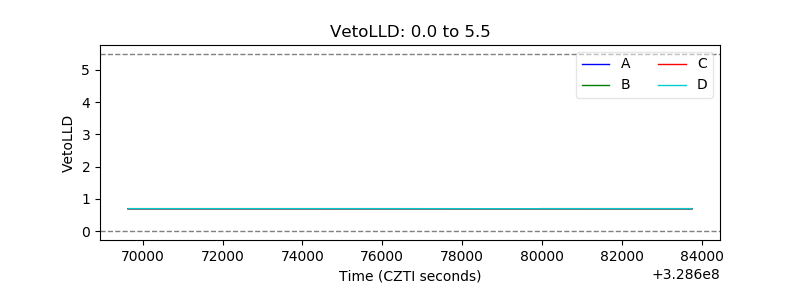 |
| Alpha Counter | 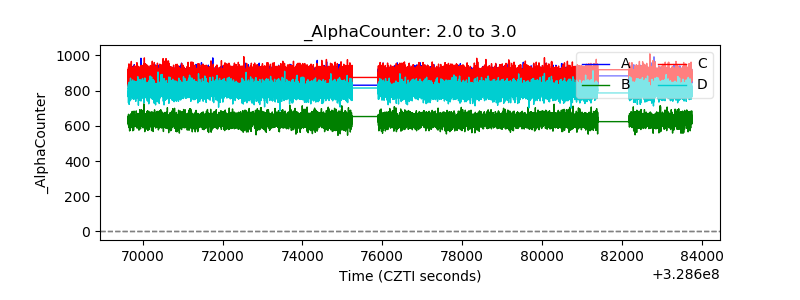 |
| _CPM_Rate | 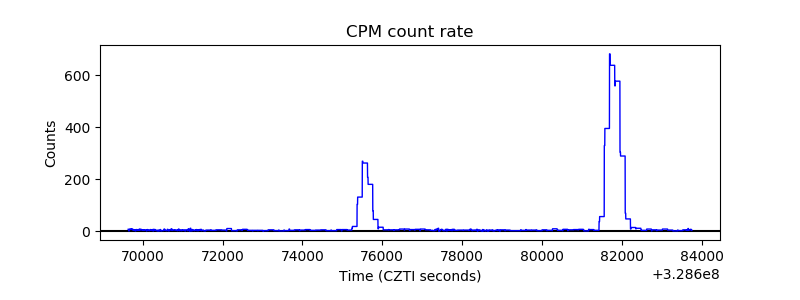 |
| CZT Counter | 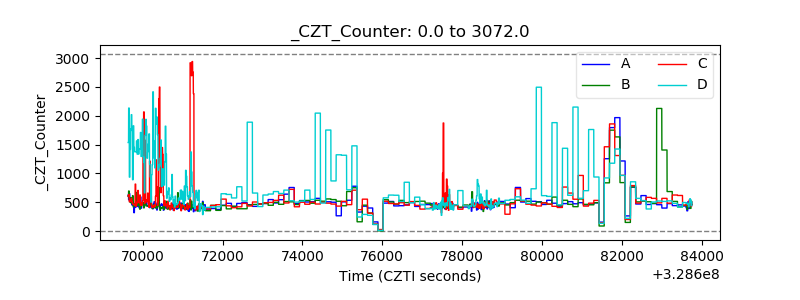 |
| +2.5 Volts monitor |  |
| +5 Volts monitor |  |
| _ROLL_ROT | 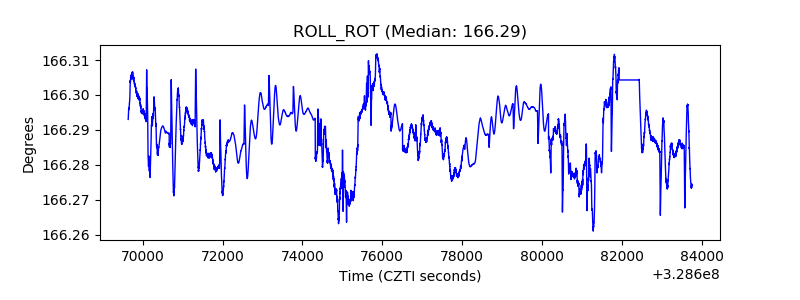 |
| _Roll_DEC | 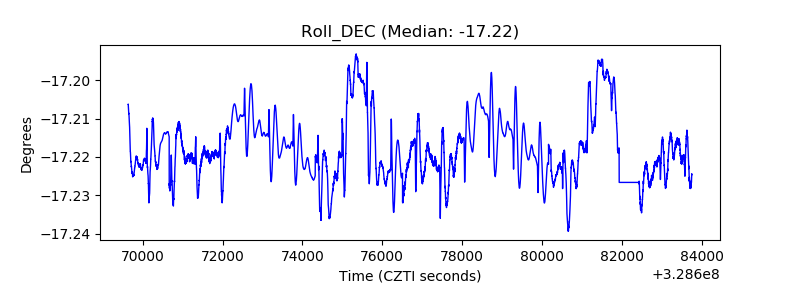 |
| _Roll_RA | 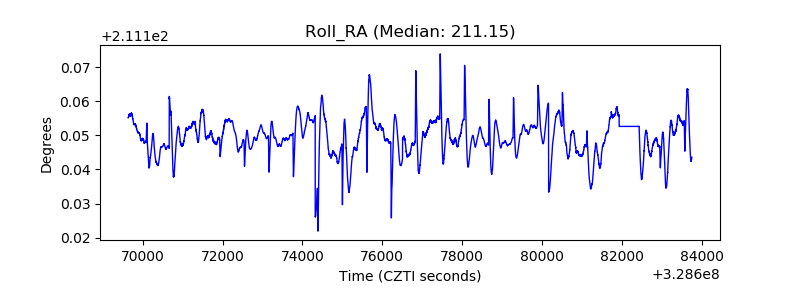 |
| Veto Counter | 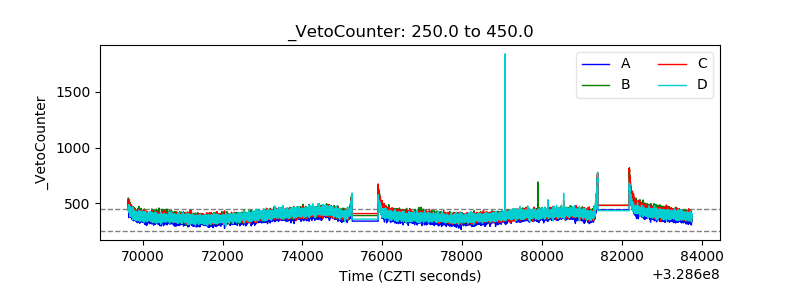 |