| Param | Original file | Final file |
|---|---|---|
| Filename | modeM0/AS1A09_006T01_9000003700_25282cztM0_level2.evt | modeM0/AS1A09_006T01_9000003700_25282cztM0_level2_quad_clean.evt |
| Size (bytes) | 546,716,160 | 68,904,000 |
| Size | 521.4 MB | 65.7 MB |
| Events in quadrant A | 3,311,982 | 415,292 |
| Events in quadrant B | 4,104,871 | 413,554 |
| Events in quadrant C | 3,747,093 | 393,806 |
| Events in quadrant D | 4,926,968 | 384,170 |
| Mode M9 | |||
|---|---|---|---|
| Quadrant | BADHDUFLAG | Total packets | Discarded packets |
| A | 0 | 12 | 0 |
| B | 0 | 13 | 0 |
| C | 0 | 13 | 0 |
| D | 0 | 13 | 0 |
| Mode M0 | |||
|---|---|---|---|
| Quadrant | BADHDUFLAG | Total packets | Discarded packets |
| A | 0 | 14112 | 0 |
| B | 0 | 16410 | 0 |
| C | 0 | 15340 | 0 |
| D | 0 | 19129 | 0 |
| Quadrant | Total seconds | Saturated seconds | Saturation percentage |
|---|---|---|---|
| A | 6886 | 44 | 0.638978% |
| B | 6886 | 298 | 4.327621% |
| C | 6886 | 111 | 1.611966% |
| D | 6886 | 208 | 3.020622% |
Noise dominated data is calculated using 1-second bins in cleaned event files. If a bin has >2000 counts, and if more than 50% of those come from <1% of pixels, then it is considered to be noise-dominated and hence unusable.
| Quadrant | # 1 sec bins | Bins with >0 counts | Bins with >2000 counts | High rate bins dominated by noise | Noise dominated (total time) | Noise dominated (detector-on time) | Marked lightcurve |
|---|---|---|---|---|---|---|---|
| A | 7846 | 6887 | 0 | 0 | 0.00% | 0.00% |  |
| B | 7846 | 6887 | 115 | 115 | 1.47% | 1.67% |  |
| C | 7846 | 6887 | 4 | 4 | 0.05% | 0.06% |  |
| D | 7846 | 6887 | 145 | 145 | 1.85% | 2.11% |  |
Top three noisy pixels from each quadrant. If the there are fewer than three noisy pixels in the level2.evt file, extra rows are filled as -1
| Pixel properties | Quadrant properties | ||||||
|---|---|---|---|---|---|---|---|
| Quadrant | DetID | PixID | Counts | Sigma | Mean | Median | Sigma |
| A | 13 | 254 | 10272 | 54.78 | 857 | 840 | 172.2 |
| A | 3 | 137 | 7928 | 41.17 | 857 | 840 | 172.2 |
| A | 0 | 226 | 7454 | 38.41 | 857 | 840 | 172.2 |
| B | 3 | 64 | 785219 | 4910.63 | 841 | 822 | 159.7 |
| B | 3 | 112 | 24277 | 146.84 | 841 | 822 | 159.7 |
| B | 12 | 111 | 19969 | 119.87 | 841 | 822 | 159.7 |
| C | 0 | 207 | 295292 | 1539.84 | 815 | 823 | 191.2 |
| C | 14 | 238 | 132086 | 686.4 | 815 | 823 | 191.2 |
| C | 0 | 239 | 102322 | 530.76 | 815 | 823 | 191.2 |
| D | 1 | 52 | 1179963 | 5906.22 | 822 | 796 | 199.6 |
| D | 8 | 195 | 605282 | 3027.75 | 822 | 796 | 199.6 |
| D | 2 | 234 | 28350 | 138.01 | 822 | 796 | 199.6 |
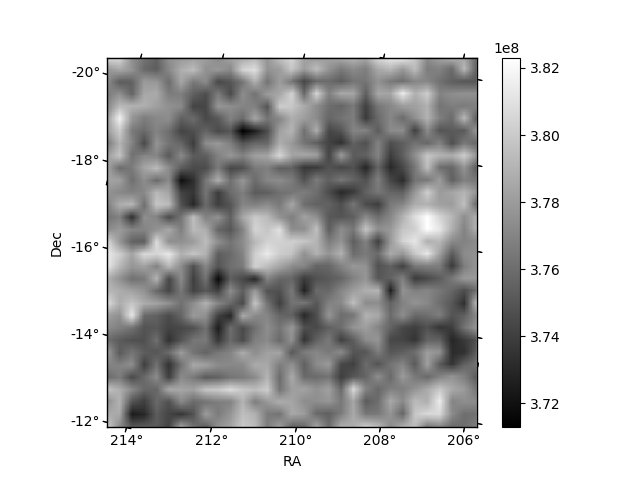
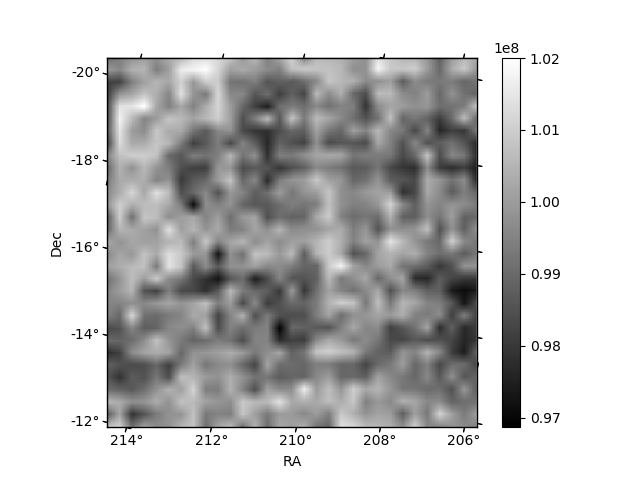
Histogram calculated using DETX and DETY for each event in the final _common_clean file
| Quadrant A | 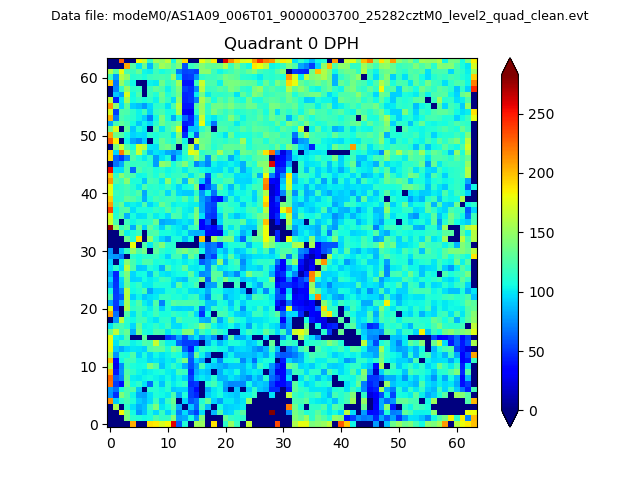 |
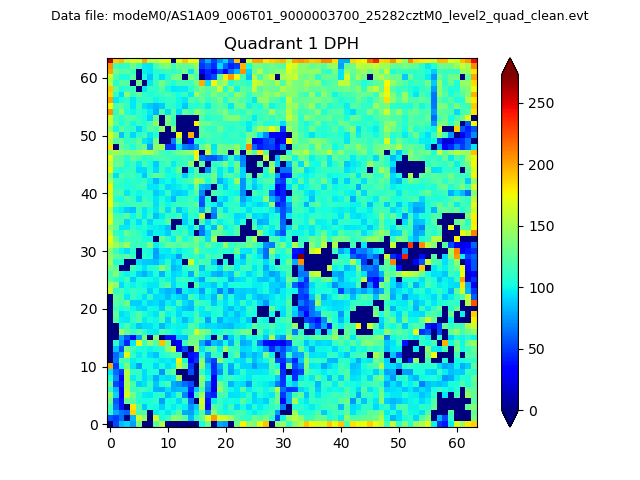 |
Quadrant B |
|---|---|---|---|
| Quadrant D | 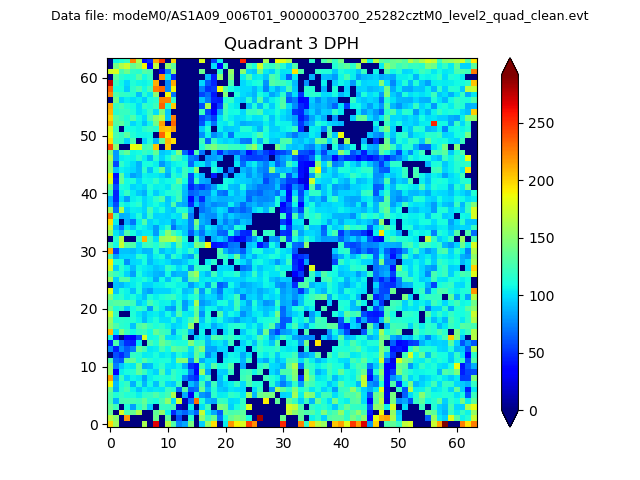 |
 |
Quadrant C |
| Plot type | Count rate plots | Images |
|---|---|---|
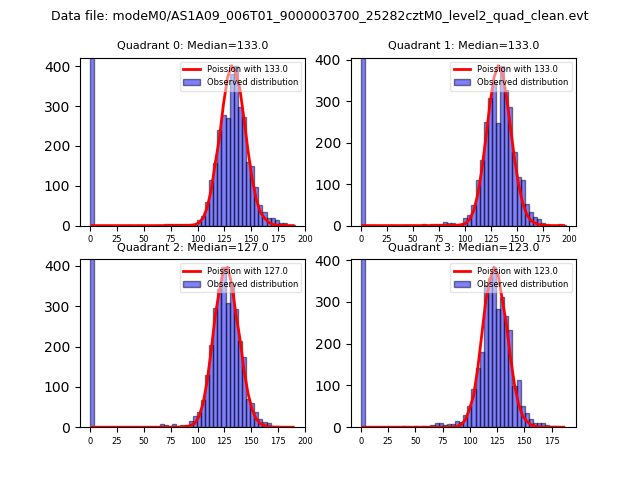
| Comparison with Poisson distribution Blue bars denote a histogram of data divided into 1 sec bins. Red curve is a Poisson curve with rate = median count rate of data. |
 |
 |
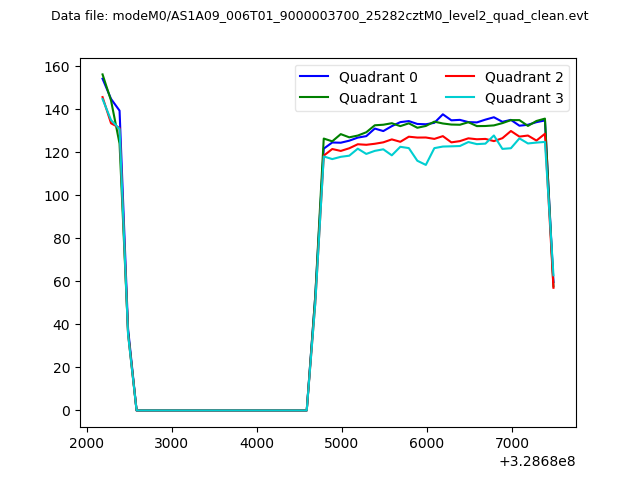
| Quadrant-wise count rates Data is divided into 100 sec bins |
 |
|
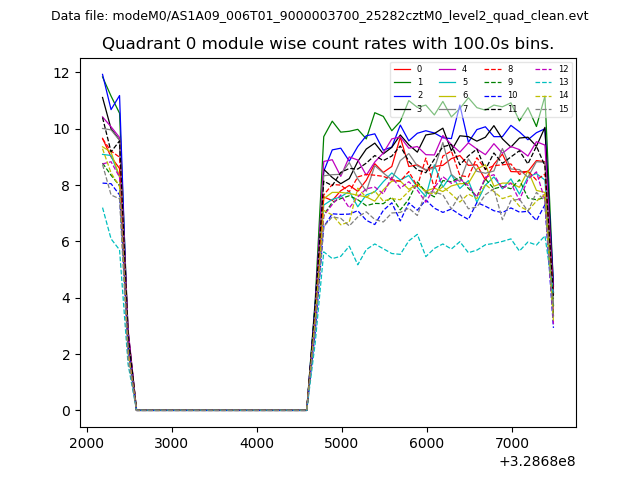
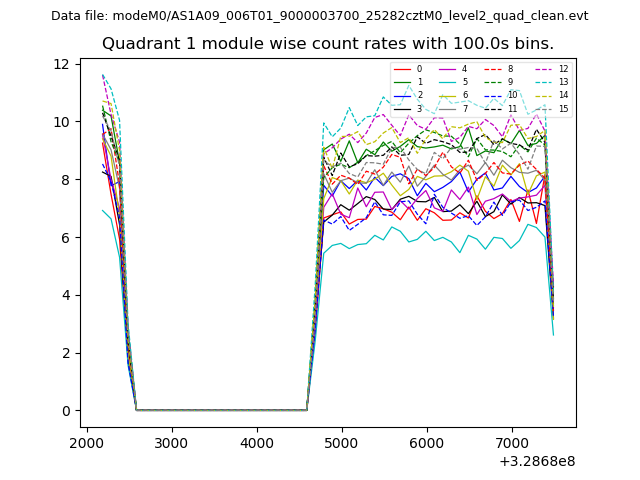
| Module-wise count rates for Quadrant A Data is divided into 100 sec bins |
 |
 |
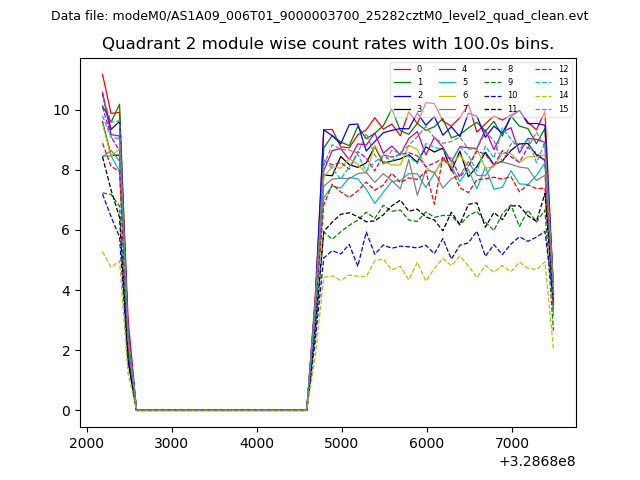
| Module-wise count rates for Quadrant B Data is divided into 100 sec bins |
 |
 |
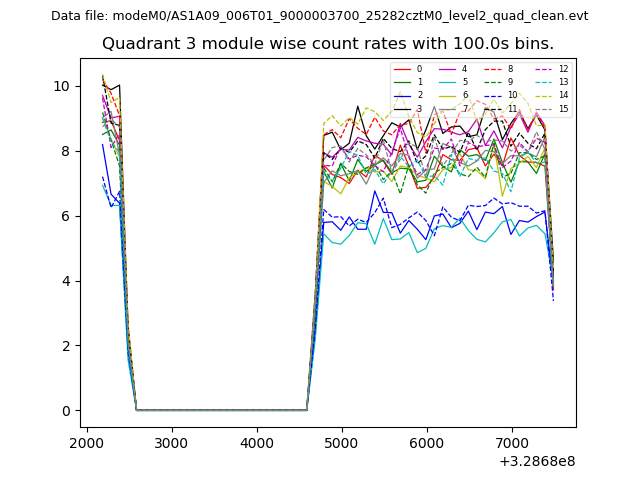
| Module-wise count rates for Quadrant C Data is divided into 100 sec bins |
 |
 |
| Module-wise count rates for Quadrant D Data is divided into 100 sec bins |
 |
 |
| Parameter | Plot |
|---|---|
| CZT HV Monitor | 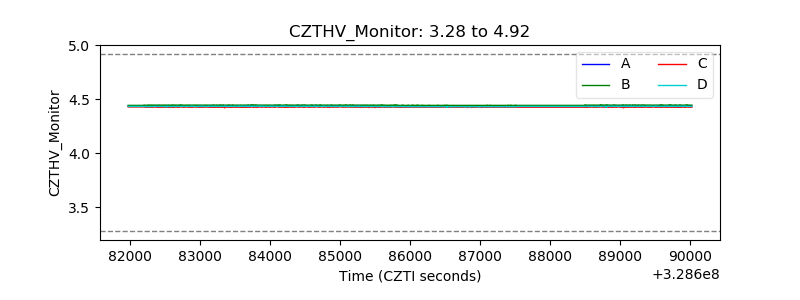 |
| D_VDD | 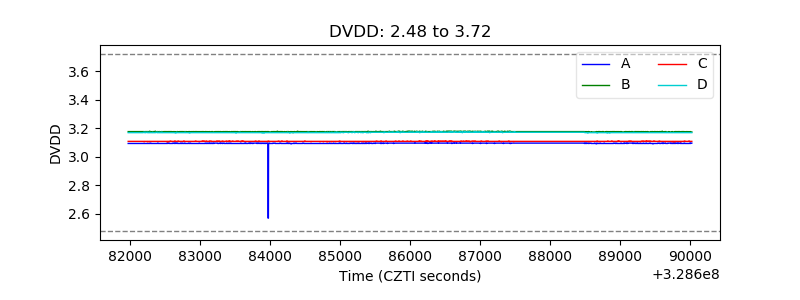 |
| Temperature 1 | 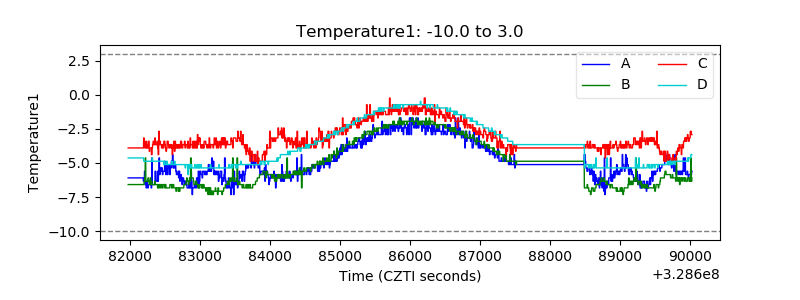 |
| Veto HV Monitor | 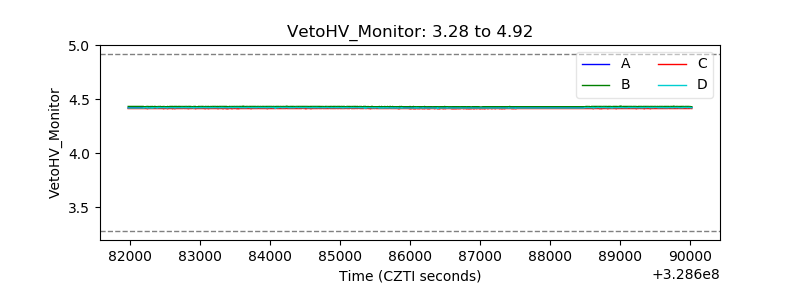 |
| Veto LLD | 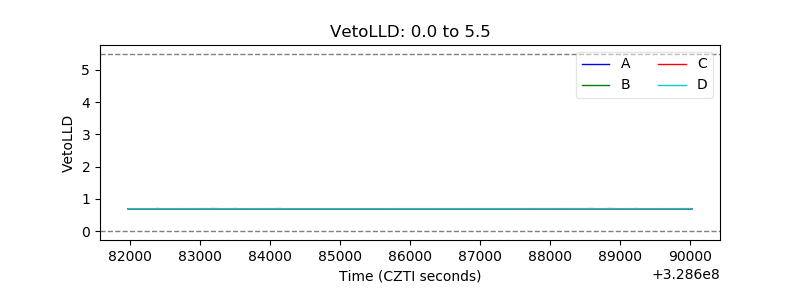 |
| Alpha Counter | 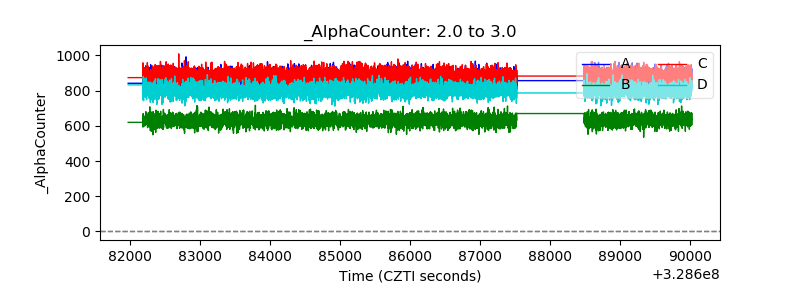 |
| _CPM_Rate | 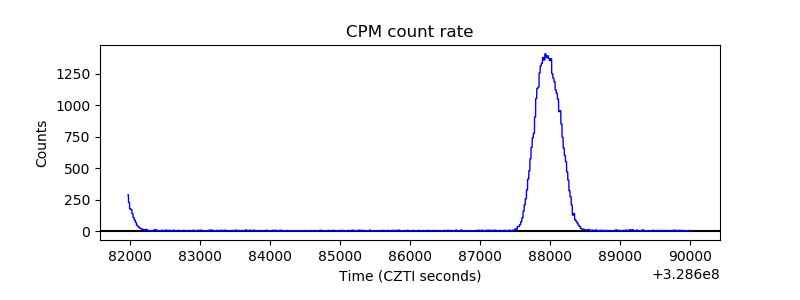 |
| CZT Counter | 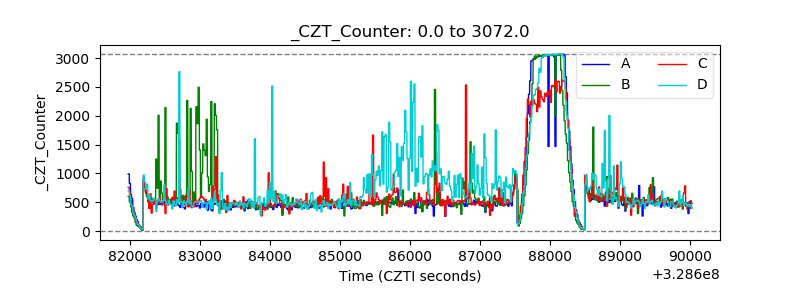 |
| +2.5 Volts monitor | 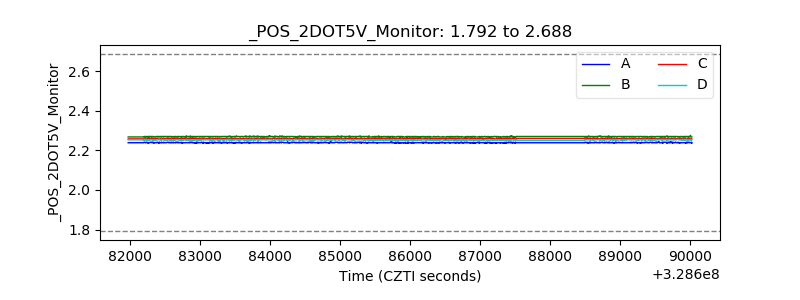 |
| +5 Volts monitor | 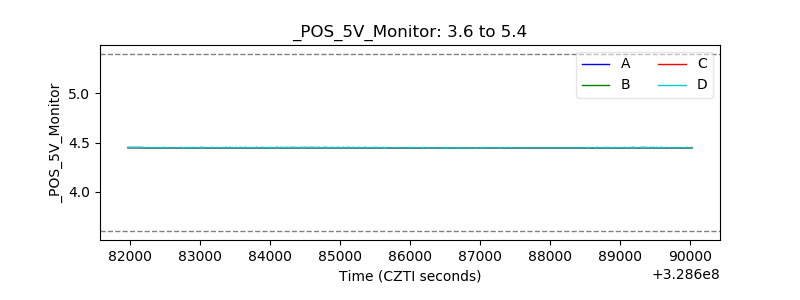 |
| _ROLL_ROT | 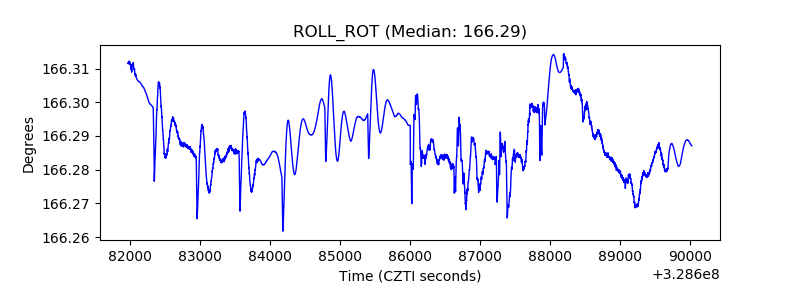 |
| _Roll_DEC |  |
| _Roll_RA | 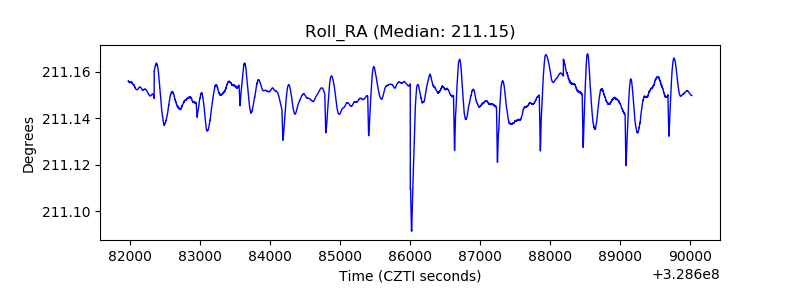 |
| Veto Counter | 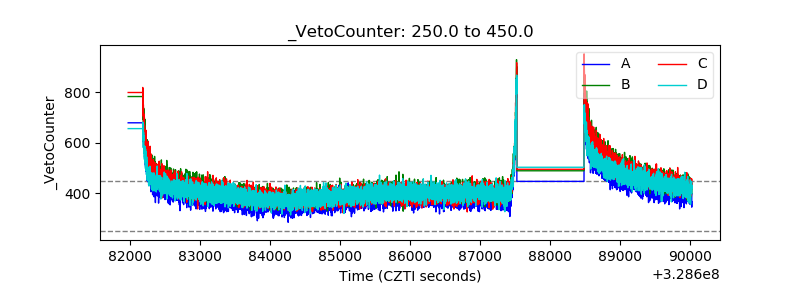 |