| Param | Original file | Final file |
|---|---|---|
| Filename | modeM0/AS1A09_006T01_9000003700_25284cztM0_level2.evt | modeM0/AS1A09_006T01_9000003700_25284cztM0_level2_quad_clean.evt |
| Size (bytes) | 483,871,680 | 67,559,040 |
| Size | 461.5 MB | 64.4 MB |
| Events in quadrant A | 3,190,081 | 415,086 |
| Events in quadrant B | 3,470,805 | 415,755 |
| Events in quadrant C | 3,430,688 | 390,066 |
| Events in quadrant D | 4,130,350 | 380,307 |
| Mode M9 | |||
|---|---|---|---|
| Quadrant | BADHDUFLAG | Total packets | Discarded packets |
| A | 0 | 12 | 0 |
| B | 0 | 12 | 0 |
| C | 0 | 12 | 0 |
| D | 0 | 12 | 0 |
| Mode M0 | |||
|---|---|---|---|
| Quadrant | BADHDUFLAG | Total packets | Discarded packets |
| A | 0 | 13291 | 0 |
| B | 0 | 14259 | 0 |
| C | 0 | 14071 | 0 |
| D | 0 | 16291 | 0 |
| Quadrant | Total seconds | Saturated seconds | Saturation percentage |
|---|---|---|---|
| A | 6370 | 27 | 0.423862% |
| B | 6371 | 58 | 0.910375% |
| C | 6370 | 125 | 1.962323% |
| D | 6370 | 171 | 2.684458% |
Noise dominated data is calculated using 1-second bins in cleaned event files. If a bin has >2000 counts, and if more than 50% of those come from <1% of pixels, then it is considered to be noise-dominated and hence unusable.
| Quadrant | # 1 sec bins | Bins with >0 counts | Bins with >2000 counts | High rate bins dominated by noise | Noise dominated (total time) | Noise dominated (detector-on time) | Marked lightcurve |
|---|---|---|---|---|---|---|---|
| A | 7490 | 6371 | 2 | 2 | 0.03% | 0.03% | 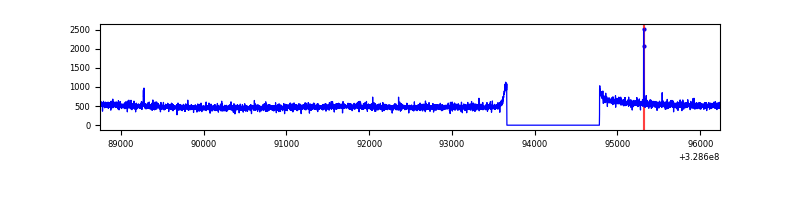 |
| B | 7491 | 6372 | 7 | 7 | 0.09% | 0.11% | 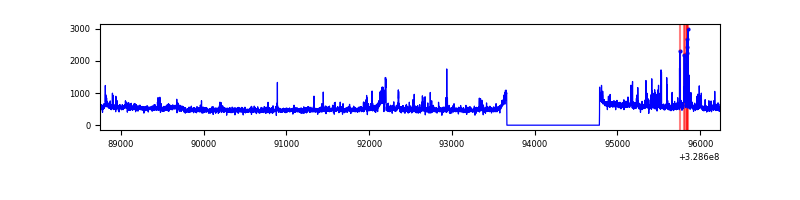 |
| C | 7490 | 6371 | 16 | 16 | 0.21% | 0.25% | 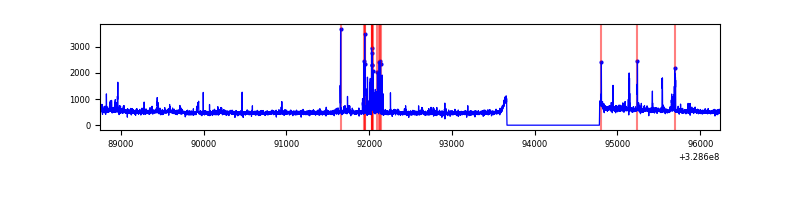 |
| D | 7490 | 6371 | 140 | 140 | 1.87% | 2.20% | 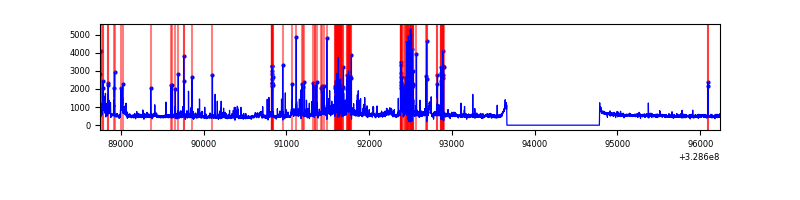 |
Top three noisy pixels from each quadrant. If the there are fewer than three noisy pixels in the level2.evt file, extra rows are filled as -1
| Pixel properties | Quadrant properties | ||||||
|---|---|---|---|---|---|---|---|
| Quadrant | DetID | PixID | Counts | Sigma | Mean | Median | Sigma |
| A | 13 | 170 | 11792 | 66.95 | 824 | 807 | 164.1 |
| A | 13 | 254 | 10224 | 57.4 | 824 | 807 | 164.1 |
| A | 3 | 137 | 7246 | 39.24 | 824 | 807 | 164.1 |
| B | 3 | 64 | 265638 | 1714.54 | 816 | 796 | 154.5 |
| B | 12 | 111 | 18765 | 116.33 | 816 | 796 | 154.5 |
| B | 11 | 111 | 16655 | 102.67 | 816 | 796 | 154.5 |
| C | 0 | 239 | 128158 | 699.48 | 780 | 786 | 182.1 |
| C | 14 | 238 | 127513 | 695.94 | 780 | 786 | 182.1 |
| C | 0 | 207 | 100512 | 547.66 | 780 | 786 | 182.1 |
| D | 1 | 52 | 833149 | 4414.77 | 784 | 762 | 188.5 |
| D | 8 | 195 | 236950 | 1252.68 | 784 | 762 | 188.5 |
| D | 5 | 222 | 70983 | 372.43 | 784 | 762 | 188.5 |
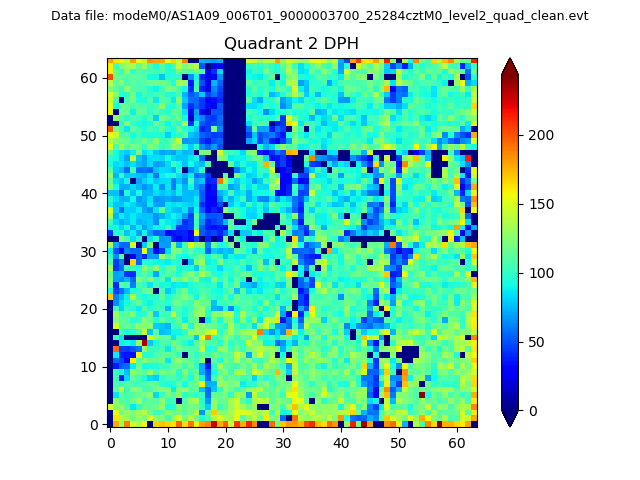
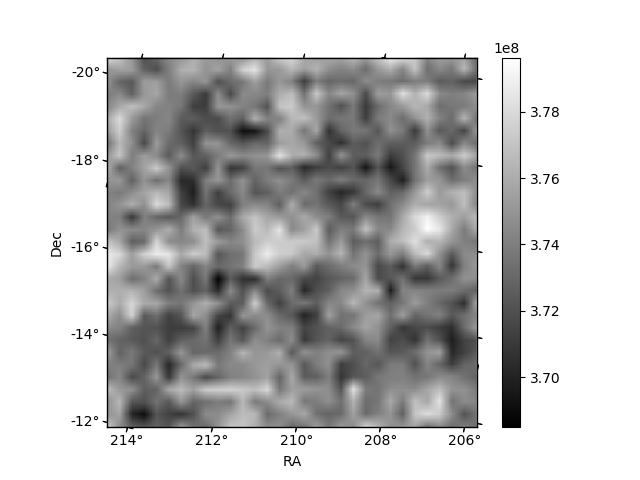
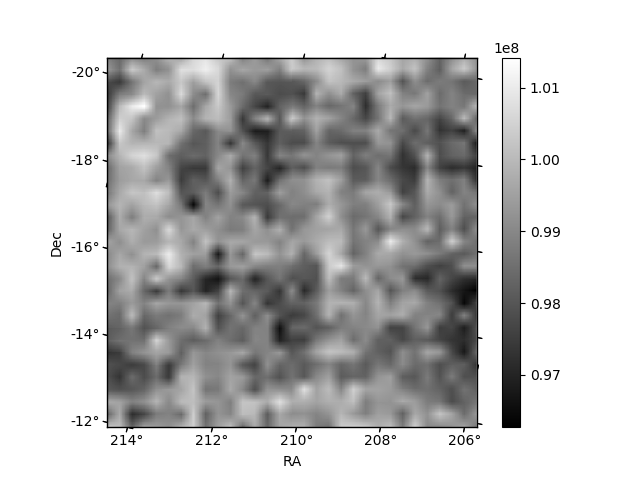
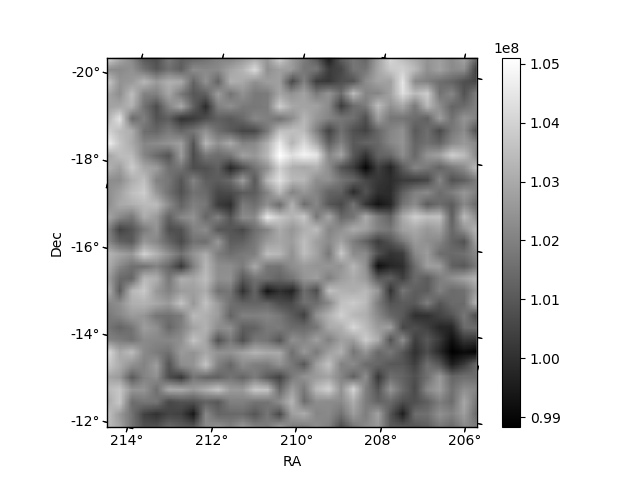
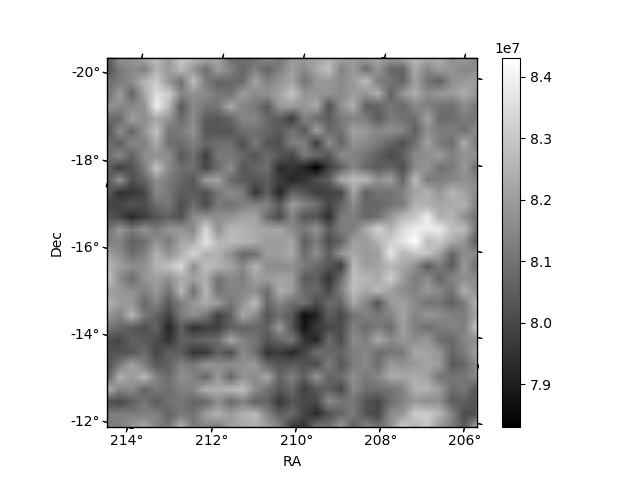
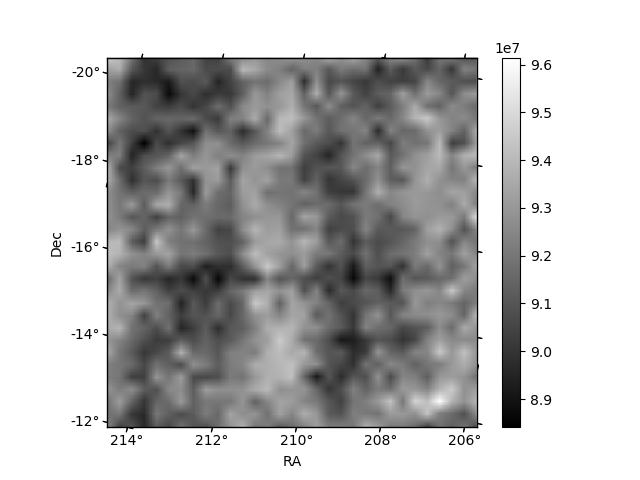
Histogram calculated using DETX and DETY for each event in the final _common_clean file
| Quadrant A | 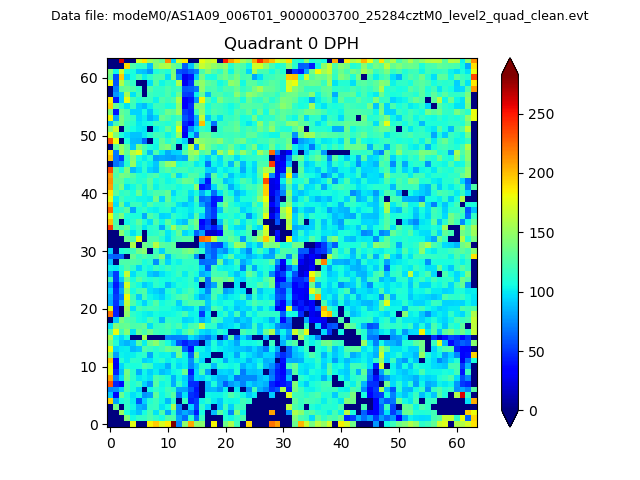 |
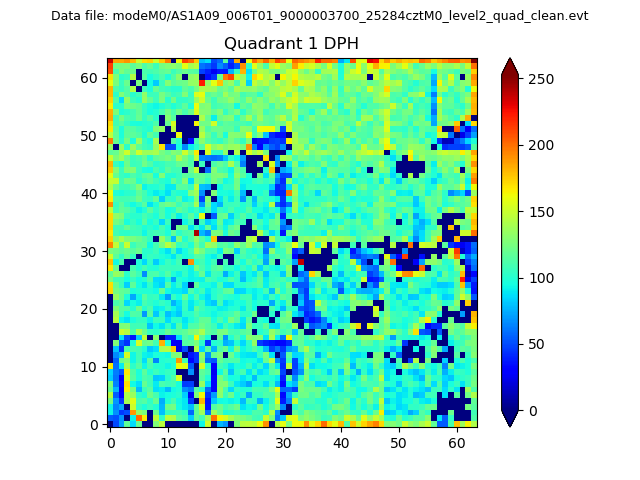 |
Quadrant B |
|---|---|---|---|
| Quadrant D | 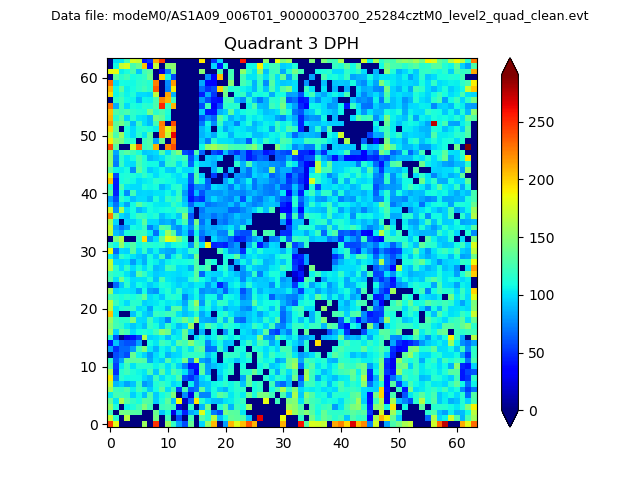 |
 |
Quadrant C |
| Plot type | Count rate plots | Images |
|---|---|---|
| Comparison with Poisson distribution Blue bars denote a histogram of data divided into 1 sec bins. Red curve is a Poisson curve with rate = median count rate of data. |
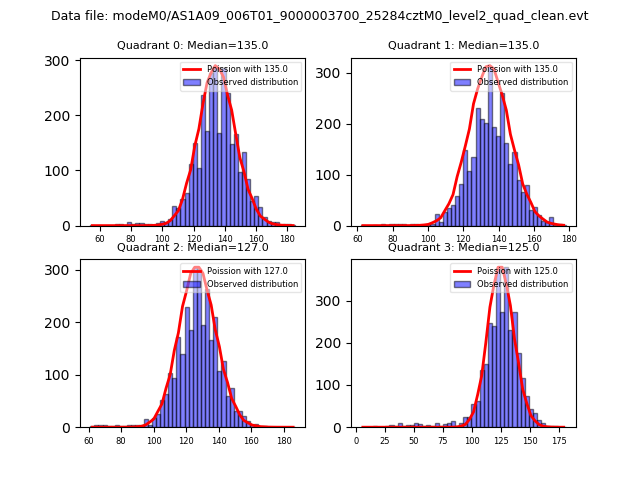 |
 |
| Quadrant-wise count rates Data is divided into 100 sec bins |
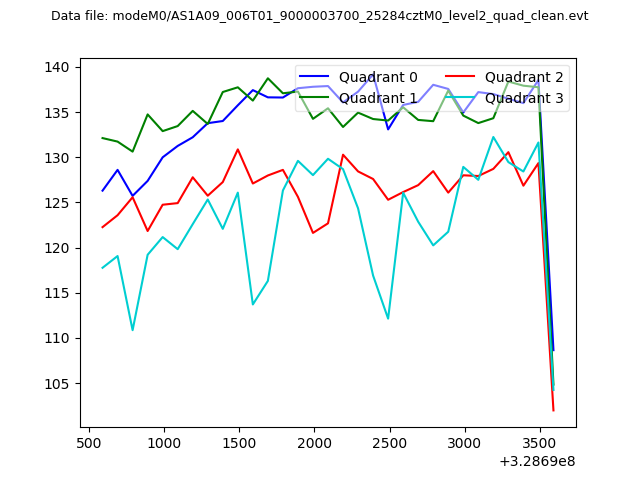 |
|
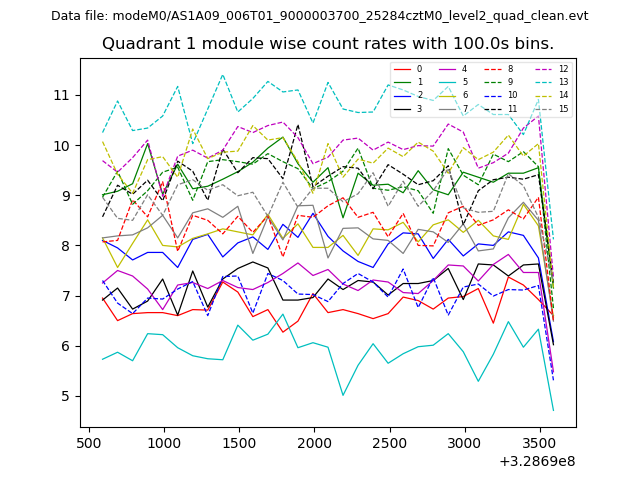
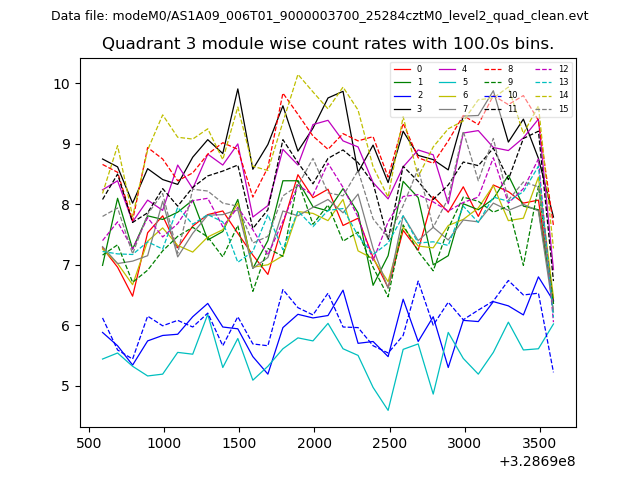
| Module-wise count rates for Quadrant A Data is divided into 100 sec bins |
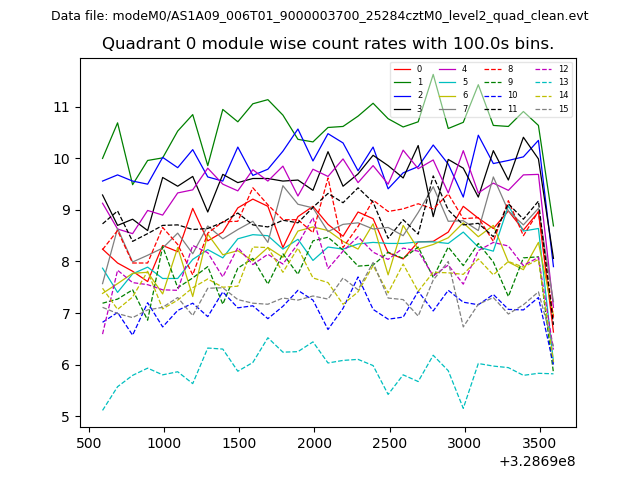 |
 |
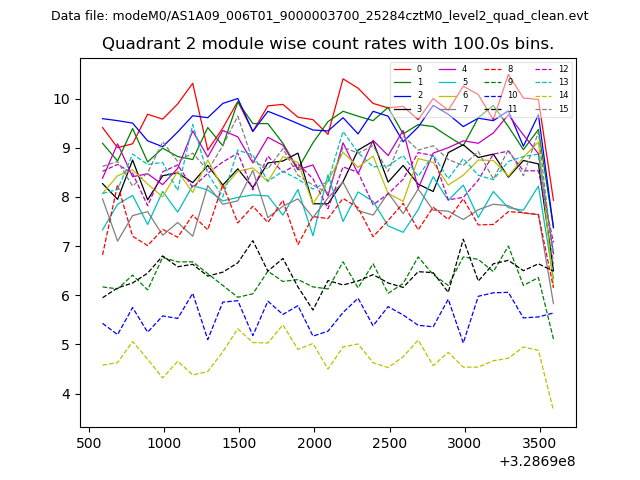
| Module-wise count rates for Quadrant B Data is divided into 100 sec bins |
 |
 |
| Module-wise count rates for Quadrant C Data is divided into 100 sec bins |
 |
 |
| Module-wise count rates for Quadrant D Data is divided into 100 sec bins |
 |
 |
| Parameter | Plot |
|---|---|
| CZT HV Monitor | 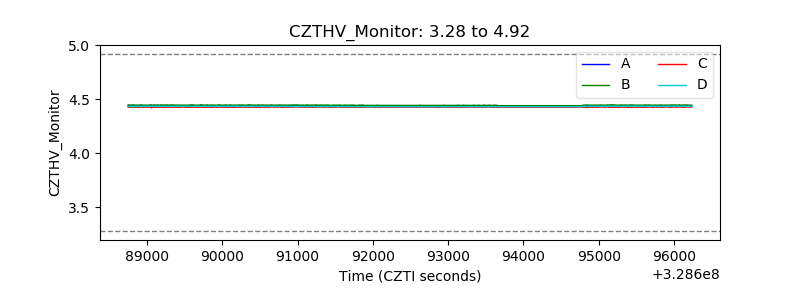 |
| D_VDD | 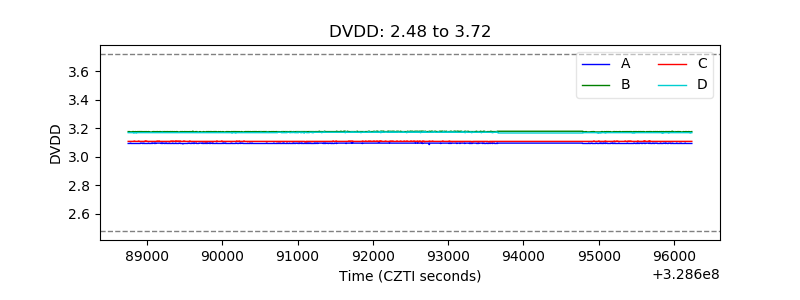 |
| Temperature 1 | 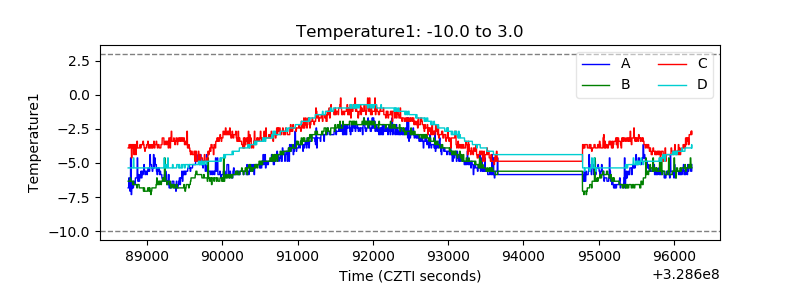 |
| Veto HV Monitor | 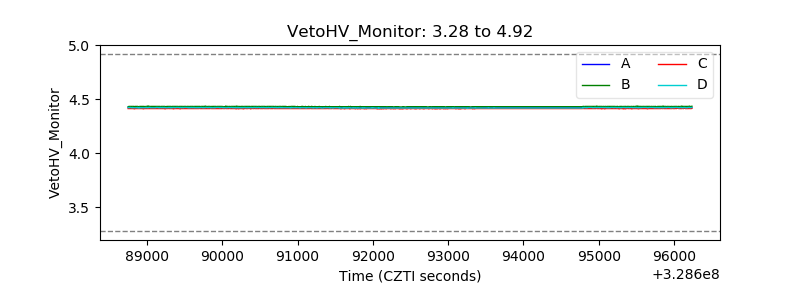 |
| Veto LLD | 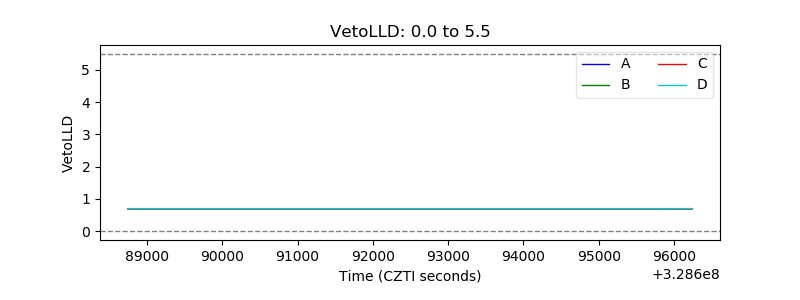 |
| Alpha Counter | 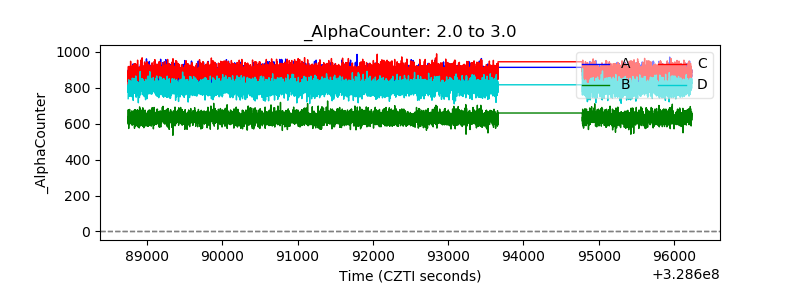 |
| _CPM_Rate | 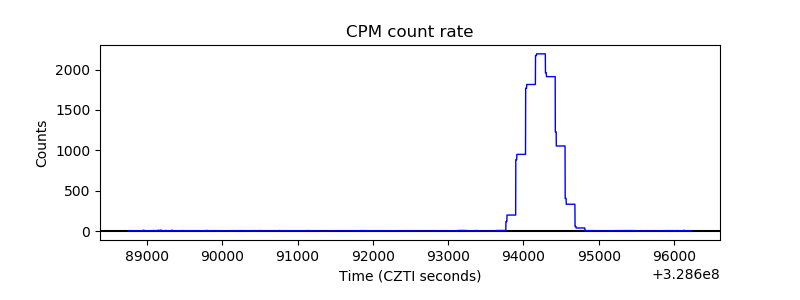 |
| CZT Counter | 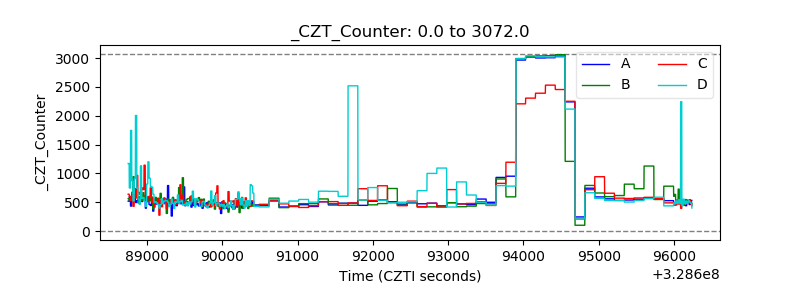 |
| +2.5 Volts monitor |  |
| +5 Volts monitor |  |
| _ROLL_ROT | 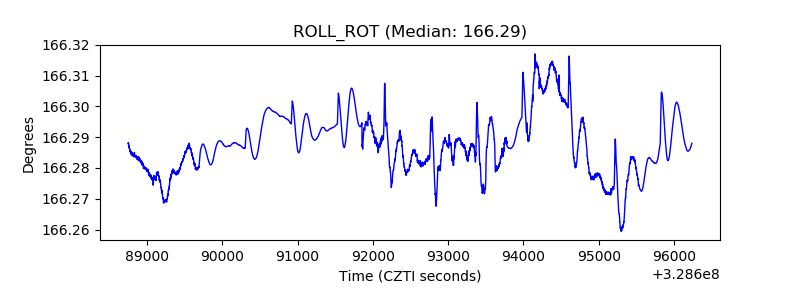 |
| _Roll_DEC | 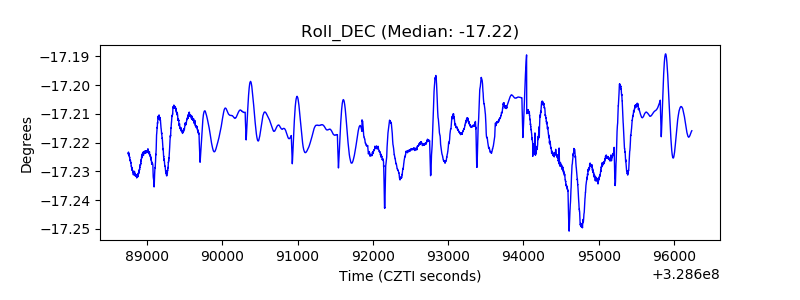 |
| _Roll_RA | 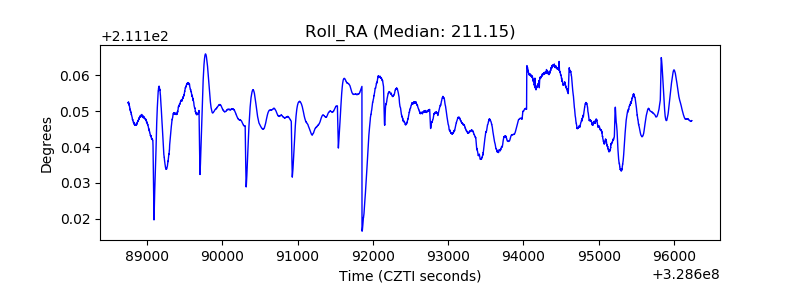 |
| Veto Counter | 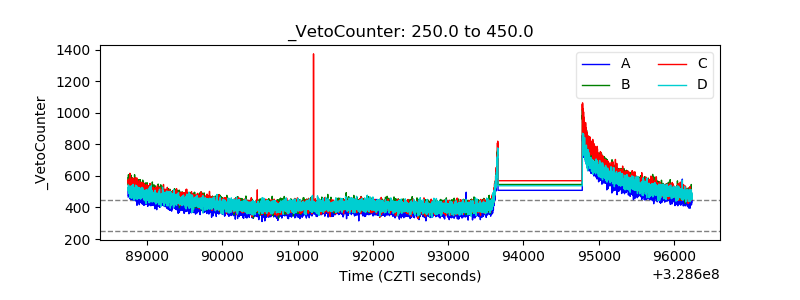 |