| Param | Original file | Final file |
|---|---|---|
| Filename | modeM0/AS1C05_002T10_9000003698cztM0_level2.fits | modeM0/AS1C05_002T10_9000003698cztM0_level2_quad_clean.evt |
| Size (bytes) | 53,225,280 | 32,063,040 |
| Size | 50.8 MB | 30.6 MB |
| Events in quadrant A | 326,712 | 154,037 |
| Events in quadrant B | 307,590 | 152,957 |
| Events in quadrant C | 315,452 | 144,587 |
| Events in quadrant D | 274,734 | 130,405 |
| Mode M0 | |||
|---|---|---|---|
| Quadrant | BADHDUFLAG | Total packets | Discarded packets |
| A | 0 | 11434 | 0 |
| B | 0 | 12618 | 0 |
| C | 0 | 12210 | 0 |
| D | 0 | 17426 | 0 |
| Mode SS | |||
|---|---|---|---|
| Quadrant | BADHDUFLAG | Total packets | Discarded packets |
| A | 0 | 112 | 0 |
| B | 0 | 112 | 0 |
| C | 0 | 112 | 0 |
| D | 0 | 112 | 0 |
| Mode M9 | |||
|---|---|---|---|
| Quadrant | BADHDUFLAG | Total packets | Discarded packets |
| A | 0 | 3 | 0 |
| B | 0 | 3 | 0 |
| C | 0 | 3 | 0 |
| D | 0 | 3 | 0 |
| Quadrant | Total seconds | Saturated seconds | Saturation percentage |
|---|---|---|---|
| A | 5544 | 23 | 0.414863% |
| B | 5544 | 109 | 1.966089% |
| C | 5544 | 88 | 1.587302% |
| D | 5544 | 114 | 2.056277% |
Noise dominated data is calculated using 1-second bins in cleaned event files. If a bin has >2000 counts, and if more than 50% of those come from <1% of pixels, then it is considered to be noise-dominated and hence unusable.
| Quadrant | # 1 sec bins | Bins with >0 counts | Bins with >2000 counts | High rate bins dominated by noise | Noise dominated (total time) | Noise dominated (detector-on time) | Marked lightcurve |
|---|---|---|---|---|---|---|---|
| A | 5844 | 5544 | 0 | 0 | 0.00% | 0.00% |  |
| B | 5844 | 5544 | 0 | 0 | 0.00% | 0.00% |  |
| C | 5844 | 5544 | 0 | 0 | 0.00% | 0.00% |  |
| D | 5844 | 5544 | 0 | 0 | 0.00% | 0.00% |  |
Top three noisy pixels from each quadrant. If the there are fewer than three noisy pixels in the level2.evt file, extra rows are filled as -1
| Pixel properties | Quadrant properties | ||||||
|---|---|---|---|---|---|---|---|
| Quadrant | DetID | PixID | Counts | Sigma | Mean | Median | Sigma |
| A | 14 | 188 | 319 | 10.32 | 85 | 79 | 23.3 |
| A | 0 | 29 | 300 | 9.5 | 85 | 79 | 23.3 |
| A | 14 | 204 | 288 | 8.99 | 85 | 79 | 23.3 |
| B | 13 | 245 | 221 | 8.03 | 81 | 77 | 17.9 |
| B | 2 | 9 | 219 | 7.92 | 81 | 77 | 17.9 |
| B | 14 | 254 | 218 | 7.87 | 81 | 77 | 17.9 |
| C | 3 | 158 | 221 | 6.24 | 83 | 78 | 22.9 |
| C | 3 | 235 | 217 | 6.07 | 83 | 78 | 22.9 |
| C | 9 | 209 | 216 | 6.03 | 83 | 78 | 22.9 |
| D | 6 | 231 | 217 | 6.49 | 78 | 71 | 22.5 |
| D | 12 | 6 | 197 | 5.6 | 78 | 71 | 22.5 |
| D | 10 | 189 | 195 | 5.51 | 78 | 71 | 22.5 |
Histogram calculated using DETX and DETY for each event in the final _common_clean file
| Quadrant A |  |
 |
Quadrant B |
|---|---|---|---|
| Quadrant D |  |
 |
Quadrant C |
| Plot type | Count rate plots | Images |
|---|---|---|
| Comparison with Poisson distribution Blue bars denote a histogram of data divided into 1 sec bins. Red curve is a Poisson curve with rate = median count rate of data. |
 |
 |
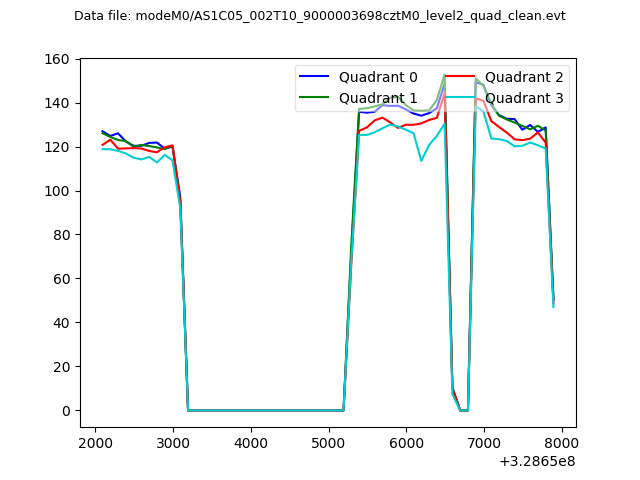
| Quadrant-wise count rates Data is divided into 100 sec bins |
 |
|
| Module-wise count rates for Quadrant A Data is divided into 100 sec bins |
 |
 |
| Module-wise count rates for Quadrant B Data is divided into 100 sec bins |
 |
 |
| Module-wise count rates for Quadrant C Data is divided into 100 sec bins |
 |
 |
| Module-wise count rates for Quadrant D Data is divided into 100 sec bins |
 |
 |
| Parameter | Plot |
|---|---|
| CZT HV Monitor |  |
| D_VDD |  |
| Temperature 1 |  |
| Veto HV Monitor |  |
| Veto LLD |  |
| Alpha Counter |  |
| _CPM_Rate |  |
| CZT Counter |  |
| +2.5 Volts monitor |  |
| +5 Volts monitor |  |
| _ROLL_ROT |  |
| _Roll_DEC |  |
| _Roll_RA |  |
| Veto Counter |  |