| Param | Original file | Final file |
|---|---|---|
| Filename | modeM0/AS1C05_002T10_9000003698_25277cztM0_level2.evt | modeM0/AS1C05_002T10_9000003698_25277cztM0_level2_quad_clean.evt |
| Size (bytes) | 442,517,760 | 70,061,760 |
| Size | 422.0 MB | 66.8 MB |
| Events in quadrant A | 2,607,422 | 445,047 |
| Events in quadrant B | 3,033,754 | 447,485 |
| Events in quadrant C | 2,852,925 | 428,377 |
| Events in quadrant D | 4,531,464 | 412,761 |
| Mode M0 | |||
|---|---|---|---|
| Quadrant | BADHDUFLAG | Total packets | Discarded packets |
| A | 0 | 11434 | 0 |
| B | 0 | 12618 | 0 |
| C | 0 | 12210 | 0 |
| D | 0 | 17426 | 0 |
| Mode M9 | |||
|---|---|---|---|
| Quadrant | BADHDUFLAG | Total packets | Discarded packets |
| A | 0 | 3 | 0 |
| B | 0 | 3 | 0 |
| C | 0 | 3 | 0 |
| D | 0 | 3 | 0 |
| Quadrant | Total seconds | Saturated seconds | Saturation percentage |
|---|---|---|---|
| A | 5544 | 23 | 0.414863% |
| B | 5544 | 109 | 1.966089% |
| C | 5544 | 88 | 1.587302% |
| D | 5544 | 114 | 2.056277% |
Noise dominated data is calculated using 1-second bins in cleaned event files. If a bin has >2000 counts, and if more than 50% of those come from <1% of pixels, then it is considered to be noise-dominated and hence unusable.
| Quadrant | # 1 sec bins | Bins with >0 counts | Bins with >2000 counts | High rate bins dominated by noise | Noise dominated (total time) | Noise dominated (detector-on time) | Marked lightcurve |
|---|---|---|---|---|---|---|---|
| A | 5844 | 5545 | 0 | 0 | 0.00% | 0.00% | 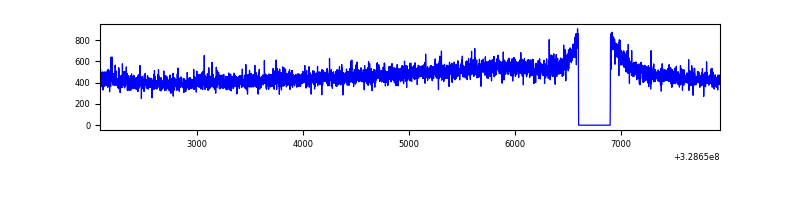 |
| B | 5844 | 5545 | 42 | 42 | 0.72% | 0.76% | 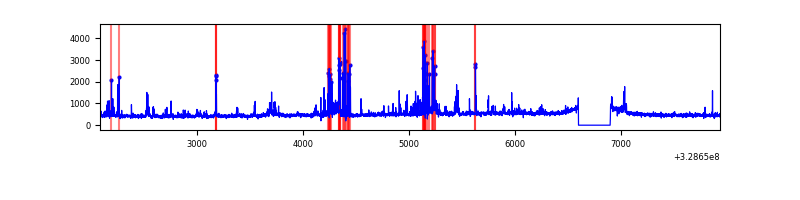 |
| C | 5844 | 5545 | 3 | 3 | 0.05% | 0.05% |  |
| D | 5844 | 5545 | 45 | 45 | 0.77% | 0.81% | 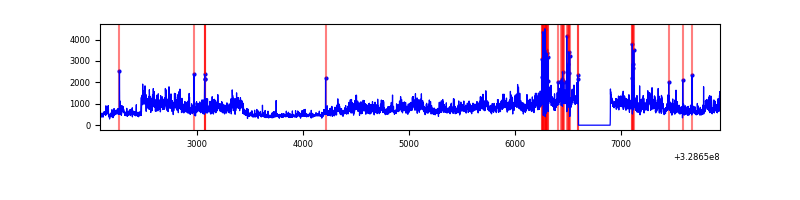 |
Top three noisy pixels from each quadrant. If the there are fewer than three noisy pixels in the level2.evt file, extra rows are filled as -1
| Pixel properties | Quadrant properties | ||||||
|---|---|---|---|---|---|---|---|
| Quadrant | DetID | PixID | Counts | Sigma | Mean | Median | Sigma |
| A | 6 | 16 | 9045 | 60.88 | 674 | 660 | 137.7 |
| A | 13 | 254 | 8261 | 55.19 | 674 | 660 | 137.7 |
| A | 3 | 137 | 6107 | 39.55 | 674 | 660 | 137.7 |
| B | 3 | 64 | 353437 | 2765.47 | 666 | 649 | 127.6 |
| B | 3 | 112 | 61225 | 474.85 | 666 | 649 | 127.6 |
| B | 12 | 111 | 15843 | 119.1 | 666 | 649 | 127.6 |
| C | 0 | 239 | 130071 | 841.87 | 647 | 651 | 153.7 |
| C | 14 | 238 | 103024 | 665.93 | 647 | 651 | 153.7 |
| C | 3 | 233 | 40327 | 258.09 | 647 | 651 | 153.7 |
| D | 8 | 195 | 1759445 | 11045.45 | 652 | 633 | 159.2 |
| D | 1 | 52 | 230707 | 1444.88 | 652 | 633 | 159.2 |
| D | 12 | 235 | 55108 | 342.11 | 652 | 633 | 159.2 |
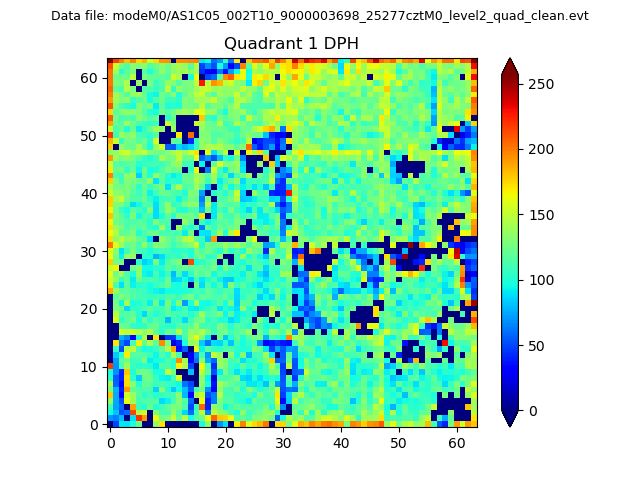
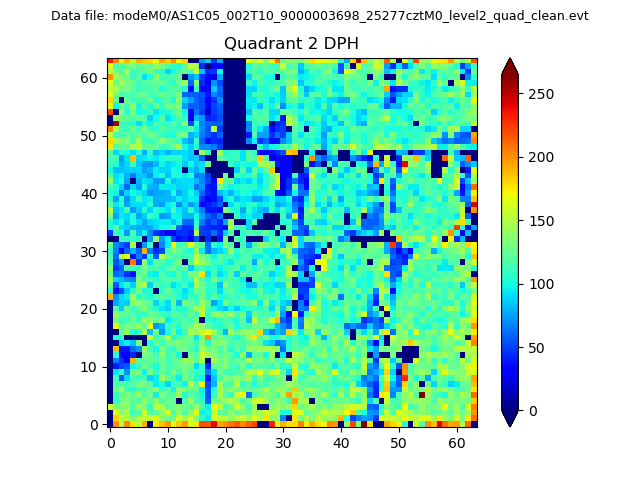
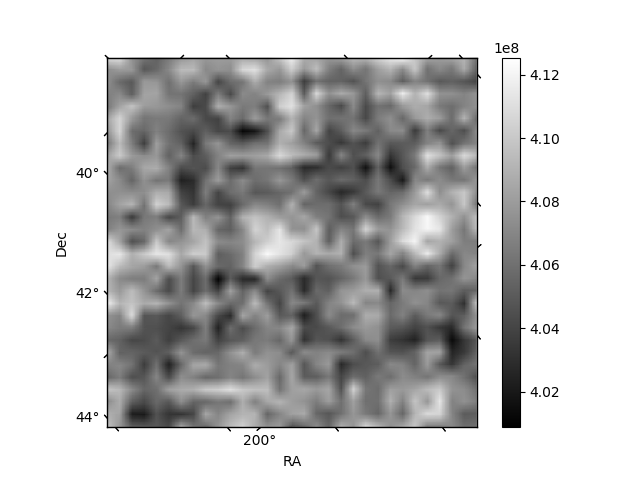
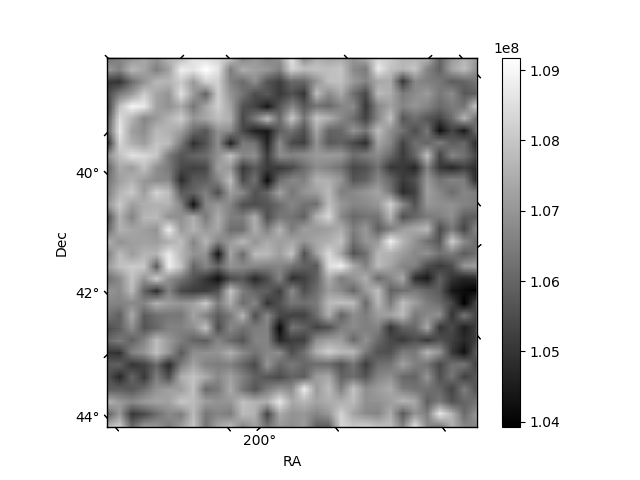
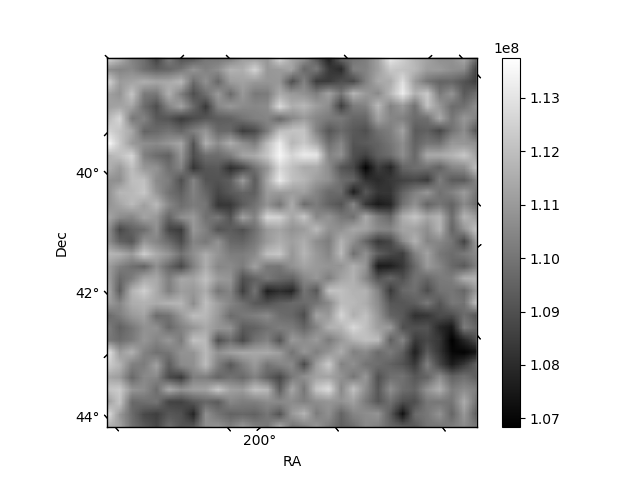
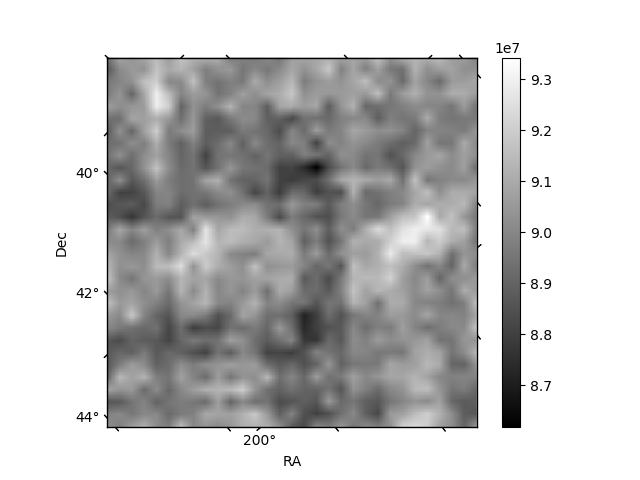
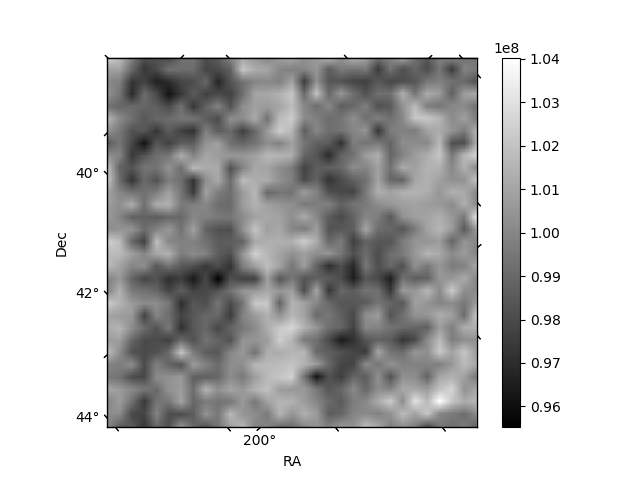
Histogram calculated using DETX and DETY for each event in the final _common_clean file
| Quadrant A | 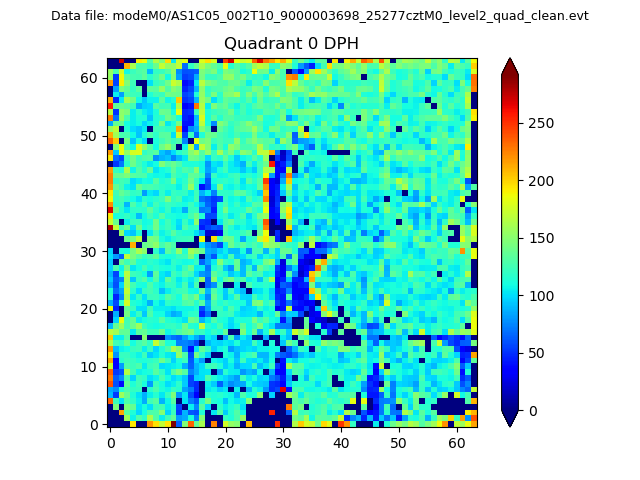 |
 |
Quadrant B |
|---|---|---|---|
| Quadrant D | 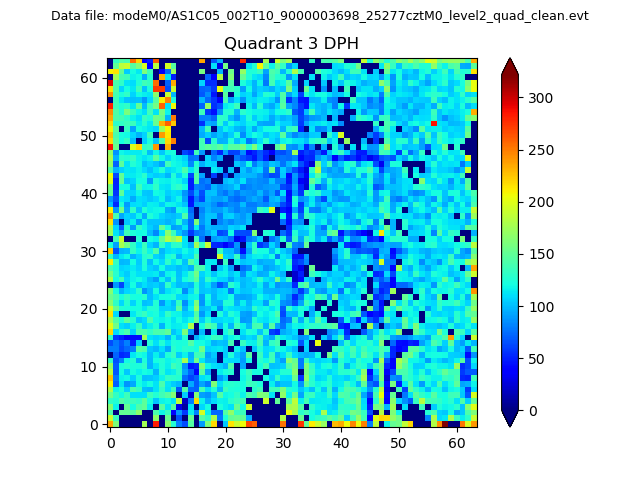 |
 |
Quadrant C |
| Plot type | Count rate plots | Images |
|---|---|---|
| Comparison with Poisson distribution Blue bars denote a histogram of data divided into 1 sec bins. Red curve is a Poisson curve with rate = median count rate of data. |
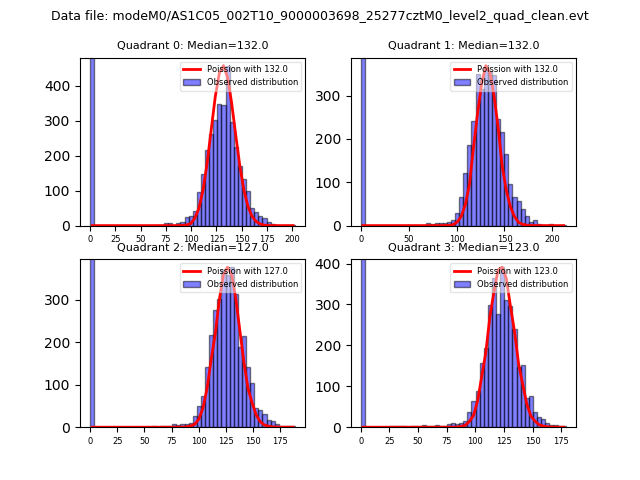 |
 |
| Quadrant-wise count rates Data is divided into 100 sec bins |
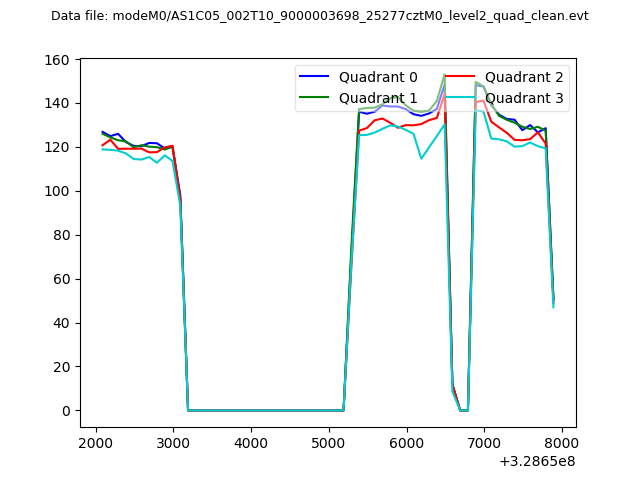 |
|
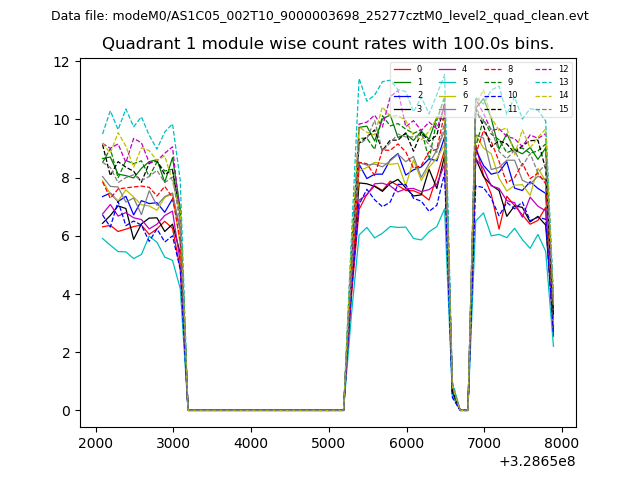
| Module-wise count rates for Quadrant A Data is divided into 100 sec bins |
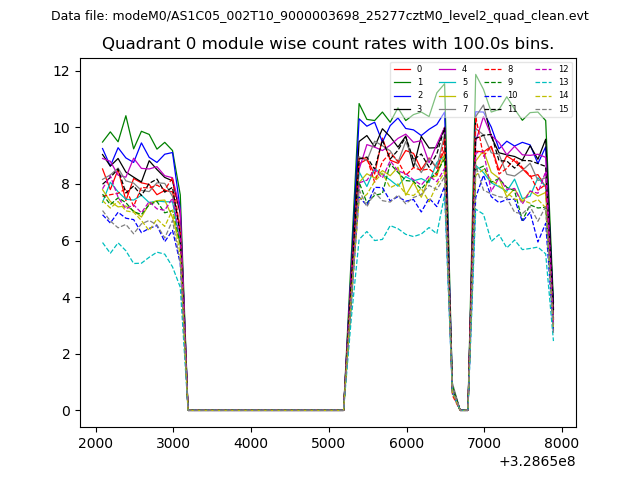 |
 |
| Module-wise count rates for Quadrant B Data is divided into 100 sec bins |
 |
 |
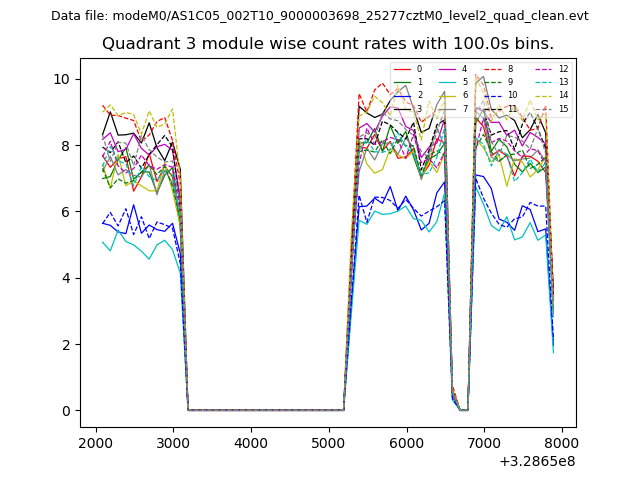
| Module-wise count rates for Quadrant C Data is divided into 100 sec bins |
 |
 |
| Module-wise count rates for Quadrant D Data is divided into 100 sec bins |
 |
 |
| Parameter | Plot |
|---|---|
| CZT HV Monitor | 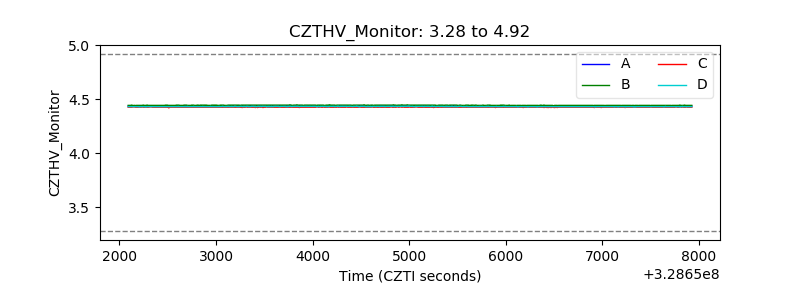 |
| D_VDD | 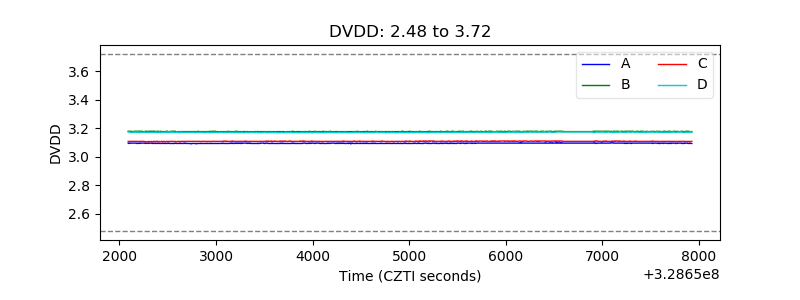 |
| Temperature 1 | 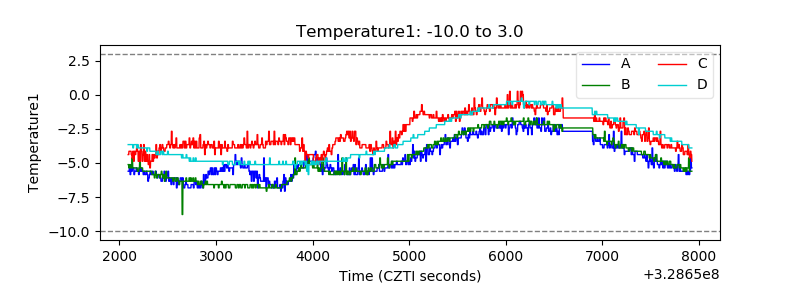 |
| Veto HV Monitor | 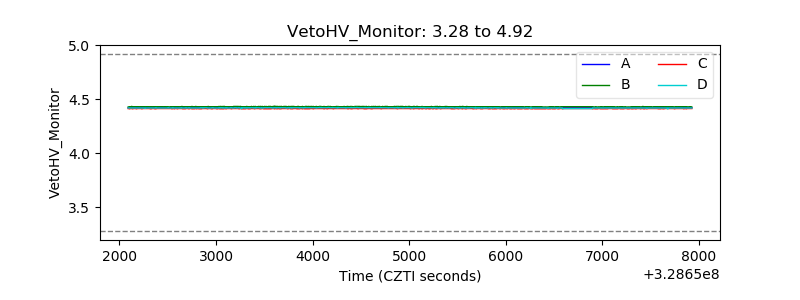 |
| Veto LLD | 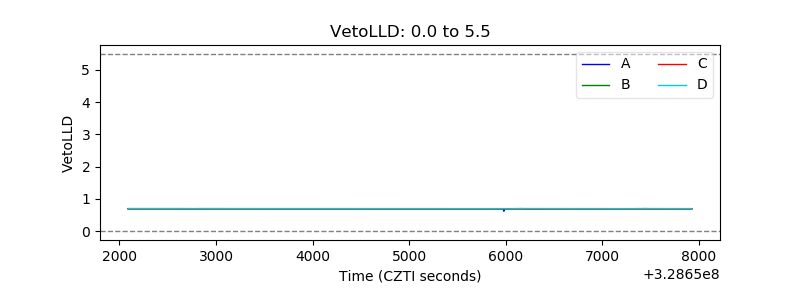 |
| Alpha Counter | 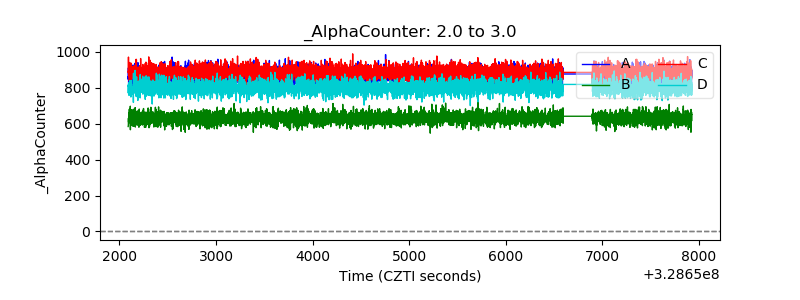 |
| _CPM_Rate | 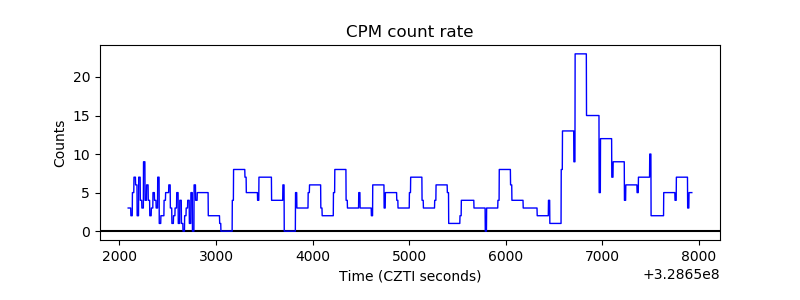 |
| CZT Counter | 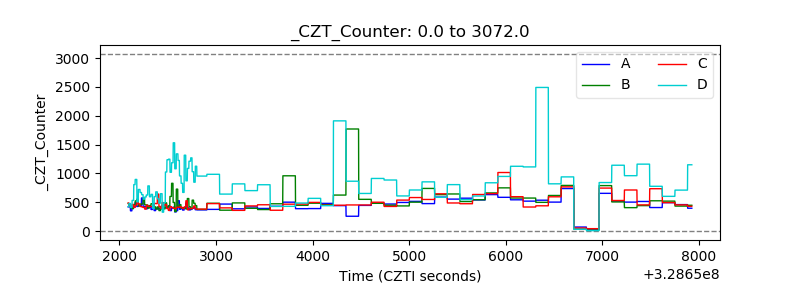 |
| +2.5 Volts monitor |  |
| +5 Volts monitor |  |
| _ROLL_ROT | 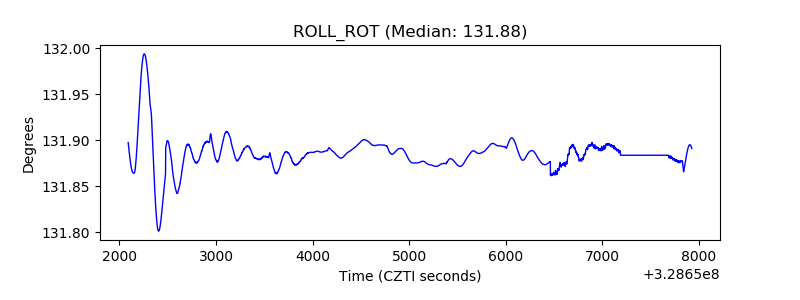 |
| _Roll_DEC | 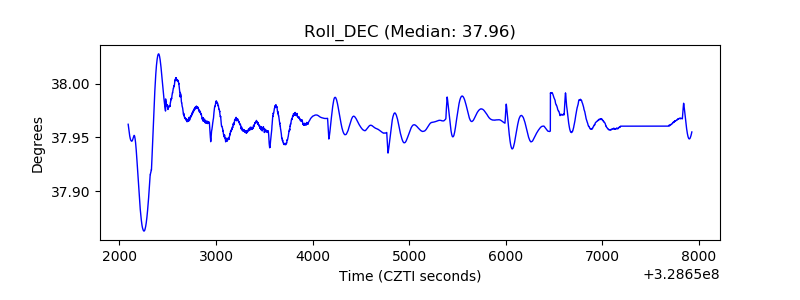 |
| _Roll_RA | 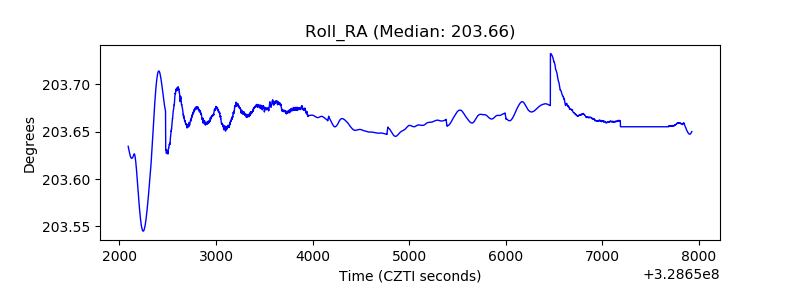 |
| Veto Counter | 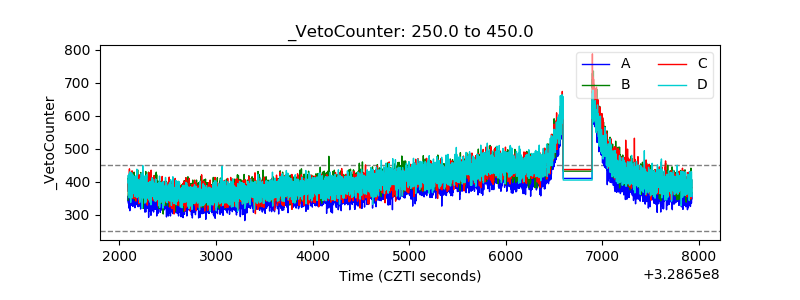 |