| Param | Original file | Final file |
|---|---|---|
| Filename | modeM0/AS1A09_022T01_9000003702cztM0_level2.fits | modeM0/AS1A09_022T01_9000003702cztM0_level2_quad_clean.evt |
| Size (bytes) | 1,382,149,440 | 1,249,873,920 |
| Size | 1.3 GB | 1.2 GB |
| Events in quadrant A | 8,596,240 | 7,528,350 |
| Events in quadrant B | 8,245,984 | 7,615,258 |
| Events in quadrant C | 8,476,474 | 7,345,410 |
| Events in quadrant D | 6,965,708 | 5,796,470 |
| Mode SS | |||
|---|---|---|---|
| Quadrant | BADHDUFLAG | Total packets | Discarded packets |
| A | 0 | 2842 | 0 |
| B | 0 | 2842 | 0 |
| C | 0 | 2842 | 0 |
| D | 0 | 2842 | 0 |
| Mode M9 | |||
|---|---|---|---|
| Quadrant | BADHDUFLAG | Total packets | Discarded packets |
| A | 0 | 208 | 0 |
| B | 0 | 208 | 0 |
| C | 0 | 208 | 0 |
| D | 0 | 208 | 0 |
| Mode M0 | |||
|---|---|---|---|
| Quadrant | BADHDUFLAG | Total packets | Discarded packets |
| A | 0 | 348735 | 0 |
| B | 0 | 317737 | 0 |
| C | 0 | 294668 | 0 |
| D | 0 | 456981 | 0 |
| Quadrant | Total seconds | Saturated seconds | Saturation percentage |
|---|---|---|---|
| A | 139593 | 6207 | 4.446498% |
| B | 139595 | 3463 | 2.480748% |
| C | 139595 | 2249 | 1.611089% |
| D | 139592 | 17330 | 12.414752% |
Noise dominated data is calculated using 1-second bins in cleaned event files. If a bin has >2000 counts, and if more than 50% of those come from <1% of pixels, then it is considered to be noise-dominated and hence unusable.
| Quadrant | # 1 sec bins | Bins with >0 counts | Bins with >2000 counts | High rate bins dominated by noise | Noise dominated (total time) | Noise dominated (detector-on time) | Marked lightcurve |
|---|---|---|---|---|---|---|---|
| A | 167172 | 139587 | 0 | 0 | 0.00% | 0.00% |  |
| B | 167172 | 139573 | 0 | 0 | 0.00% | 0.00% |  |
| C | 167172 | 139592 | 0 | 0 | 0.00% | 0.00% |  |
| D | 167172 | 138284 | 0 | 0 | 0.00% | 0.00% |  |
Top three noisy pixels from each quadrant. If the there are fewer than three noisy pixels in the level2.evt file, extra rows are filled as -1
| Pixel properties | Quadrant properties | ||||||
|---|---|---|---|---|---|---|---|
| Quadrant | DetID | PixID | Counts | Sigma | Mean | Median | Sigma |
| A | 0 | 29 | 8164 | 11.24 | 2241 | 2111 | 538.4 |
| A | 7 | 110 | 6727 | 8.57 | 2241 | 2111 | 538.4 |
| A | 9 | 19 | 6502 | 8.16 | 2241 | 2111 | 538.4 |
| B | 2 | 9 | 6470 | 10.48 | 2184 | 2093 | 417.5 |
| B | 2 | 8 | 5526 | 8.22 | 2184 | 2093 | 417.5 |
| B | 5 | 128 | 5458 | 8.06 | 2184 | 2093 | 417.5 |
| C | 1 | 81 | 6686 | 8.11 | 2240 | 2107 | 564.3 |
| C | 1 | 80 | 6590 | 7.94 | 2240 | 2107 | 564.3 |
| C | 12 | 241 | 5847 | 6.63 | 2240 | 2107 | 564.3 |
| D | 15 | 46 | 4911 | 5.86 | 1992 | 1820 | 527.8 |
| D | 10 | 189 | 4896 | 5.83 | 1992 | 1820 | 527.8 |
| D | 7 | 3 | 4849 | 5.74 | 1992 | 1820 | 527.8 |
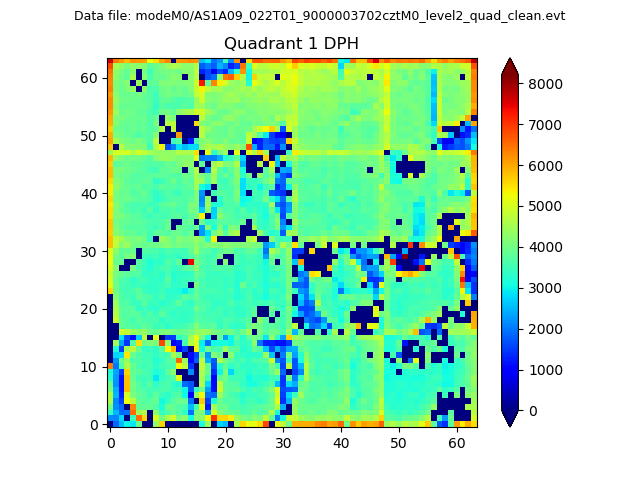
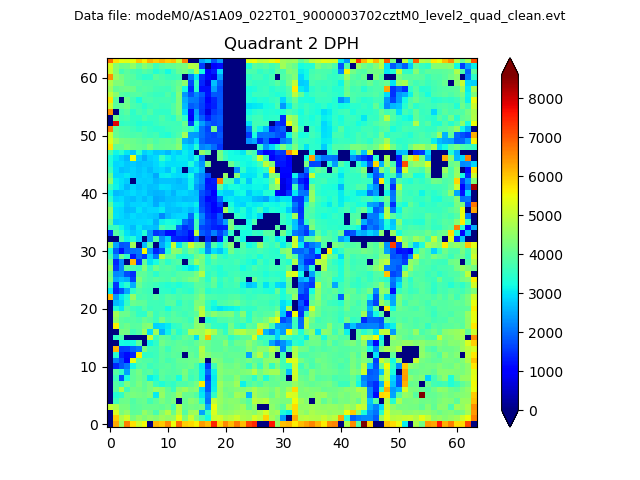
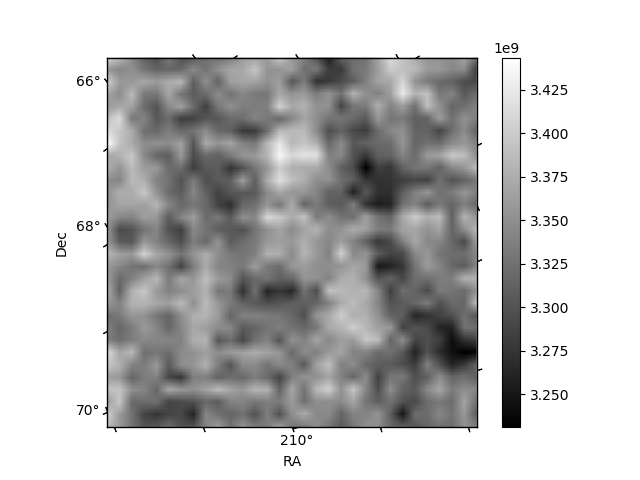
Histogram calculated using DETX and DETY for each event in the final _common_clean file
| Quadrant A |  |
 |
Quadrant B |
|---|---|---|---|
| Quadrant D |  |
 |
Quadrant C |
| Plot type | Count rate plots | Images |
|---|---|---|
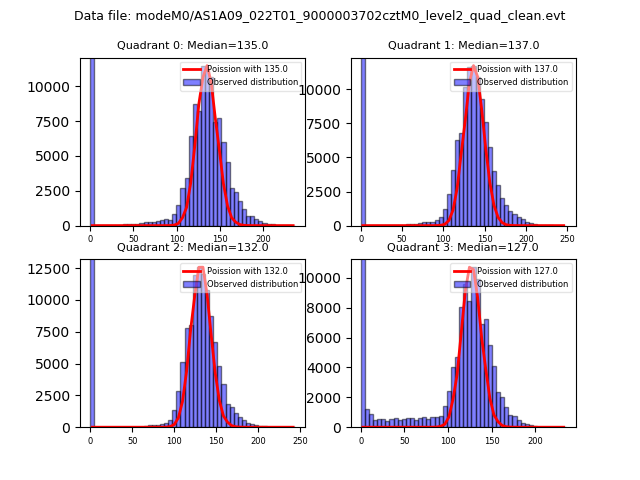
| Comparison with Poisson distribution Blue bars denote a histogram of data divided into 1 sec bins. Red curve is a Poisson curve with rate = median count rate of data. |
 |
 |
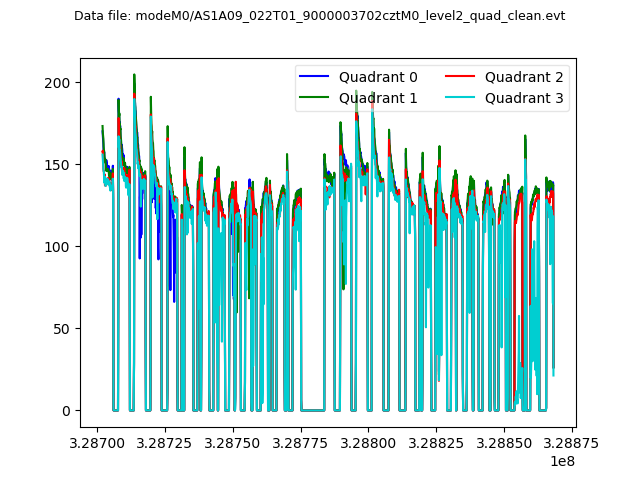
| Quadrant-wise count rates Data is divided into 100 sec bins |
 |
|
| Module-wise count rates for Quadrant A Data is divided into 100 sec bins |
 |
 |
| Module-wise count rates for Quadrant B Data is divided into 100 sec bins |
 |
 |
| Module-wise count rates for Quadrant C Data is divided into 100 sec bins |
 |
 |
| Module-wise count rates for Quadrant D Data is divided into 100 sec bins |
 |
 |
| Parameter | Plot |
|---|---|
| CZT HV Monitor |  |
| D_VDD | 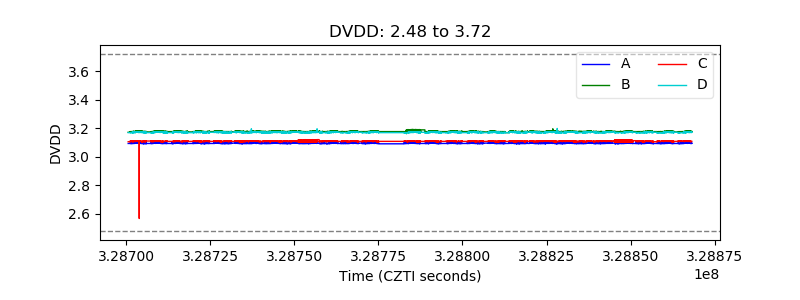 |
| Temperature 1 |  |
| Veto HV Monitor |  |
| Veto LLD | 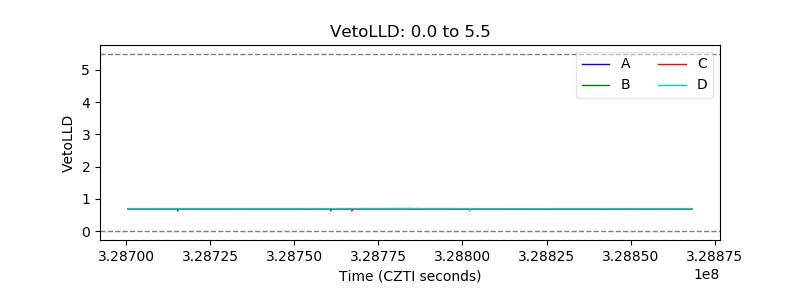 |
| Alpha Counter |  |
| _CPM_Rate |  |
| CZT Counter |  |
| +2.5 Volts monitor |  |
| +5 Volts monitor | 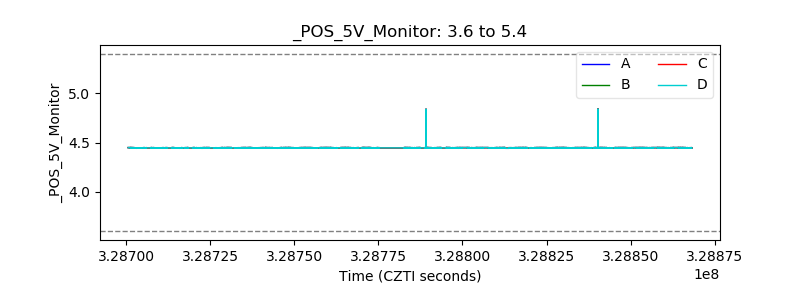 |
| _ROLL_ROT | 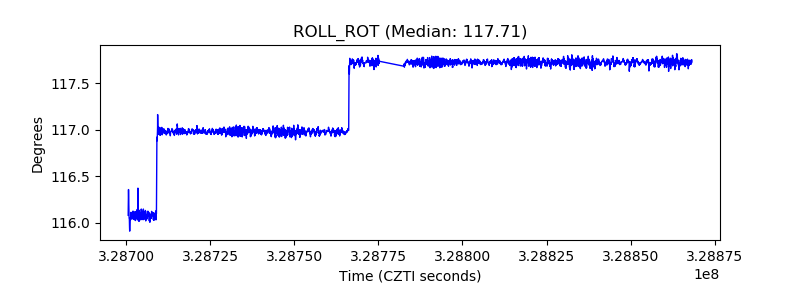 |
| _Roll_DEC |  |
| _Roll_RA | 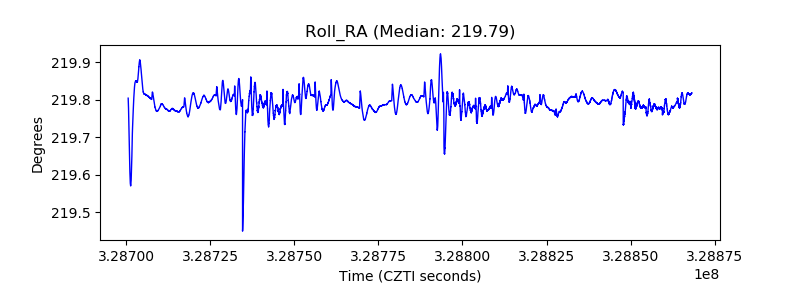 |
| Veto Counter | 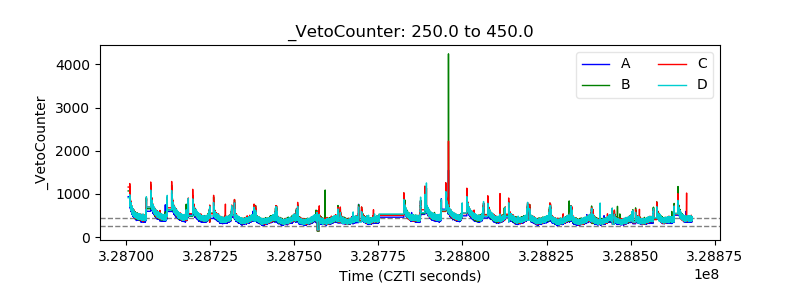 |