| Param | Original file | Final file |
|---|---|---|
| Filename | modeM0/AS1A09_022T01_9000003702_25285cztM0_level2.evt | modeM0/AS1A09_022T01_9000003702_25285cztM0_level2_quad_clean.evt |
| Size (bytes) | 139,838,400 | 17,303,040 |
| Size | 133.4 MB | 16.5 MB |
| Events in quadrant A | 964,760 | 104,950 |
| Events in quadrant B | 1,233,705 | 106,972 |
| Events in quadrant C | 934,387 | 96,971 |
| Events in quadrant D | 991,241 | 96,639 |
| Mode M9 | |||
|---|---|---|---|
| Quadrant | BADHDUFLAG | Total packets | Discarded packets |
| A | 0 | 5 | 0 |
| B | 0 | 5 | 0 |
| C | 0 | 5 | 0 |
| D | 0 | 5 | 0 |
| Mode M0 | |||
|---|---|---|---|
| Quadrant | BADHDUFLAG | Total packets | Discarded packets |
| A | 0 | 3964 | 0 |
| B | 0 | 4711 | 0 |
| C | 0 | 3811 | 0 |
| D | 0 | 4053 | 0 |
| Quadrant | Total seconds | Saturated seconds | Saturation percentage |
|---|---|---|---|
| A | 1597 | 4 | 0.250470% |
| B | 1596 | 155 | 9.711779% |
| C | 1596 | 27 | 1.691729% |
| D | 1596 | 3 | 0.187970% |
Noise dominated data is calculated using 1-second bins in cleaned event files. If a bin has >2000 counts, and if more than 50% of those come from <1% of pixels, then it is considered to be noise-dominated and hence unusable.
| Quadrant | # 1 sec bins | Bins with >0 counts | Bins with >2000 counts | High rate bins dominated by noise | Noise dominated (total time) | Noise dominated (detector-on time) | Marked lightcurve |
|---|---|---|---|---|---|---|---|
| A | 1597 | 1597 | 0 | 0 | 0.00% | 0.00% | 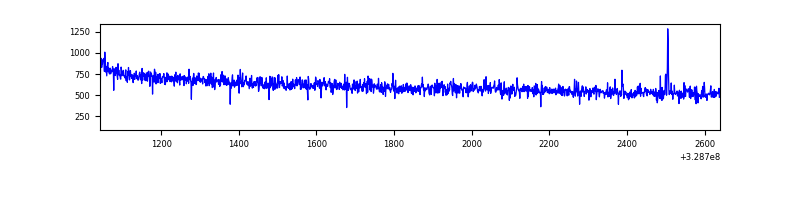 |
| B | 1596 | 1596 | 75 | 75 | 4.70% | 4.70% | 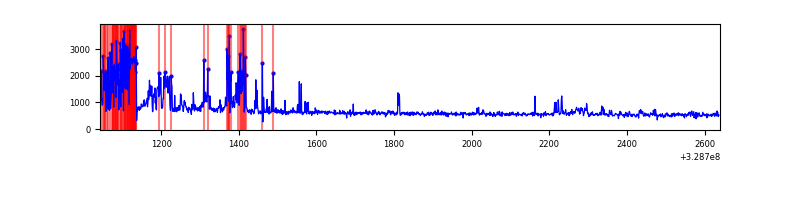 |
| C | 1596 | 1596 | 0 | 0 | 0.00% | 0.00% | 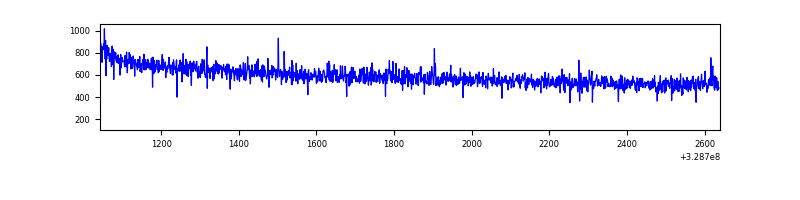 |
| D | 1596 | 1596 | 0 | 0 | 0.00% | 0.00% | 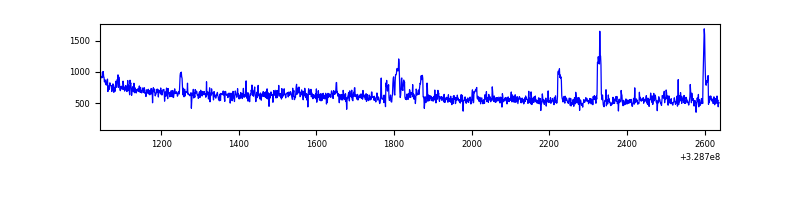 |
Top three noisy pixels from each quadrant. If the there are fewer than three noisy pixels in the level2.evt file, extra rows are filled as -1
| Pixel properties | Quadrant properties | ||||||
|---|---|---|---|---|---|---|---|
| Quadrant | DetID | PixID | Counts | Sigma | Mean | Median | Sigma |
| A | 13 | 254 | 2701 | 48.65 | 249 | 245 | 50.5 |
| A | 13 | 170 | 2652 | 47.68 | 249 | 245 | 50.5 |
| A | 0 | 226 | 2251 | 39.74 | 249 | 245 | 50.5 |
| B | 3 | 64 | 335661 | 7688.05 | 228 | 224 | 43.6 |
| B | 0 | 190 | 7319 | 162.61 | 228 | 224 | 43.6 |
| B | 12 | 111 | 4826 | 105.48 | 228 | 224 | 43.6 |
| C | 14 | 238 | 38644 | 733.4 | 226 | 228 | 52.4 |
| C | 0 | 207 | 8891 | 165.39 | 226 | 228 | 52.4 |
| C | 0 | 239 | 4048 | 72.93 | 226 | 228 | 52.4 |
| D | 8 | 195 | 51915 | 892.61 | 235 | 228 | 57.9 |
| D | 1 | 52 | 25570 | 437.64 | 235 | 228 | 57.9 |
| D | 12 | 235 | 16319 | 277.88 | 235 | 228 | 57.9 |
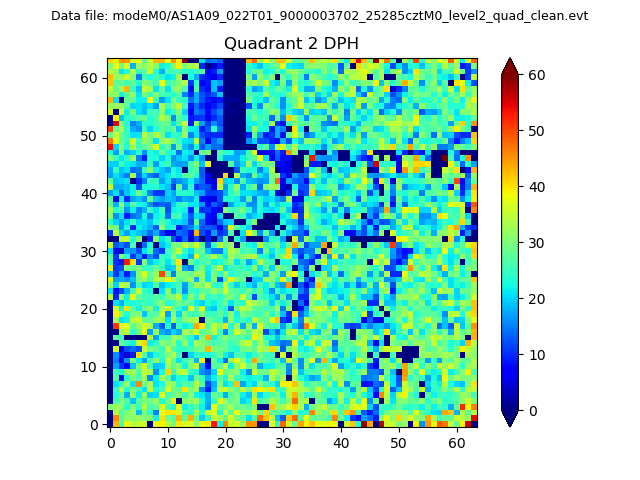
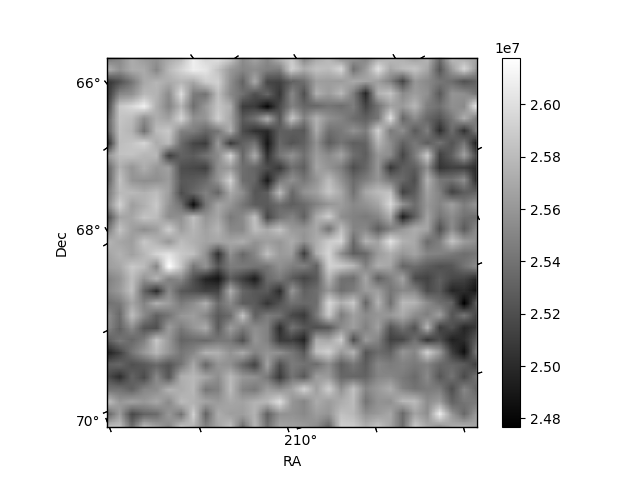
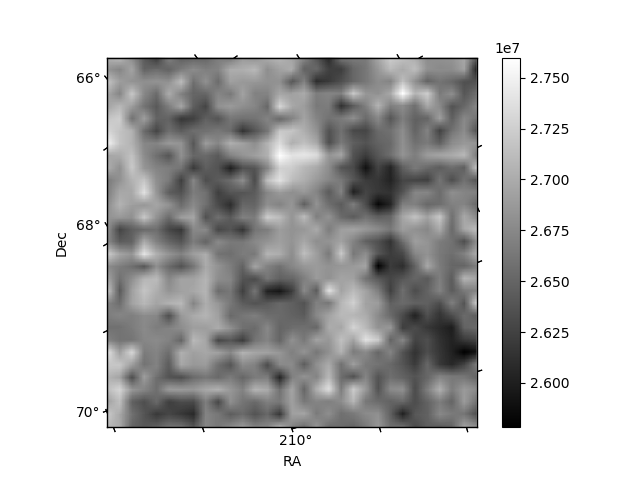
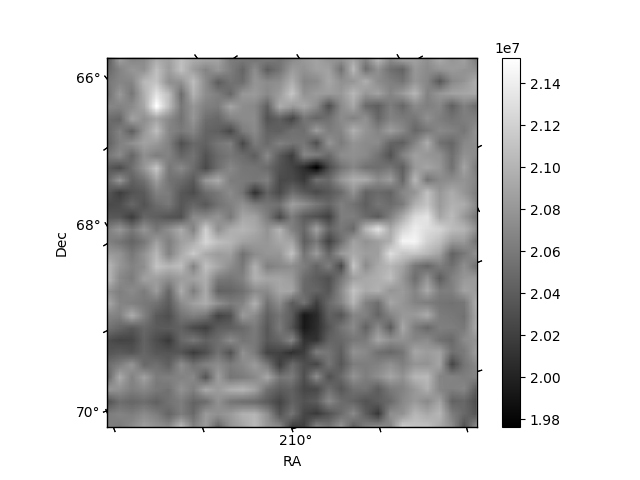
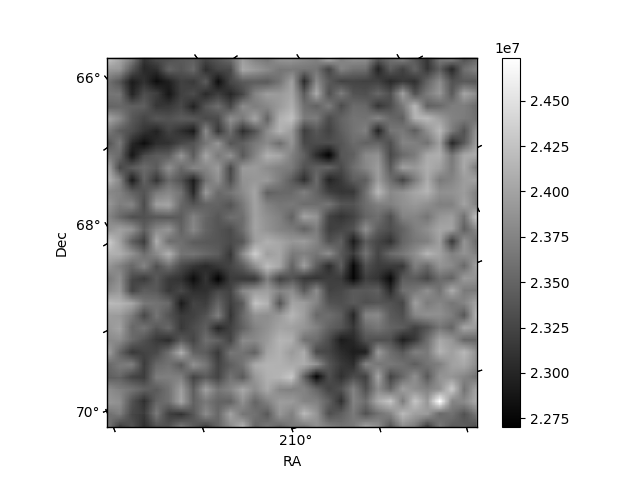
Histogram calculated using DETX and DETY for each event in the final _common_clean file
| Quadrant A | 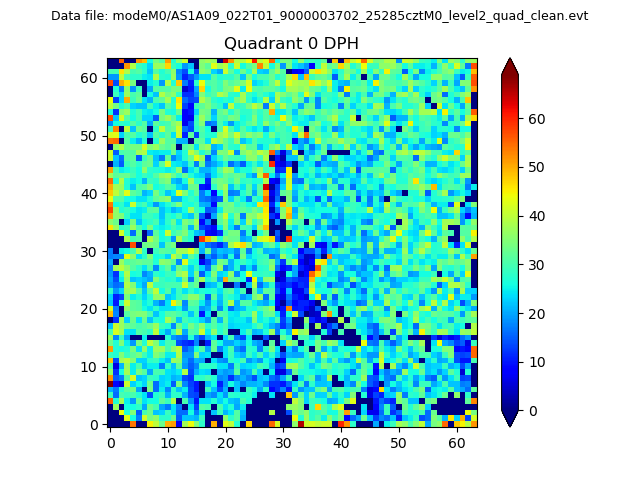 |
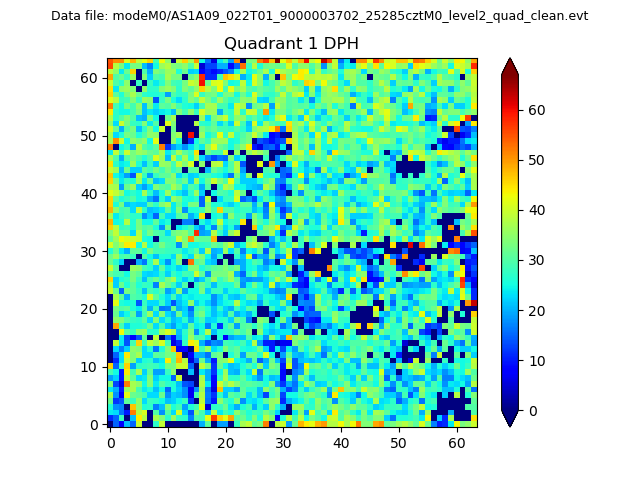 |
Quadrant B |
|---|---|---|---|
| Quadrant D | 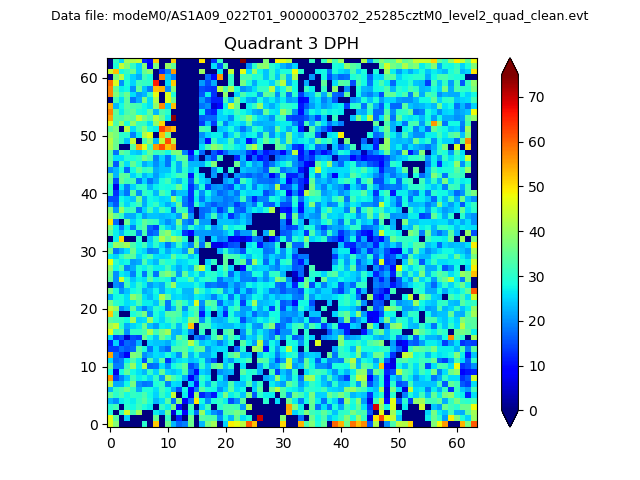 |
 |
Quadrant C |
| Plot type | Count rate plots | Images |
|---|---|---|
| Comparison with Poisson distribution Blue bars denote a histogram of data divided into 1 sec bins. Red curve is a Poisson curve with rate = median count rate of data. |
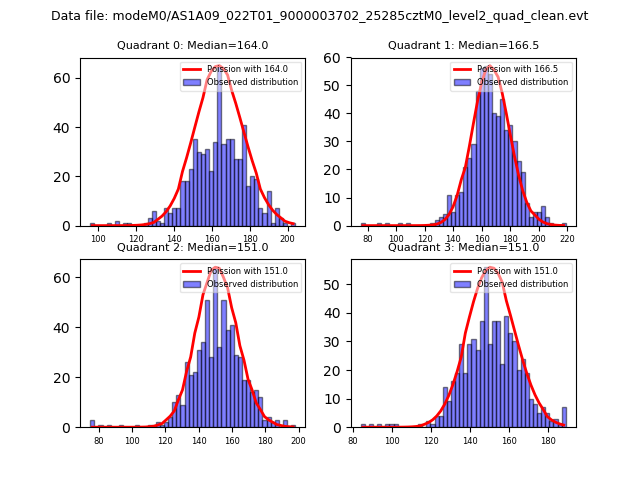 |
 |
| Quadrant-wise count rates Data is divided into 100 sec bins |
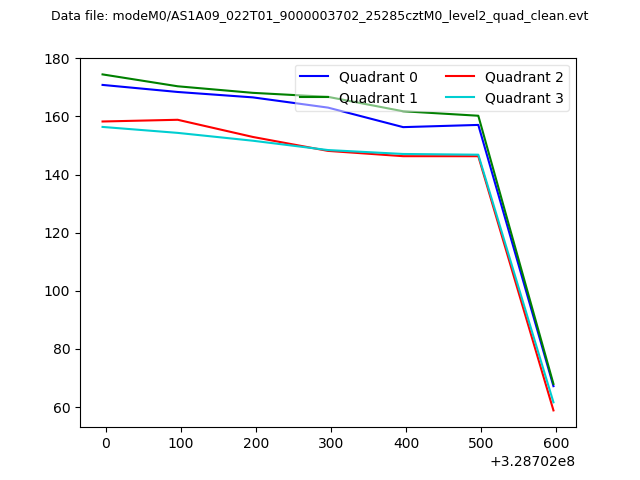 |
|
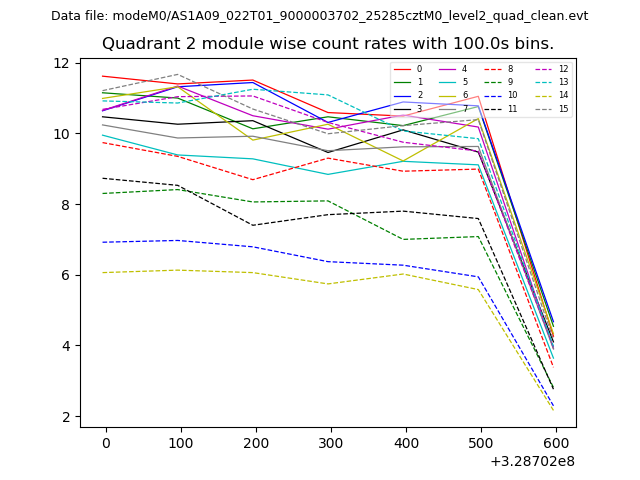
| Module-wise count rates for Quadrant A Data is divided into 100 sec bins |
 |
 |
| Module-wise count rates for Quadrant B Data is divided into 100 sec bins |
 |
 |
| Module-wise count rates for Quadrant C Data is divided into 100 sec bins |
 |
 |
| Module-wise count rates for Quadrant D Data is divided into 100 sec bins |
 |
 |
| Parameter | Plot |
|---|---|
| CZT HV Monitor | 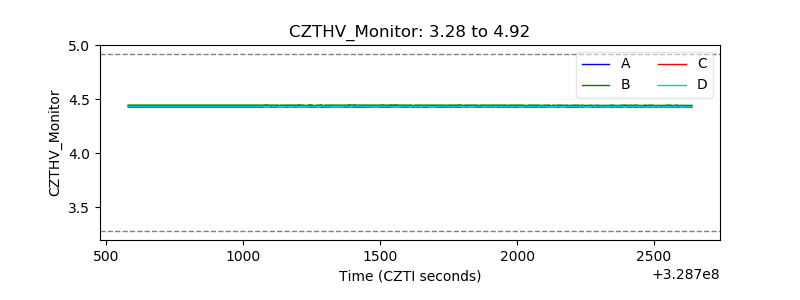 |
| D_VDD | 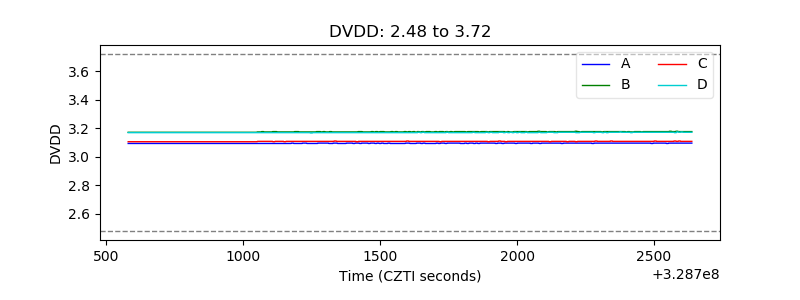 |
| Temperature 1 | 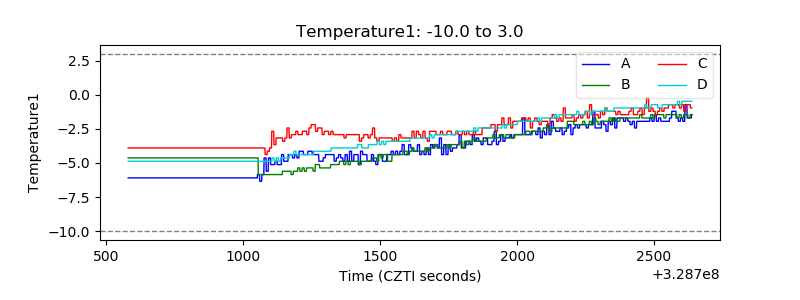 |
| Veto HV Monitor |  |
| Veto LLD | 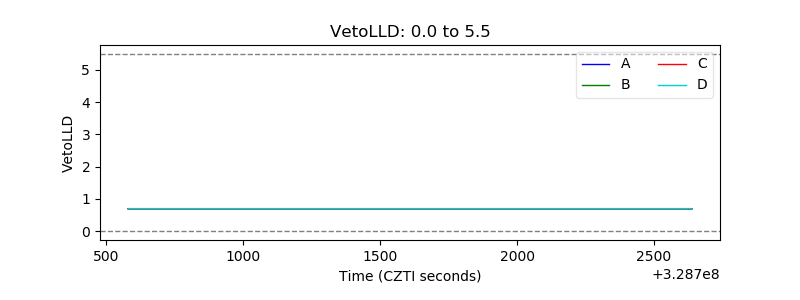 |
| Alpha Counter | 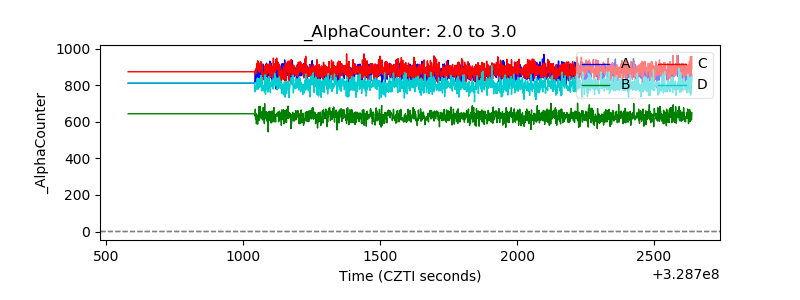 |
| _CPM_Rate | 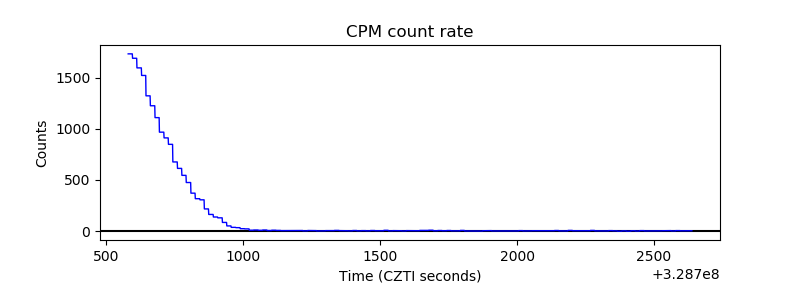 |
| CZT Counter |  |
| +2.5 Volts monitor | 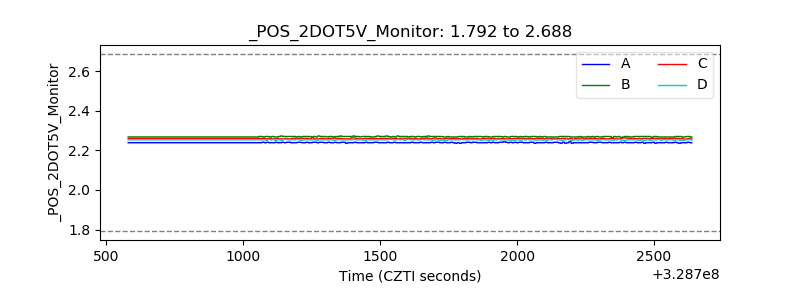 |
| +5 Volts monitor |  |
| _ROLL_ROT | 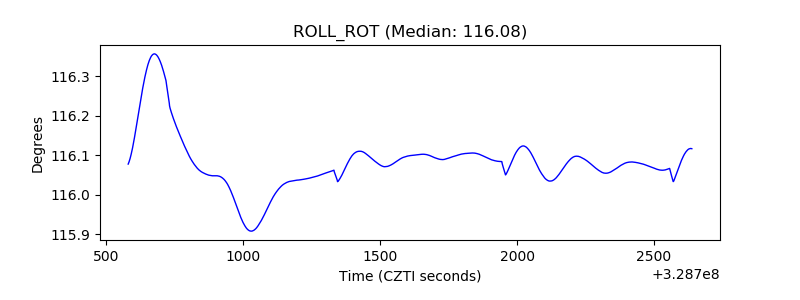 |
| _Roll_DEC |  |
| _Roll_RA |  |
| Veto Counter |  |