| Param | Original file | Final file |
|---|---|---|
| Filename | modeM0/AS1A09_022T01_9000003702_25286cztM0_level2.evt | modeM0/AS1A09_022T01_9000003702_25286cztM0_level2_quad_clean.evt |
| Size (bytes) | 498,044,160 | 112,953,600 |
| Size | 475.0 MB | 107.7 MB |
| Events in quadrant A | 3,457,212 | 770,821 |
| Events in quadrant B | 3,754,929 | 768,028 |
| Events in quadrant C | 3,446,965 | 724,192 |
| Events in quadrant D | 3,994,436 | 715,869 |
| Mode M9 | |||
|---|---|---|---|
| Quadrant | BADHDUFLAG | Total packets | Discarded packets |
| A | 0 | 12 | 0 |
| B | 0 | 12 | 0 |
| C | 0 | 12 | 0 |
| D | 0 | 12 | 0 |
| Mode M0 | |||
|---|---|---|---|
| Quadrant | BADHDUFLAG | Total packets | Discarded packets |
| A | 0 | 14355 | 0 |
| B | 0 | 15178 | 0 |
| C | 0 | 14115 | 0 |
| D | 0 | 16031 | 0 |
| Quadrant | Total seconds | Saturated seconds | Saturation percentage |
|---|---|---|---|
| A | 6331 | 85 | 1.342600% |
| B | 6331 | 166 | 2.622019% |
| C | 6332 | 121 | 1.910929% |
| D | 6331 | 106 | 1.674301% |
Noise dominated data is calculated using 1-second bins in cleaned event files. If a bin has >2000 counts, and if more than 50% of those come from <1% of pixels, then it is considered to be noise-dominated and hence unusable.
| Quadrant | # 1 sec bins | Bins with >0 counts | Bins with >2000 counts | High rate bins dominated by noise | Noise dominated (total time) | Noise dominated (detector-on time) | Marked lightcurve |
|---|---|---|---|---|---|---|---|
| A | 7611 | 6331 | 0 | 0 | 0.00% | 0.00% | 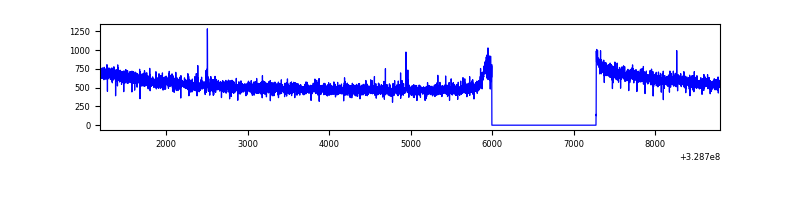 |
| B | 7611 | 6331 | 22 | 22 | 0.29% | 0.35% | 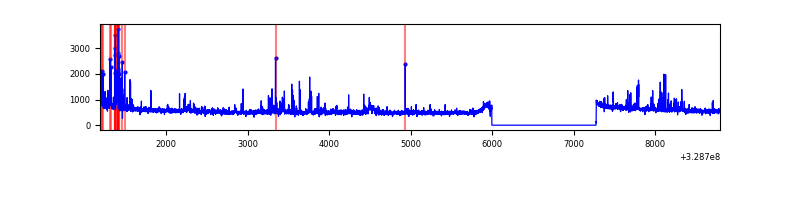 |
| C | 7612 | 6332 | 1 | 1 | 0.01% | 0.02% | 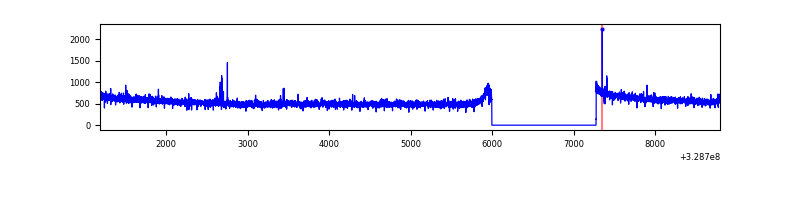 |
| D | 7611 | 6332 | 31 | 31 | 0.41% | 0.49% | 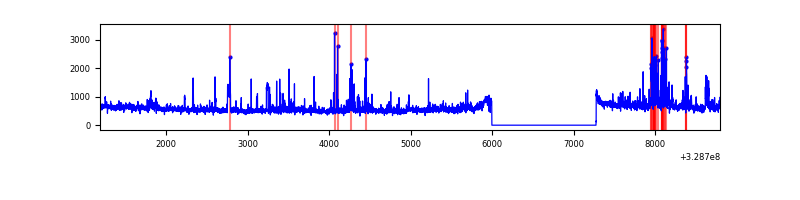 |
Top three noisy pixels from each quadrant. If the there are fewer than three noisy pixels in the level2.evt file, extra rows are filled as -1
| Pixel properties | Quadrant properties | ||||||
|---|---|---|---|---|---|---|---|
| Quadrant | DetID | PixID | Counts | Sigma | Mean | Median | Sigma |
| A | 13 | 254 | 11163 | 58.35 | 894 | 878 | 176.3 |
| A | 0 | 226 | 7907 | 39.88 | 894 | 878 | 176.3 |
| A | 3 | 137 | 7206 | 35.9 | 894 | 878 | 176.3 |
| B | 3 | 64 | 199390 | 1255.09 | 867 | 849 | 158.2 |
| B | 3 | 112 | 134111 | 842.42 | 867 | 849 | 158.2 |
| B | 12 | 111 | 18058 | 108.79 | 867 | 849 | 158.2 |
| C | 14 | 238 | 139865 | 724.86 | 838 | 846 | 191.8 |
| C | 0 | 207 | 19915 | 99.43 | 838 | 846 | 191.8 |
| C | 0 | 239 | 14362 | 70.47 | 838 | 846 | 191.8 |
| D | 1 | 52 | 382858 | 1844.29 | 862 | 839 | 207.1 |
| D | 8 | 195 | 236900 | 1139.64 | 862 | 839 | 207.1 |
| D | 12 | 233 | 79235 | 378.48 | 862 | 839 | 207.1 |
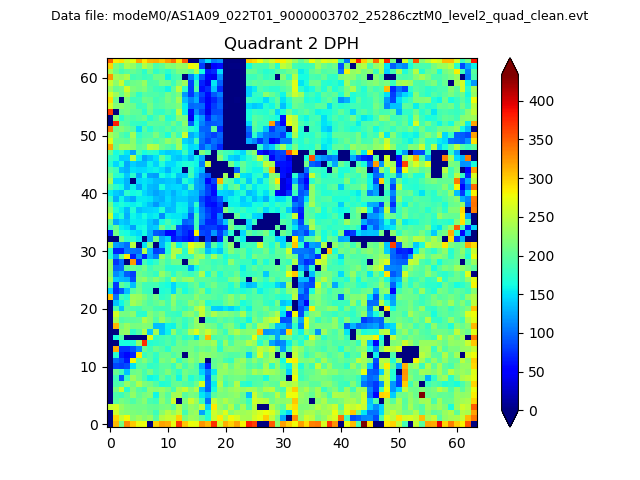
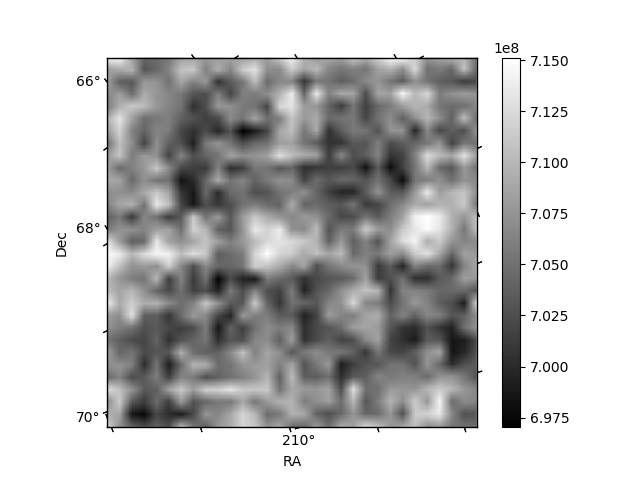
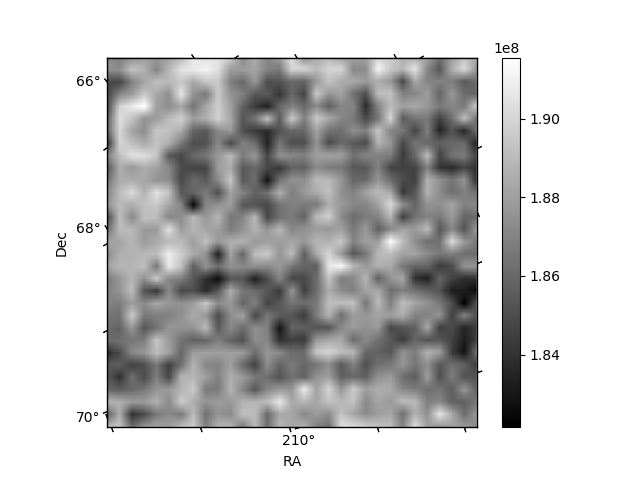
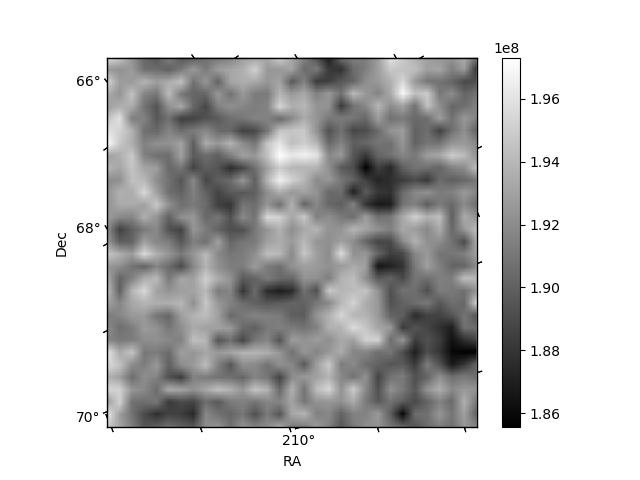
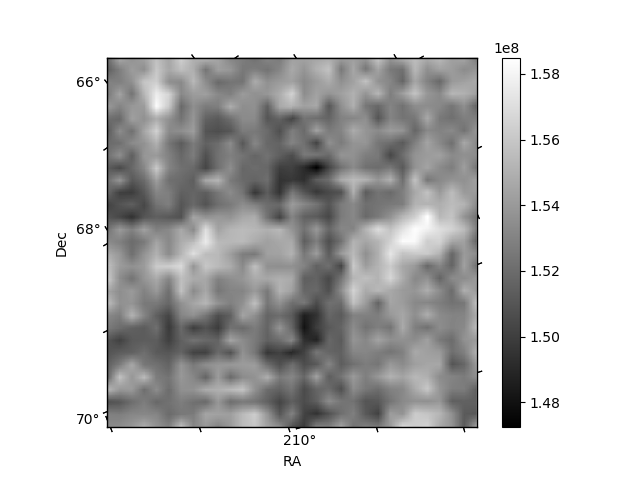
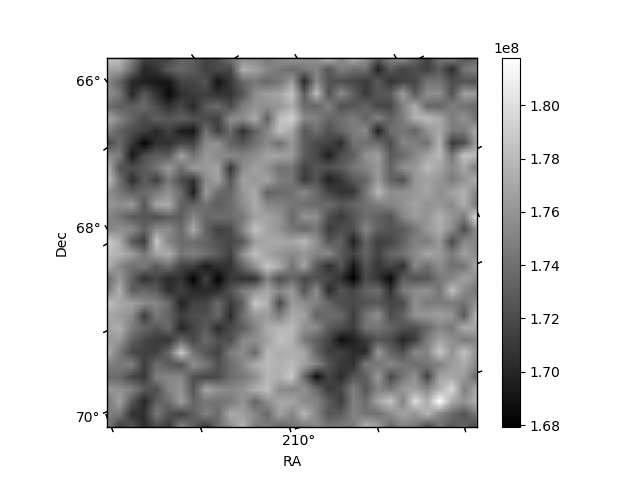
Histogram calculated using DETX and DETY for each event in the final _common_clean file
| Quadrant A | 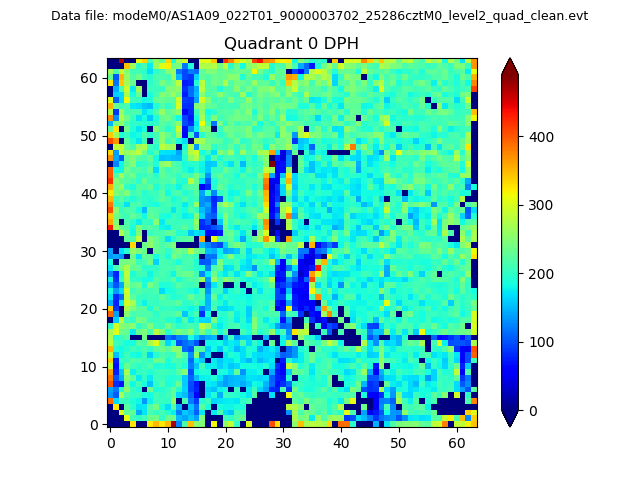 |
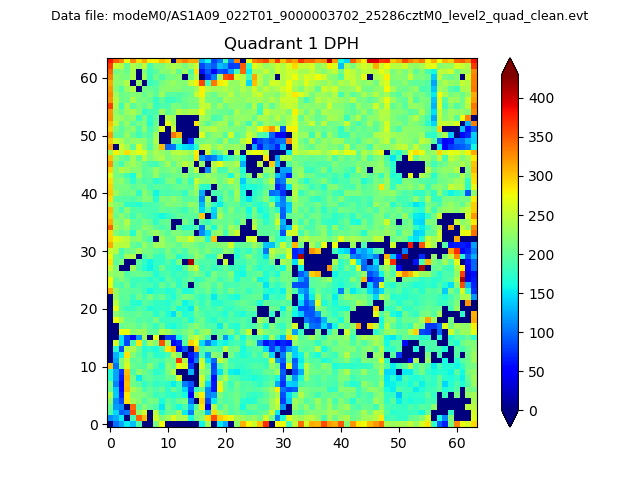 |
Quadrant B |
|---|---|---|---|
| Quadrant D | 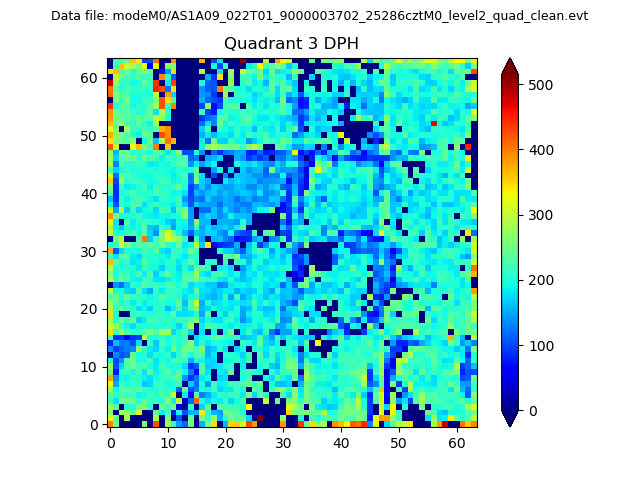 |
 |
Quadrant C |
| Plot type | Count rate plots | Images |
|---|---|---|
| Comparison with Poisson distribution Blue bars denote a histogram of data divided into 1 sec bins. Red curve is a Poisson curve with rate = median count rate of data. |
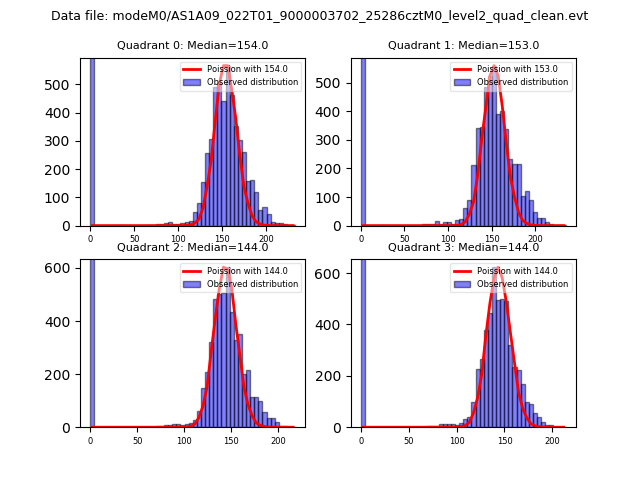 |
 |
| Quadrant-wise count rates Data is divided into 100 sec bins |
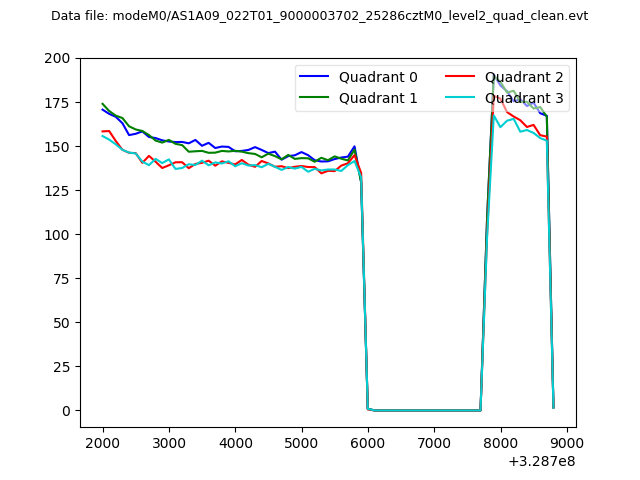 |
|
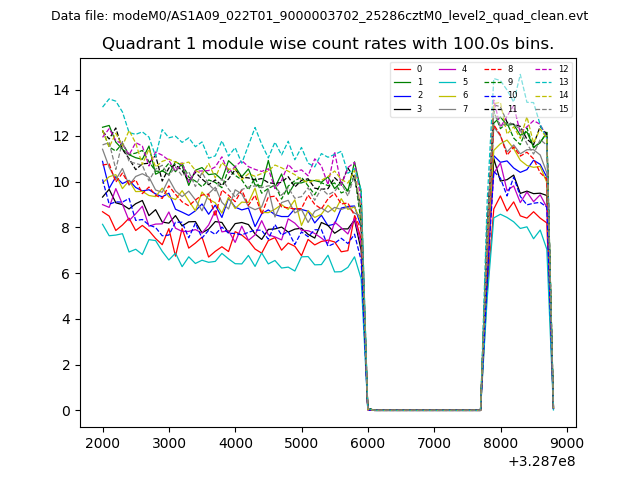
| Module-wise count rates for Quadrant A Data is divided into 100 sec bins |
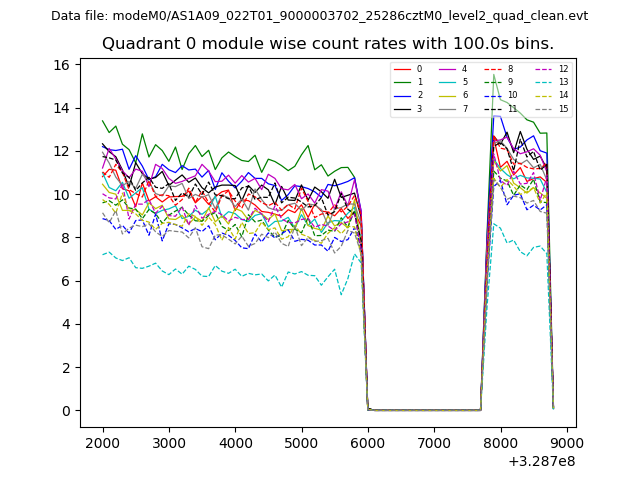 |
 |
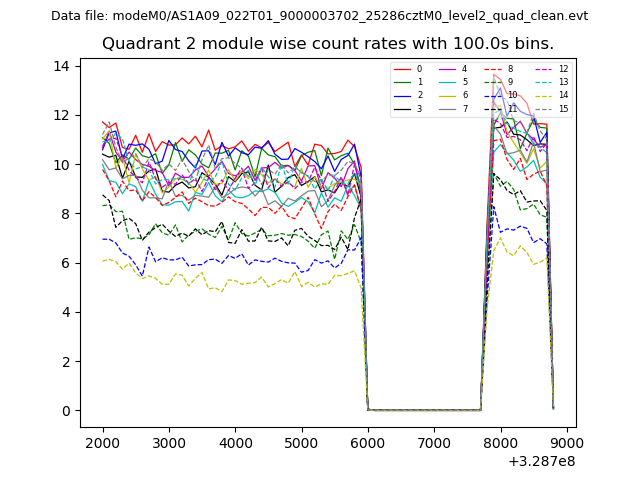
| Module-wise count rates for Quadrant B Data is divided into 100 sec bins |
 |
 |
| Module-wise count rates for Quadrant C Data is divided into 100 sec bins |
 |
 |
| Module-wise count rates for Quadrant D Data is divided into 100 sec bins |
 |
 |
| Parameter | Plot |
|---|---|
| CZT HV Monitor | 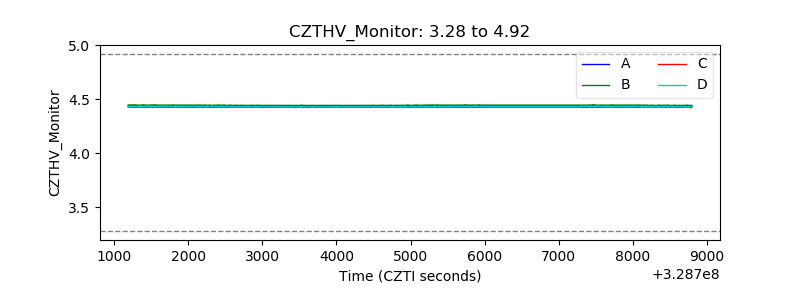 |
| D_VDD | 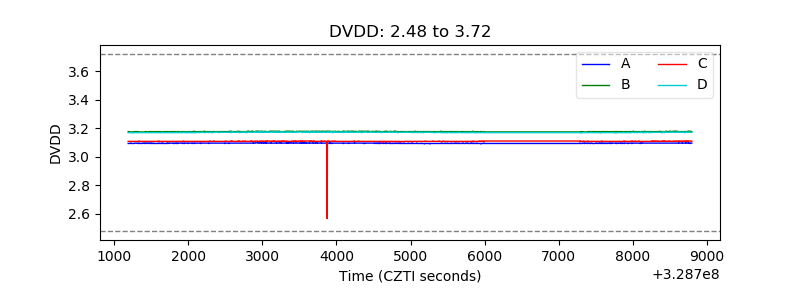 |
| Temperature 1 | 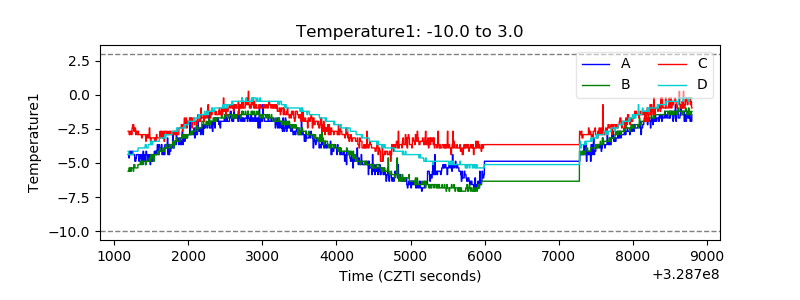 |
| Veto HV Monitor | 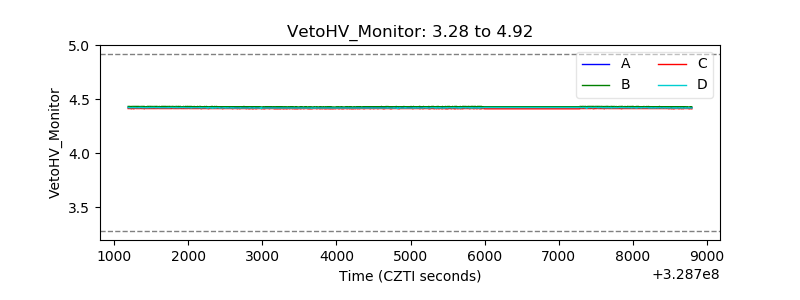 |
| Veto LLD | 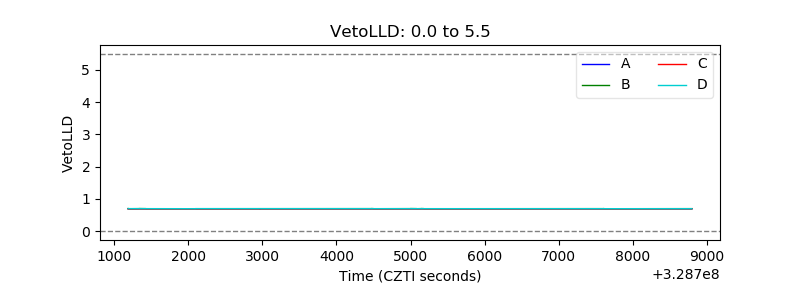 |
| Alpha Counter | 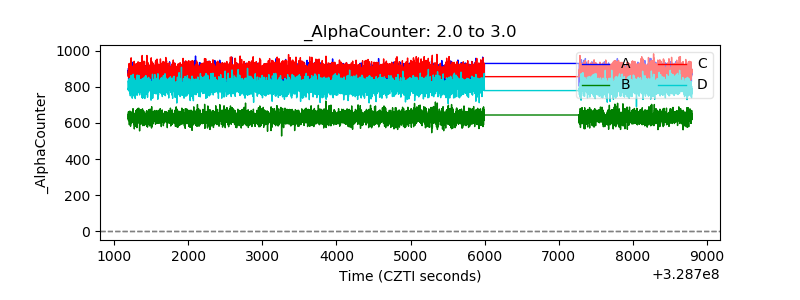 |
| _CPM_Rate | 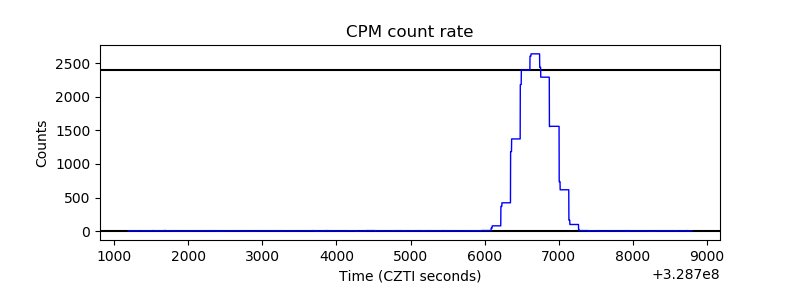 |
| CZT Counter | 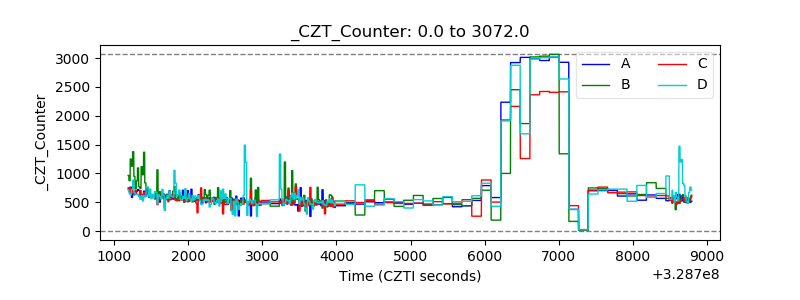 |
| +2.5 Volts monitor |  |
| +5 Volts monitor |  |
| _ROLL_ROT |  |
| _Roll_DEC | 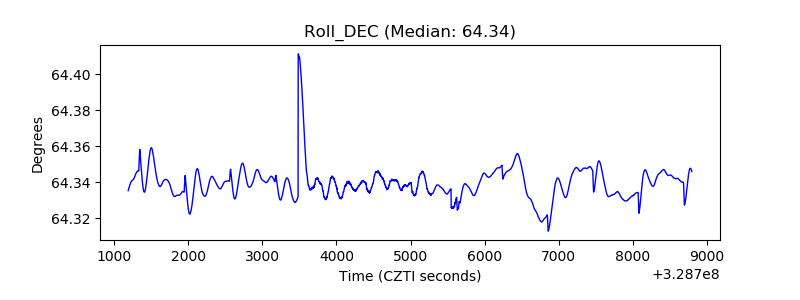 |
| _Roll_RA | 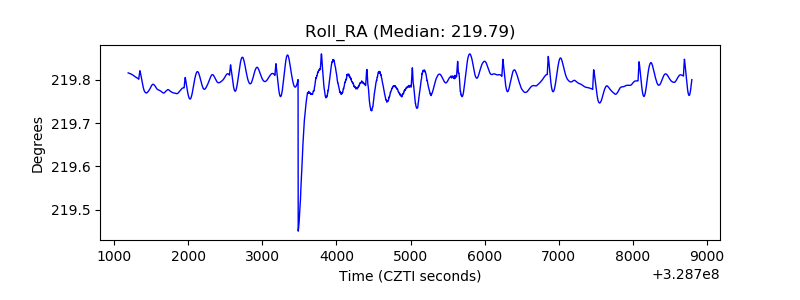 |
| Veto Counter |  |