| Param | Original file | Final file |
|---|---|---|
| Filename | modeM0/AS1A09_022T01_9000003702_25287cztM0_level2.evt | modeM0/AS1A09_022T01_9000003702_25287cztM0_level2_quad_clean.evt |
| Size (bytes) | 545,993,280 | 131,716,800 |
| Size | 520.7 MB | 125.6 MB |
| Events in quadrant A | 3,589,104 | 913,768 |
| Events in quadrant B | 3,676,407 | 911,892 |
| Events in quadrant C | 3,637,116 | 867,512 |
| Events in quadrant D | 5,195,134 | 845,911 |
| Mode M9 | |||
|---|---|---|---|
| Quadrant | BADHDUFLAG | Total packets | Discarded packets |
| A | 0 | 15 | 0 |
| B | 0 | 16 | 0 |
| C | 0 | 16 | 0 |
| D | 0 | 16 | 0 |
| Mode M0 | |||
|---|---|---|---|
| Quadrant | BADHDUFLAG | Total packets | Discarded packets |
| A | 0 | 14880 | 0 |
| B | 0 | 15096 | 0 |
| C | 0 | 14850 | 0 |
| D | 0 | 20191 | 0 |
| Quadrant | Total seconds | Saturated seconds | Saturation percentage |
|---|---|---|---|
| A | 6456 | 132 | 2.044610% |
| B | 6456 | 152 | 2.354399% |
| C | 6456 | 175 | 2.710657% |
| D | 6456 | 195 | 3.020446% |
Noise dominated data is calculated using 1-second bins in cleaned event files. If a bin has >2000 counts, and if more than 50% of those come from <1% of pixels, then it is considered to be noise-dominated and hence unusable.
| Quadrant | # 1 sec bins | Bins with >0 counts | Bins with >2000 counts | High rate bins dominated by noise | Noise dominated (total time) | Noise dominated (detector-on time) | Marked lightcurve |
|---|---|---|---|---|---|---|---|
| A | 7766 | 6457 | 0 | 0 | 0.00% | 0.00% |  |
| B | 7766 | 6457 | 3 | 3 | 0.04% | 0.05% |  |
| C | 7766 | 6456 | 5 | 5 | 0.06% | 0.08% |  |
| D | 7766 | 6457 | 80 | 80 | 1.03% | 1.24% |  |
Top three noisy pixels from each quadrant. If the there are fewer than three noisy pixels in the level2.evt file, extra rows are filled as -1
| Pixel properties | Quadrant properties | ||||||
|---|---|---|---|---|---|---|---|
| Quadrant | DetID | PixID | Counts | Sigma | Mean | Median | Sigma |
| A | 13 | 254 | 10473 | 52.4 | 927 | 912 | 182.5 |
| A | 0 | 226 | 8231 | 40.11 | 927 | 912 | 182.5 |
| A | 3 | 137 | 7298 | 35.0 | 927 | 912 | 182.5 |
| B | 3 | 112 | 79517 | 479.21 | 901 | 883 | 164.1 |
| B | 3 | 64 | 37528 | 223.32 | 901 | 883 | 164.1 |
| B | 12 | 111 | 18502 | 107.37 | 901 | 883 | 164.1 |
| C | 14 | 238 | 143739 | 709.49 | 878 | 886 | 201.3 |
| C | 0 | 239 | 51411 | 250.94 | 878 | 886 | 201.3 |
| C | 7 | 247 | 10187 | 46.19 | 878 | 886 | 201.3 |
| D | 1 | 52 | 1370542 | 6413.37 | 898 | 876 | 213.6 |
| D | 8 | 195 | 341051 | 1592.85 | 898 | 876 | 213.6 |
| D | 12 | 233 | 39752 | 182.03 | 898 | 876 | 213.6 |
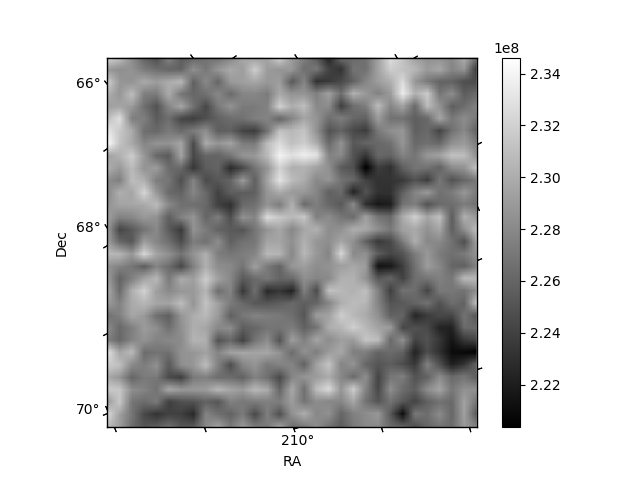
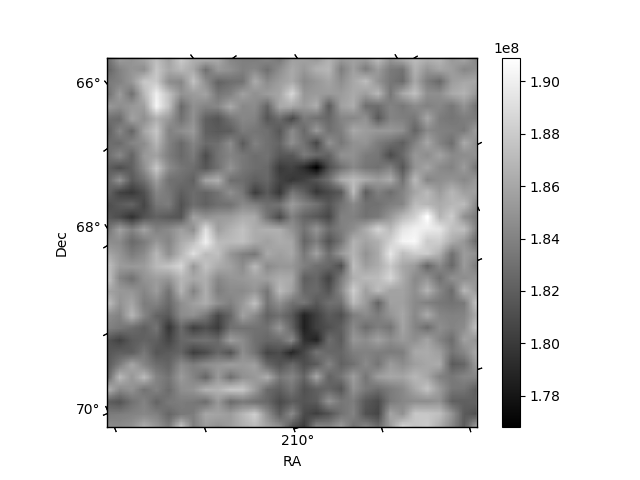
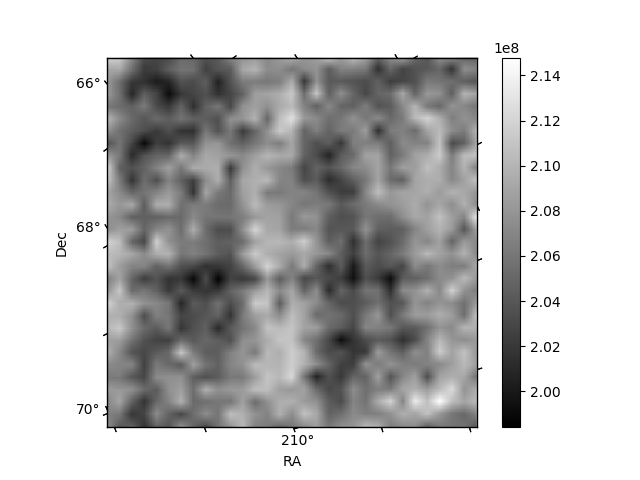
Histogram calculated using DETX and DETY for each event in the final _common_clean file
| Quadrant A | 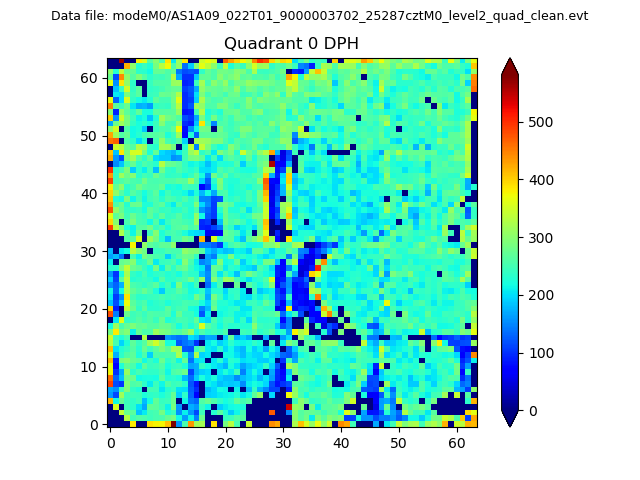 |
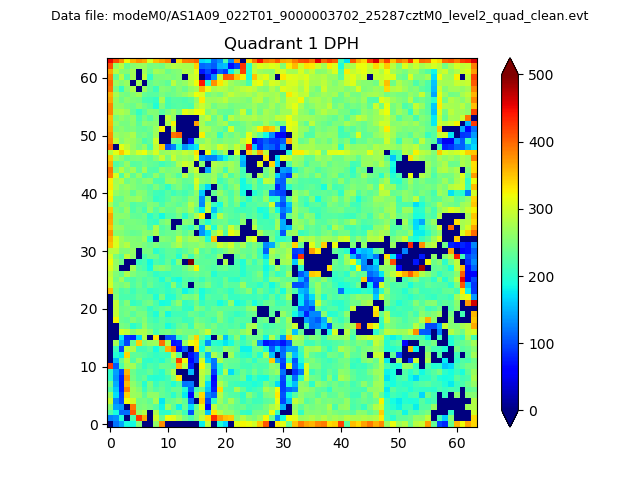 |
Quadrant B |
|---|---|---|---|
| Quadrant D | 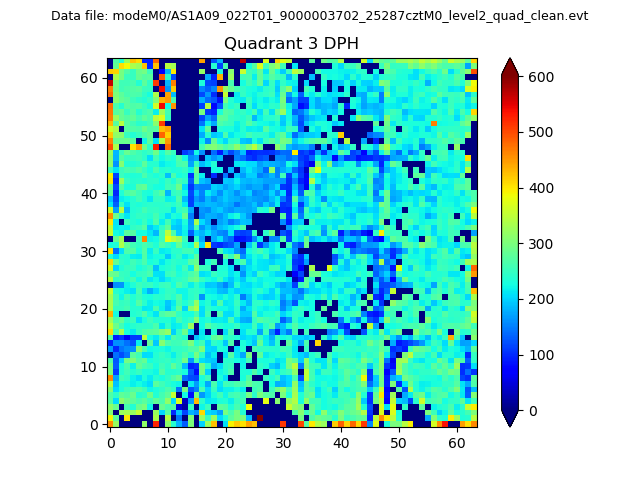 |
 |
Quadrant C |
| Plot type | Count rate plots | Images |
|---|---|---|
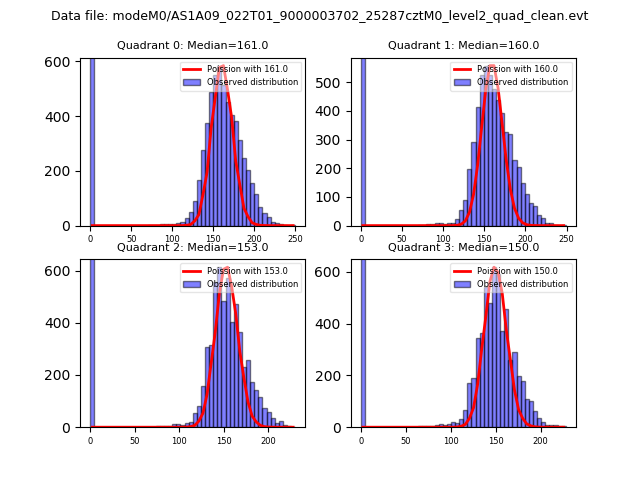
| Comparison with Poisson distribution Blue bars denote a histogram of data divided into 1 sec bins. Red curve is a Poisson curve with rate = median count rate of data. |
 |
 |
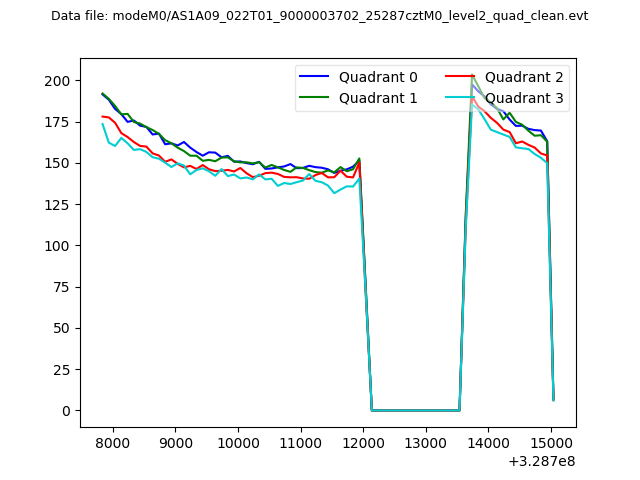
| Quadrant-wise count rates Data is divided into 100 sec bins |
 |
|
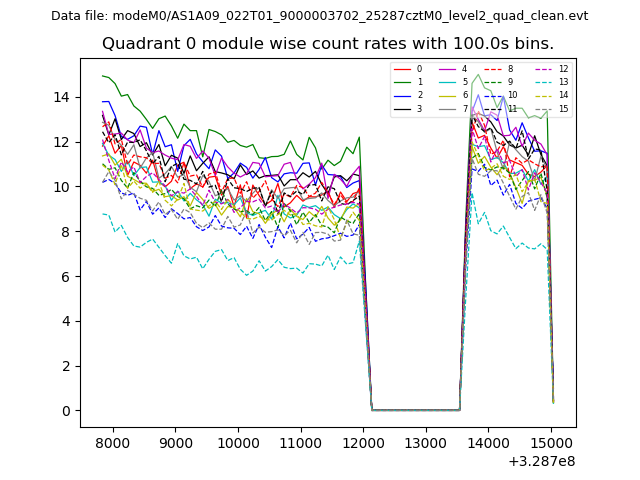
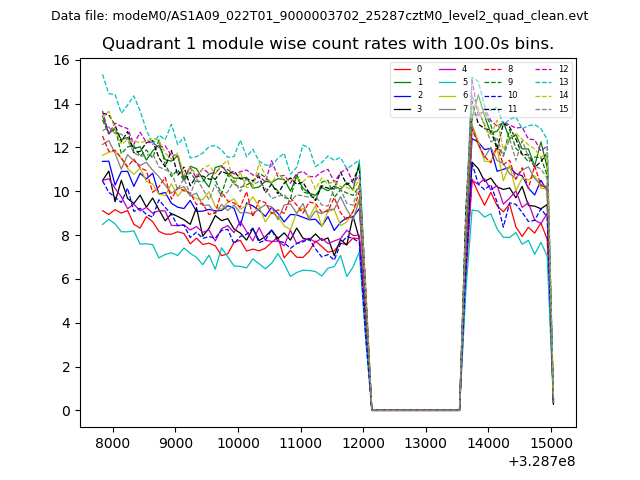
| Module-wise count rates for Quadrant A Data is divided into 100 sec bins |
 |
 |
| Module-wise count rates for Quadrant B Data is divided into 100 sec bins |
 |
 |
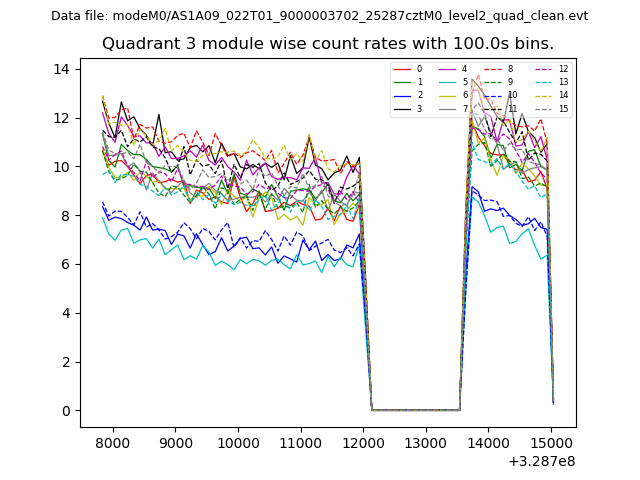
| Module-wise count rates for Quadrant C Data is divided into 100 sec bins |
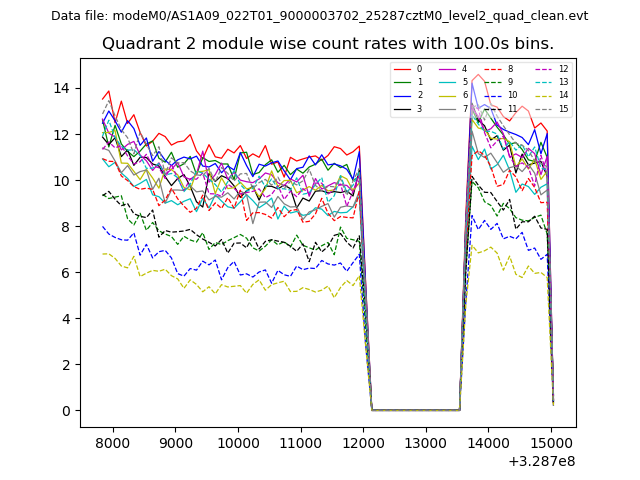 |
 |
| Module-wise count rates for Quadrant D Data is divided into 100 sec bins |
 |
 |
| Parameter | Plot |
|---|---|
| CZT HV Monitor | 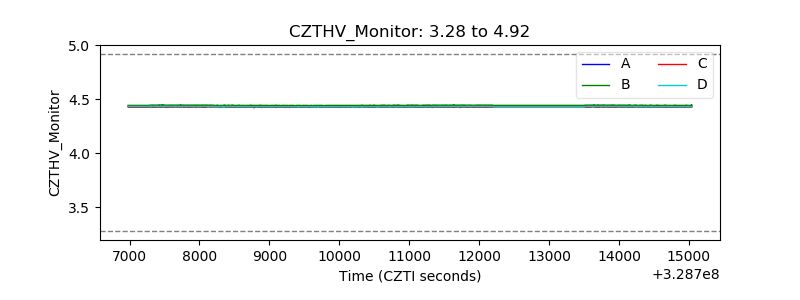 |
| D_VDD | 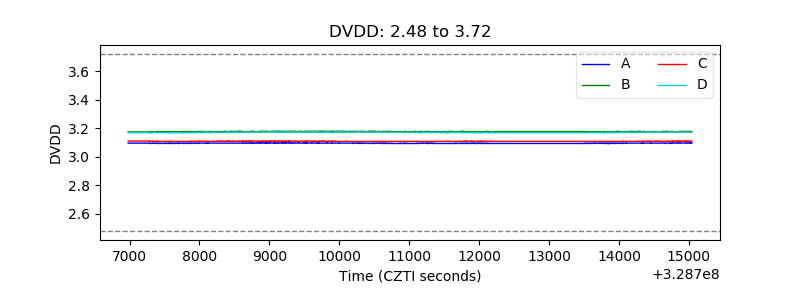 |
| Temperature 1 | 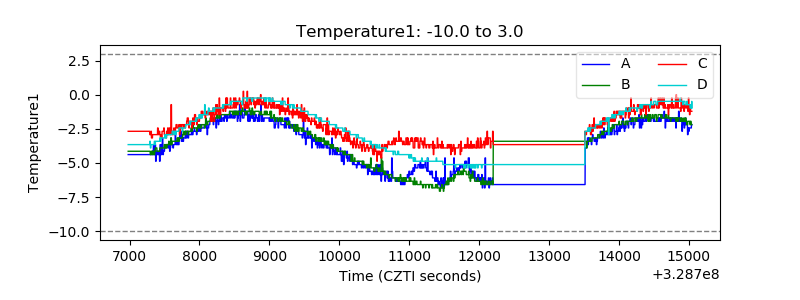 |
| Veto HV Monitor | 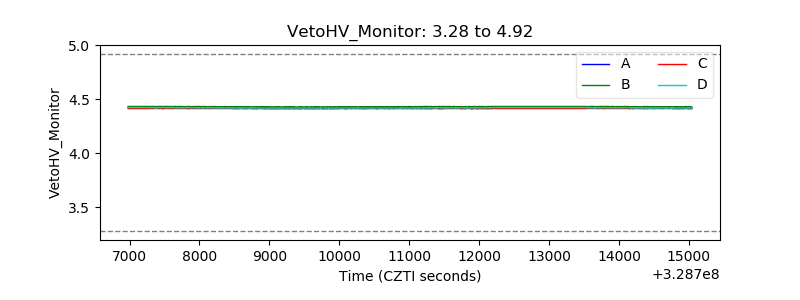 |
| Veto LLD | 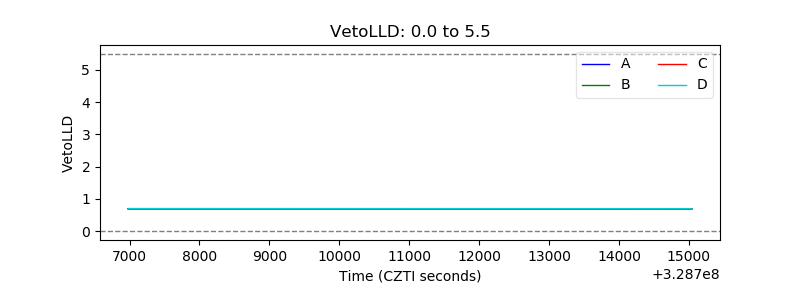 |
| Alpha Counter | 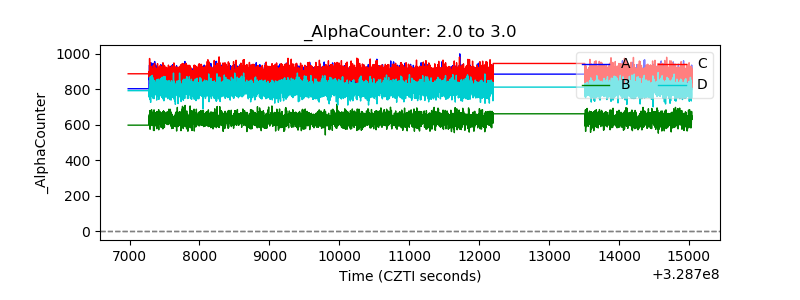 |
| _CPM_Rate | 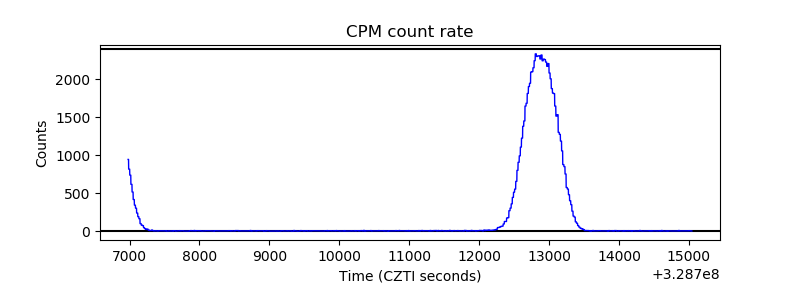 |
| CZT Counter | 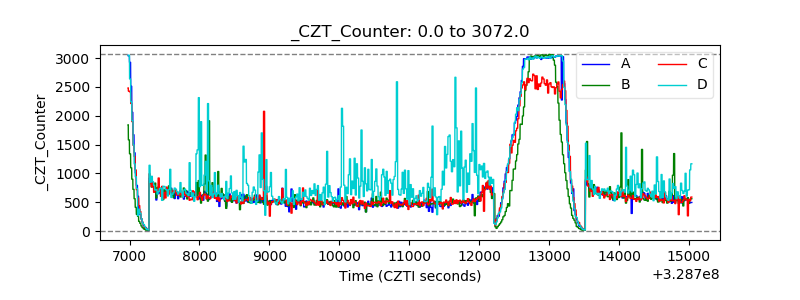 |
| +2.5 Volts monitor |  |
| +5 Volts monitor | 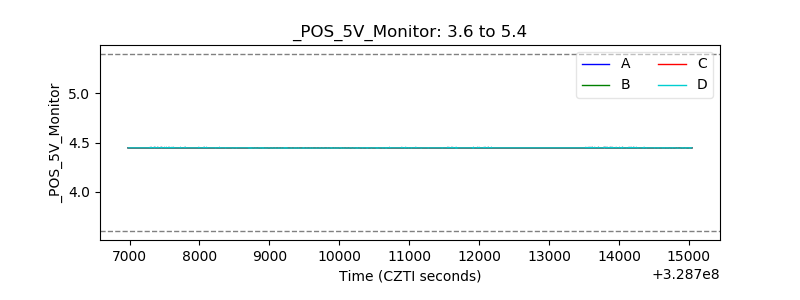 |
| _ROLL_ROT |  |
| _Roll_DEC |  |
| _Roll_RA | 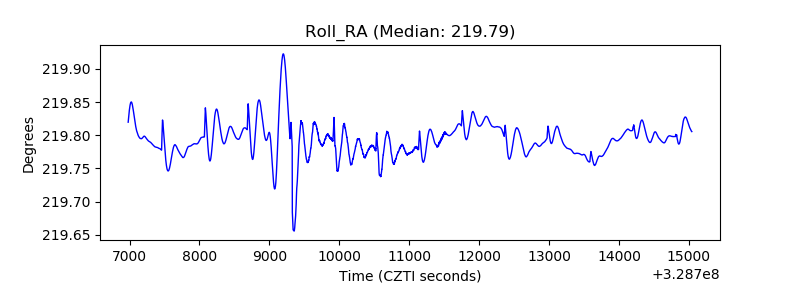 |
| Veto Counter | 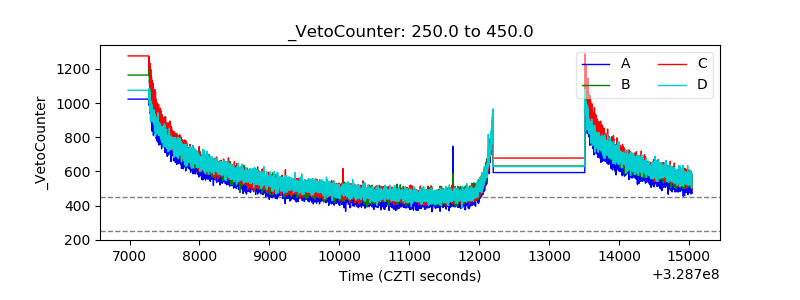 |