| Param | Original file | Final file |
|---|---|---|
| Filename | modeM0/AS1A09_022T01_9000003702_25288cztM0_level2.evt | modeM0/AS1A09_022T01_9000003702_25288cztM0_level2_quad_clean.evt |
| Size (bytes) | 575,683,200 | 118,874,880 |
| Size | 549.0 MB | 113.4 MB |
| Events in quadrant A | 6,485,146 | 768,825 |
| Events in quadrant B | 3,201,839 | 834,096 |
| Events in quadrant C | 3,098,426 | 804,923 |
| Events in quadrant D | 4,253,412 | 783,903 |
| Mode M9 | |||
|---|---|---|---|
| Quadrant | BADHDUFLAG | Total packets | Discarded packets |
| A | 0 | 13 | 0 |
| B | 0 | 13 | 0 |
| C | 0 | 13 | 0 |
| D | 0 | 13 | 0 |
| Mode M0 | |||
|---|---|---|---|
| Quadrant | BADHDUFLAG | Total packets | Discarded packets |
| A | 0 | 23168 | 0 |
| B | 0 | 13123 | 0 |
| C | 0 | 12668 | 0 |
| D | 0 | 16724 | 0 |
| Quadrant | Total seconds | Saturated seconds | Saturation percentage |
|---|---|---|---|
| A | 5836 | 1307 | 22.395476% |
| B | 5839 | 149 | 2.551807% |
| C | 5839 | 167 | 2.860079% |
| D | 5839 | 230 | 3.939031% |
Noise dominated data is calculated using 1-second bins in cleaned event files. If a bin has >2000 counts, and if more than 50% of those come from <1% of pixels, then it is considered to be noise-dominated and hence unusable.
| Quadrant | # 1 sec bins | Bins with >0 counts | Bins with >2000 counts | High rate bins dominated by noise | Noise dominated (total time) | Noise dominated (detector-on time) | Marked lightcurve |
|---|---|---|---|---|---|---|---|
| A | 7138 | 5838 | 943 | 943 | 13.21% | 16.15% | 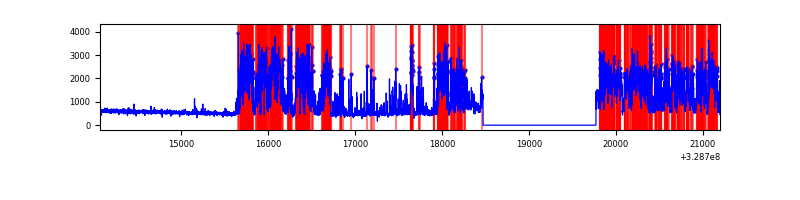 |
| B | 7139 | 5840 | 8 | 8 | 0.11% | 0.14% | 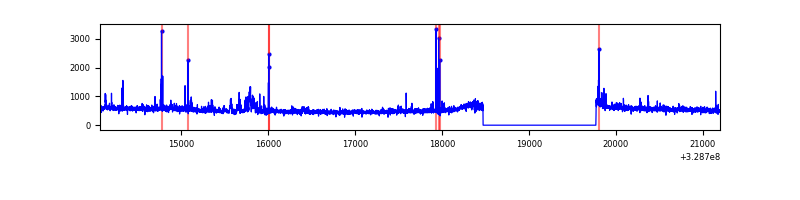 |
| C | 7139 | 5840 | 0 | 0 | 0.00% | 0.00% | 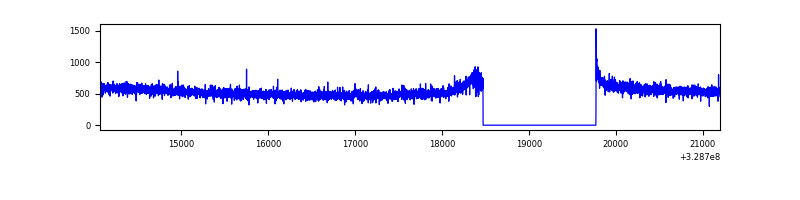 |
| D | 7139 | 5840 | 87 | 87 | 1.22% | 1.49% | 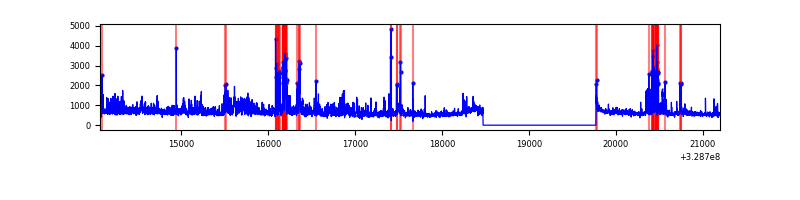 |
Top three noisy pixels from each quadrant. If the there are fewer than three noisy pixels in the level2.evt file, extra rows are filled as -1
| Pixel properties | Quadrant properties | ||||||
|---|---|---|---|---|---|---|---|
| Quadrant | DetID | PixID | Counts | Sigma | Mean | Median | Sigma |
| A | 6 | 16 | 3611022 | 24661.06 | 740 | 726 | 146.4 |
| A | 15 | 173 | 13636 | 88.19 | 740 | 726 | 146.4 |
| A | 13 | 254 | 9600 | 60.62 | 740 | 726 | 146.4 |
| B | 3 | 112 | 105306 | 741.78 | 771 | 754 | 140.9 |
| B | 3 | 64 | 44429 | 309.87 | 771 | 754 | 140.9 |
| B | 0 | 190 | 25473 | 175.38 | 771 | 754 | 140.9 |
| C | 14 | 238 | 121958 | 698.84 | 757 | 764 | 173.4 |
| C | 3 | 233 | 6793 | 34.77 | 757 | 764 | 173.4 |
| C | 0 | 207 | 6418 | 32.6 | 757 | 764 | 173.4 |
| D | 1 | 52 | 600444 | 3267.56 | 769 | 751 | 183.5 |
| D | 12 | 233 | 389894 | 2120.33 | 769 | 751 | 183.5 |
| D | 8 | 195 | 294362 | 1599.81 | 769 | 751 | 183.5 |
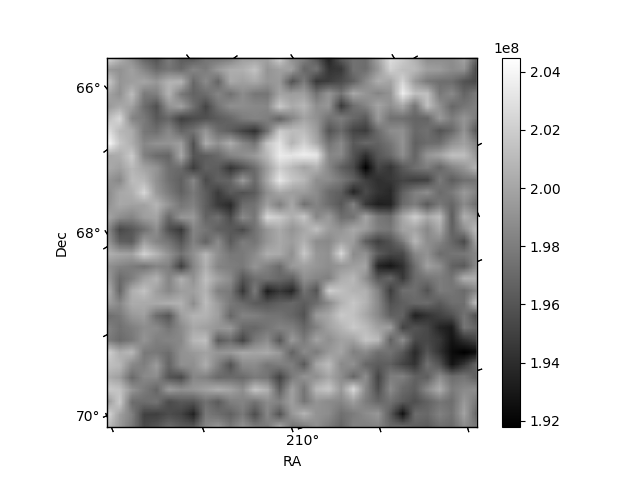
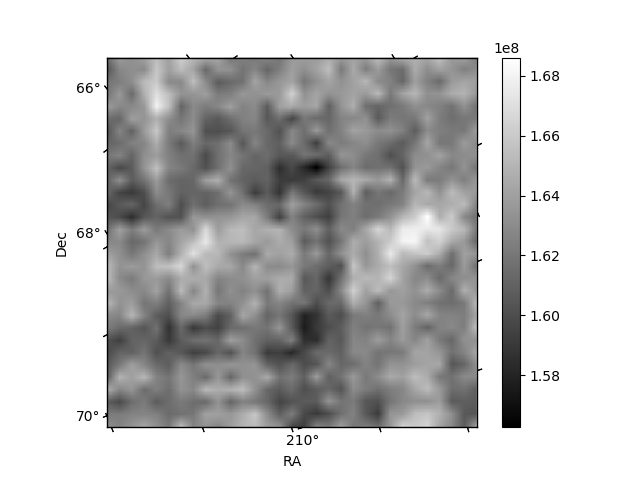
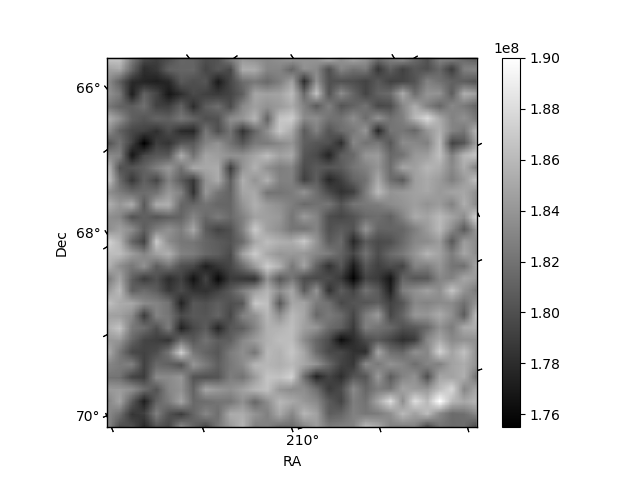
Histogram calculated using DETX and DETY for each event in the final _common_clean file
| Quadrant A | 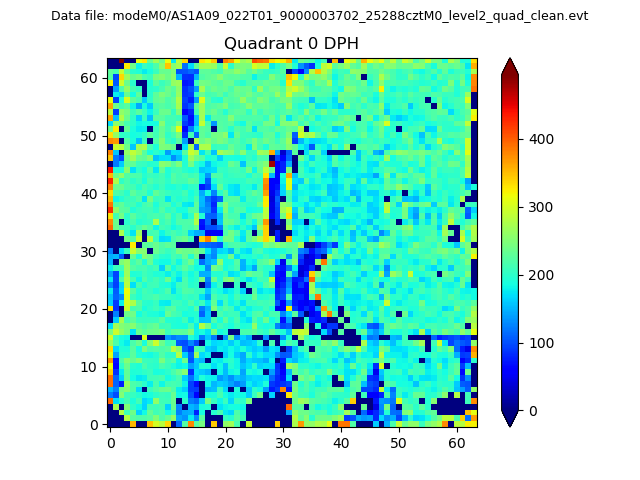 |
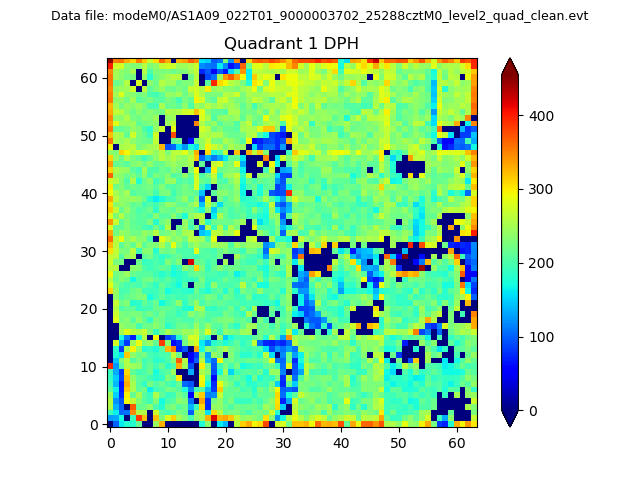 |
Quadrant B |
|---|---|---|---|
| Quadrant D | 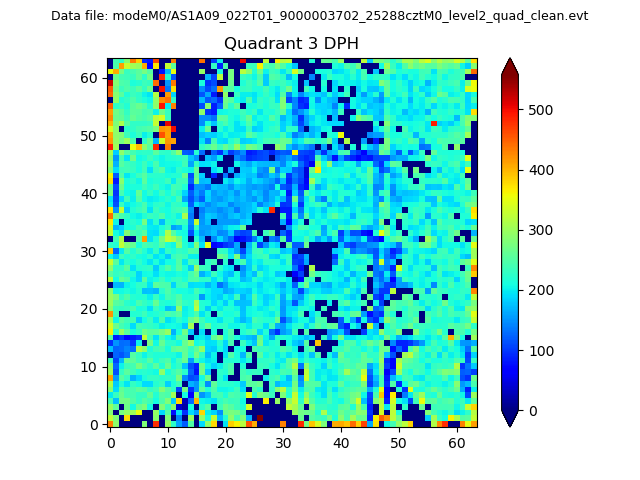 |
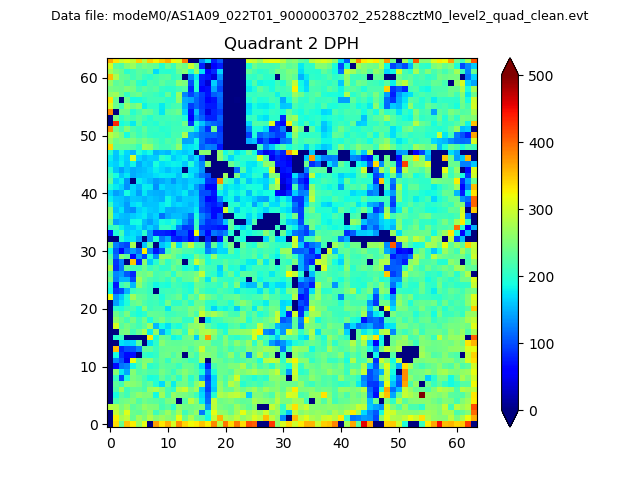 |
Quadrant C |
| Plot type | Count rate plots | Images |
|---|---|---|
| Comparison with Poisson distribution Blue bars denote a histogram of data divided into 1 sec bins. Red curve is a Poisson curve with rate = median count rate of data. |
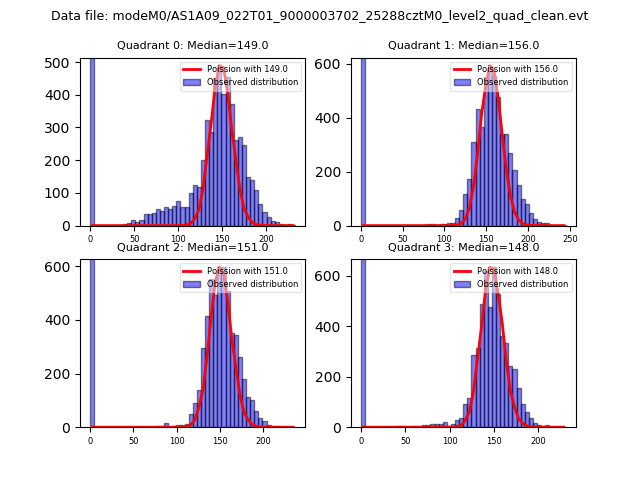 |
 |
| Quadrant-wise count rates Data is divided into 100 sec bins |
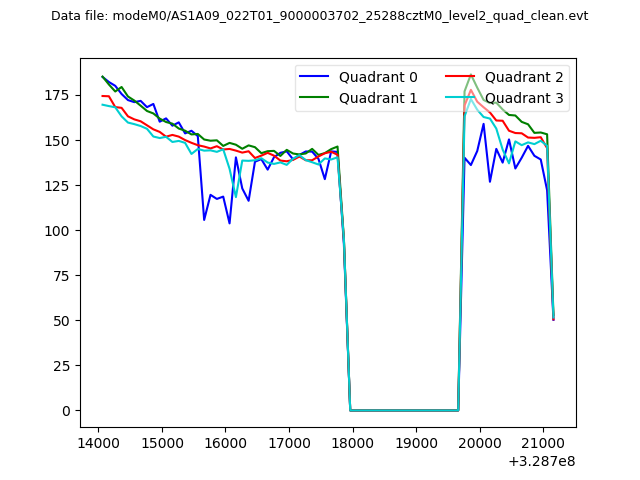 |
|
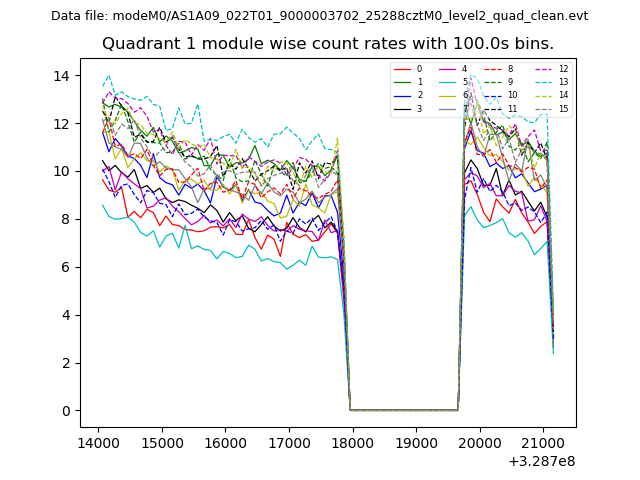
| Module-wise count rates for Quadrant A Data is divided into 100 sec bins |
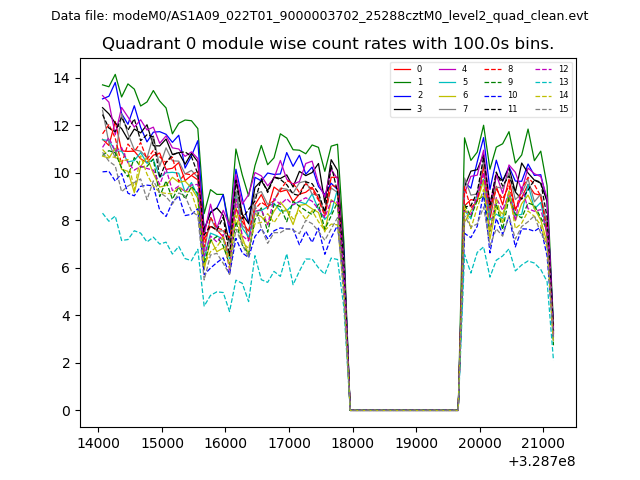 |
 |
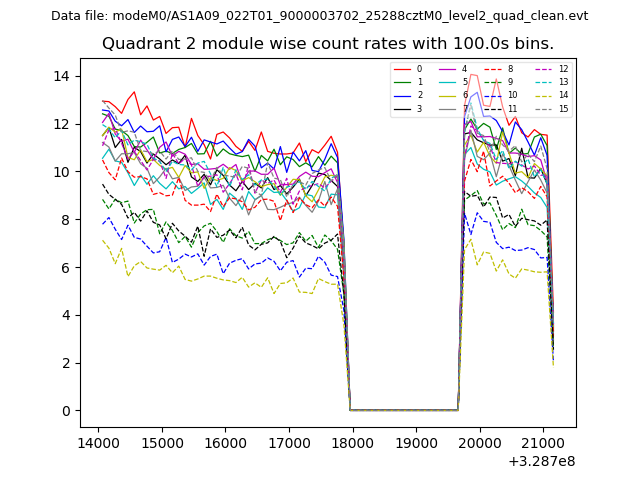
| Module-wise count rates for Quadrant B Data is divided into 100 sec bins |
 |
 |
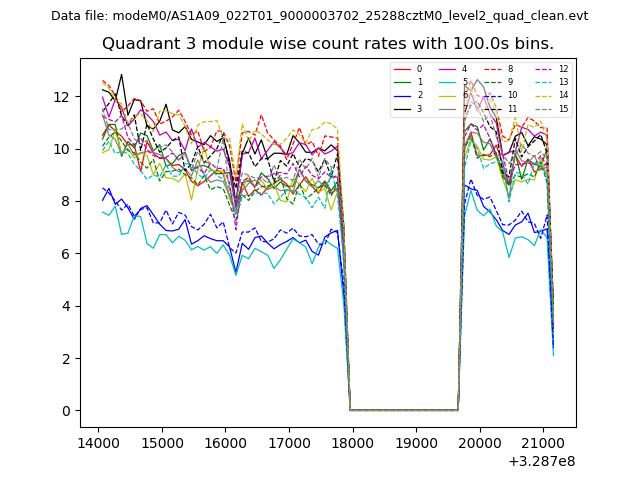
| Module-wise count rates for Quadrant C Data is divided into 100 sec bins |
 |
 |
| Module-wise count rates for Quadrant D Data is divided into 100 sec bins |
 |
 |
| Parameter | Plot |
|---|---|
| CZT HV Monitor | 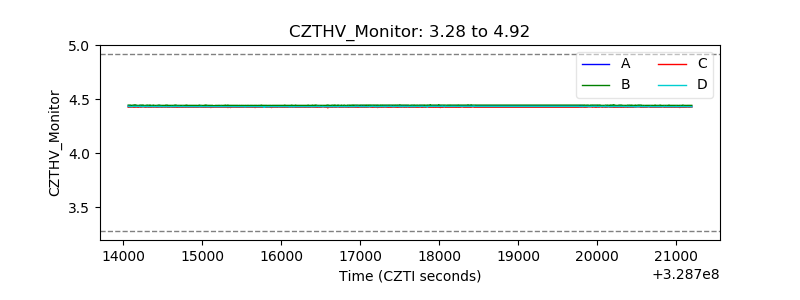 |
| D_VDD | 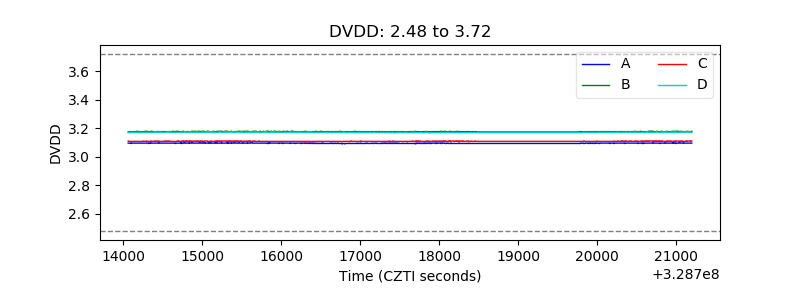 |
| Temperature 1 | 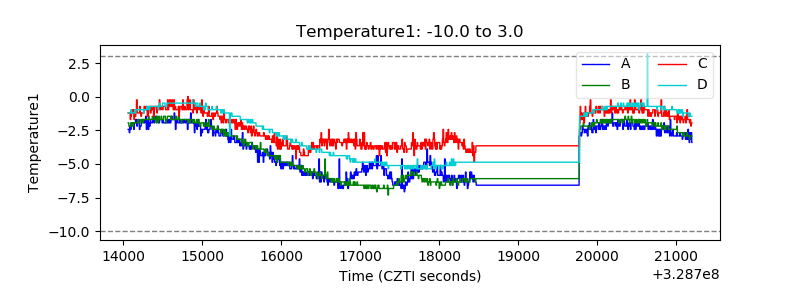 |
| Veto HV Monitor | 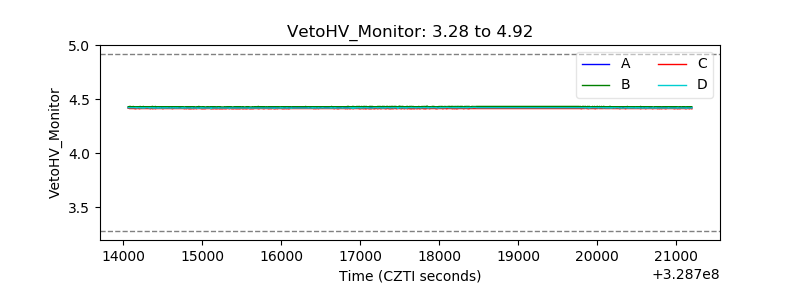 |
| Veto LLD | 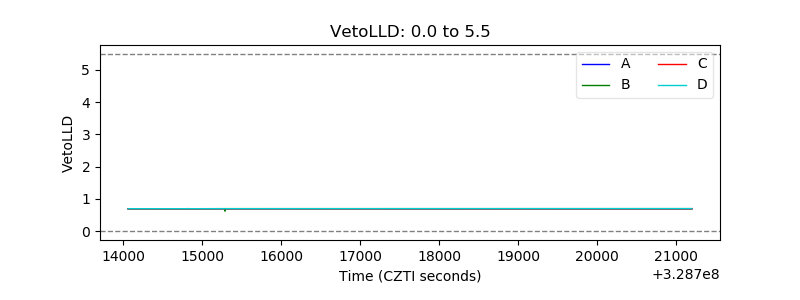 |
| Alpha Counter | 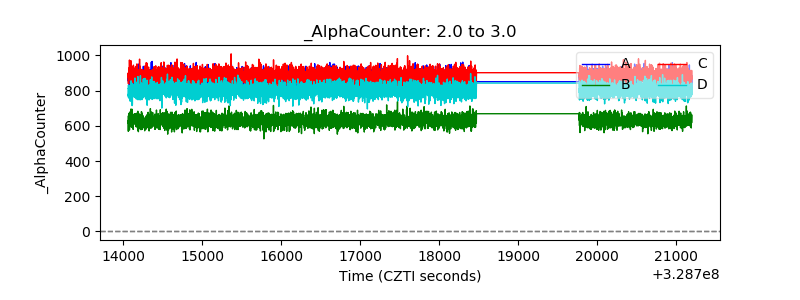 |
| _CPM_Rate | 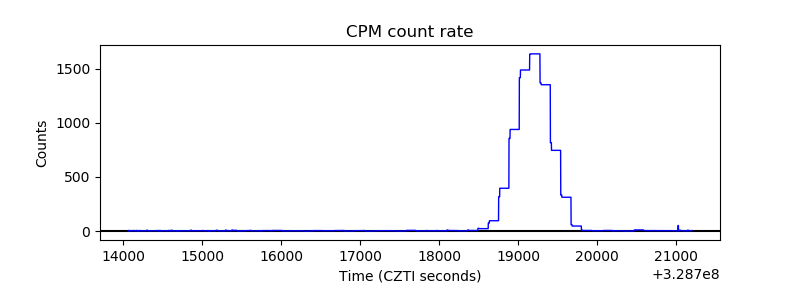 |
| CZT Counter | 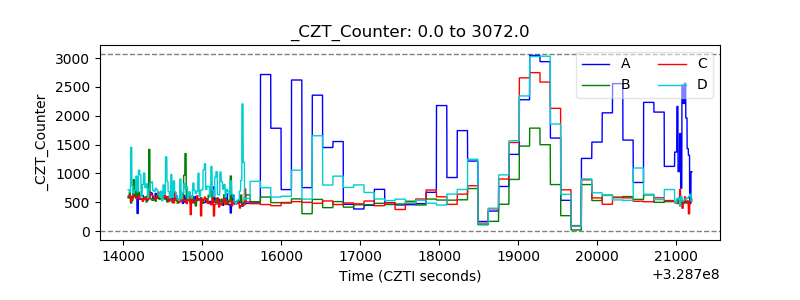 |
| +2.5 Volts monitor |  |
| +5 Volts monitor |  |
| _ROLL_ROT | 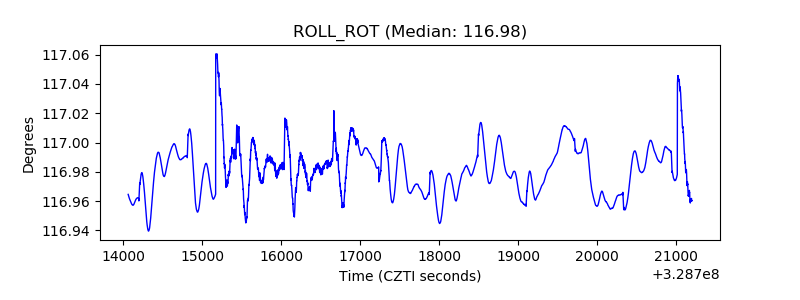 |
| _Roll_DEC |  |
| _Roll_RA |  |
| Veto Counter | 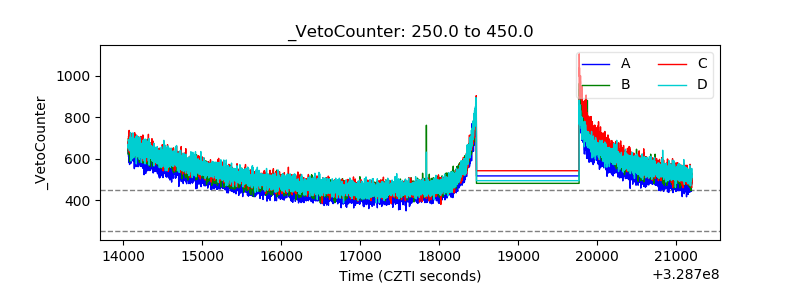 |