| Param | Original file | Final file |
|---|---|---|
| Filename | modeM0/AS1A09_022T01_9000003702_25289cztM0_level2.evt | modeM0/AS1A09_022T01_9000003702_25289cztM0_level2_quad_clean.evt |
| Size (bytes) | 650,194,560 | 115,441,920 |
| Size | 620.1 MB | 110.1 MB |
| Events in quadrant A | 8,790,736 | 703,190 |
| Events in quadrant B | 3,366,536 | 802,392 |
| Events in quadrant C | 3,337,956 | 779,590 |
| Events in quadrant D | 3,760,897 | 761,937 |
| Mode M9 | |||
|---|---|---|---|
| Quadrant | BADHDUFLAG | Total packets | Discarded packets |
| A | 0 | 12 | 0 |
| B | 0 | 12 | 0 |
| C | 0 | 12 | 0 |
| D | 0 | 12 | 0 |
| Mode M0 | |||
|---|---|---|---|
| Quadrant | BADHDUFLAG | Total packets | Discarded packets |
| A | 0 | 30642 | 0 |
| B | 0 | 14140 | 0 |
| C | 0 | 13773 | 0 |
| D | 0 | 15296 | 0 |
| Quadrant | Total seconds | Saturated seconds | Saturation percentage |
|---|---|---|---|
| A | 6433 | 1715 | 26.659412% |
| B | 6433 | 78 | 1.212498% |
| C | 6434 | 120 | 1.865092% |
| D | 6434 | 116 | 1.802922% |
Noise dominated data is calculated using 1-second bins in cleaned event files. If a bin has >2000 counts, and if more than 50% of those come from <1% of pixels, then it is considered to be noise-dominated and hence unusable.
| Quadrant | # 1 sec bins | Bins with >0 counts | Bins with >2000 counts | High rate bins dominated by noise | Noise dominated (total time) | Noise dominated (detector-on time) | Marked lightcurve |
|---|---|---|---|---|---|---|---|
| A | 7598 | 6435 | 1408 | 1408 | 18.53% | 21.88% | 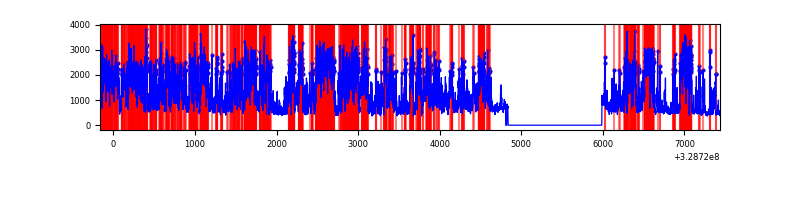 |
| B | 7598 | 6435 | 0 | 0 | 0.00% | 0.00% | 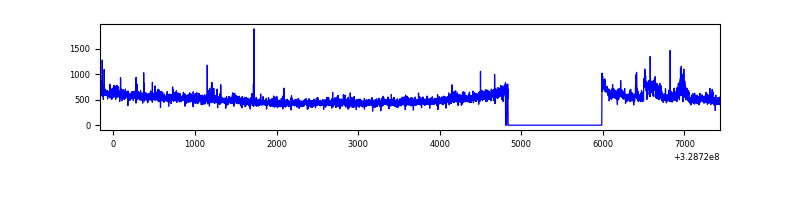 |
| C | 7599 | 6436 | 6 | 6 | 0.08% | 0.09% | 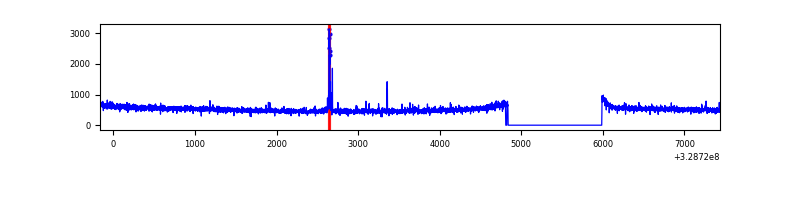 |
| D | 7599 | 6436 | 51 | 51 | 0.67% | 0.79% | 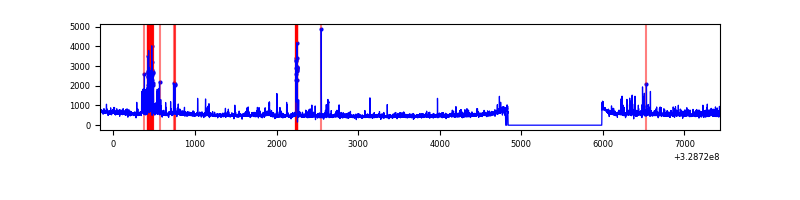 |
Top three noisy pixels from each quadrant. If the there are fewer than three noisy pixels in the level2.evt file, extra rows are filled as -1
| Pixel properties | Quadrant properties | ||||||
|---|---|---|---|---|---|---|---|
| Quadrant | DetID | PixID | Counts | Sigma | Mean | Median | Sigma |
| A | 6 | 16 | 5790040 | 38093.77 | 770 | 755 | 152.0 |
| A | 15 | 173 | 18270 | 115.25 | 770 | 755 | 152.0 |
| A | 4 | 2 | 11056 | 67.78 | 770 | 755 | 152.0 |
| B | 15 | 33 | 66426 | 431.13 | 821 | 802 | 152.2 |
| B | 3 | 112 | 44062 | 284.21 | 821 | 802 | 152.2 |
| B | 0 | 229 | 40624 | 261.62 | 821 | 802 | 152.2 |
| C | 14 | 238 | 129307 | 691.5 | 806 | 812 | 185.8 |
| C | 9 | 54 | 47710 | 252.38 | 806 | 812 | 185.8 |
| C | 0 | 207 | 7611 | 36.59 | 806 | 812 | 185.8 |
| D | 8 | 195 | 236941 | 1215.7 | 815 | 791 | 194.3 |
| D | 1 | 52 | 187103 | 959.13 | 815 | 791 | 194.3 |
| D | 12 | 233 | 163342 | 836.81 | 815 | 791 | 194.3 |
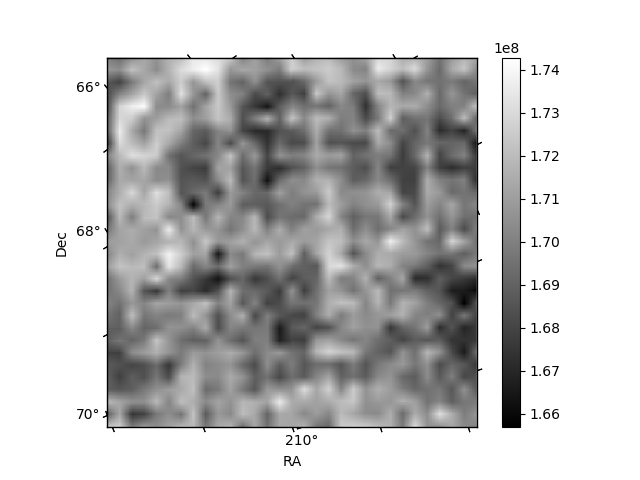
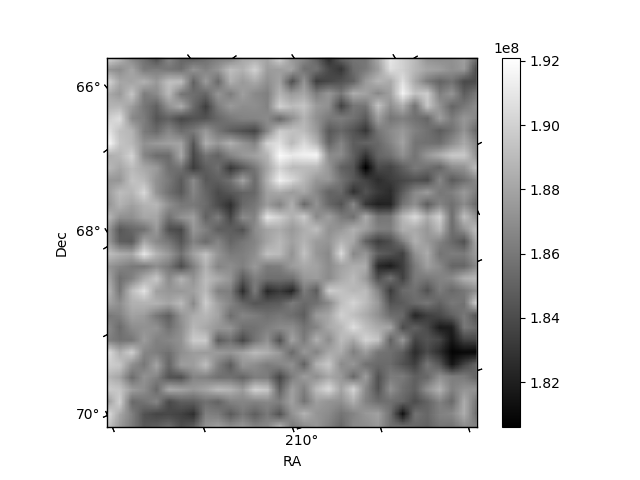
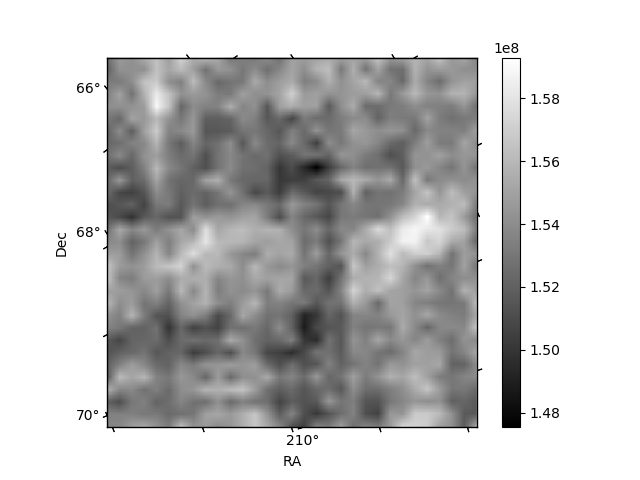
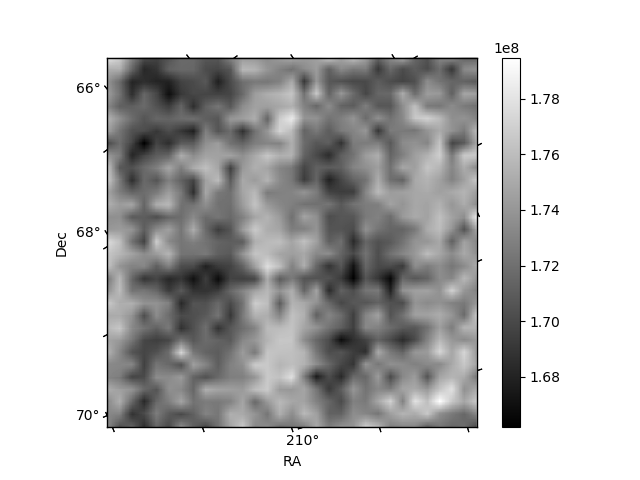
Histogram calculated using DETX and DETY for each event in the final _common_clean file
| Quadrant A | 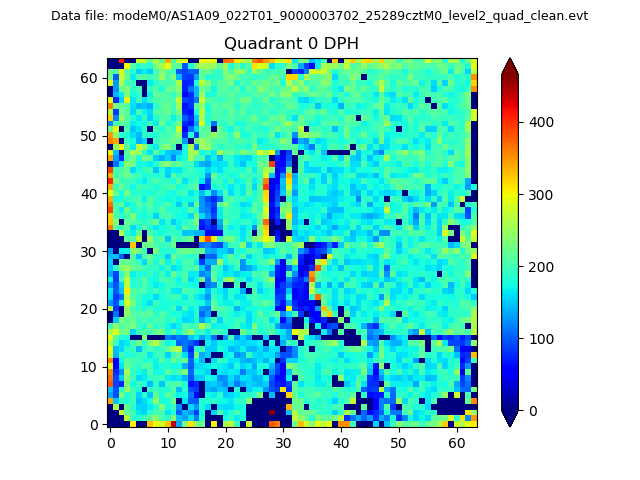 |
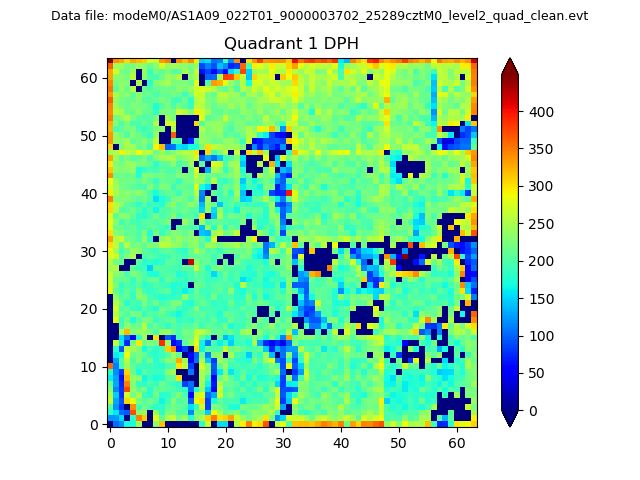 |
Quadrant B |
|---|---|---|---|
| Quadrant D | 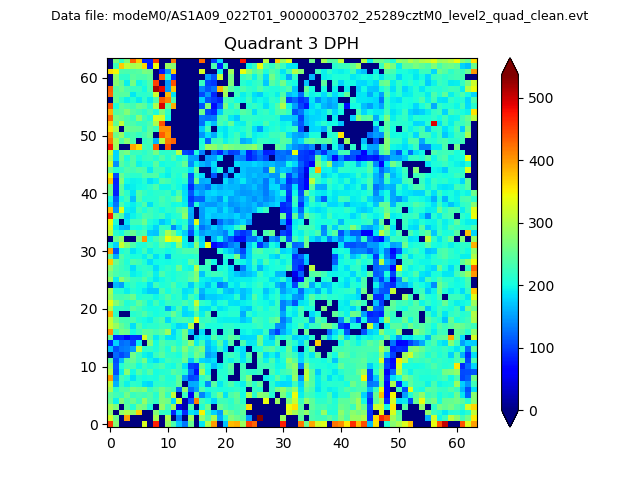 |
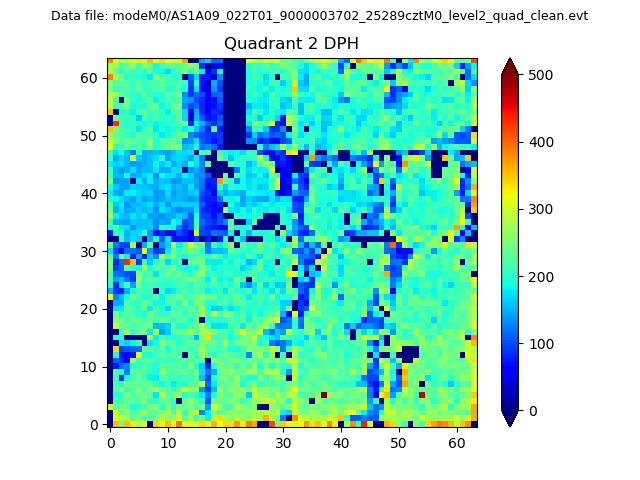 |
Quadrant C |
| Plot type | Count rate plots | Images |
|---|---|---|
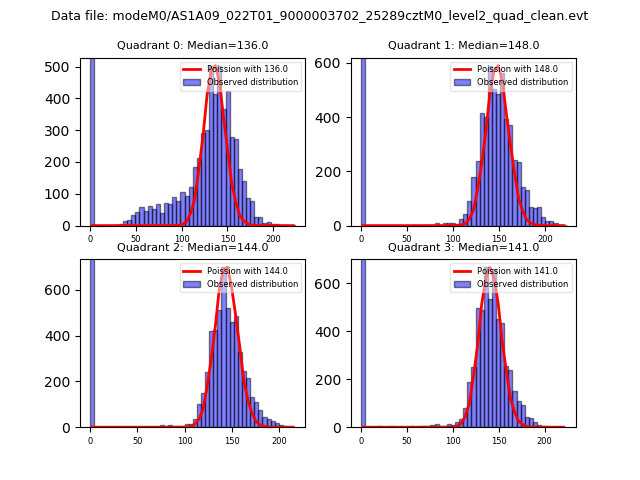
| Comparison with Poisson distribution Blue bars denote a histogram of data divided into 1 sec bins. Red curve is a Poisson curve with rate = median count rate of data. |
 |
 |
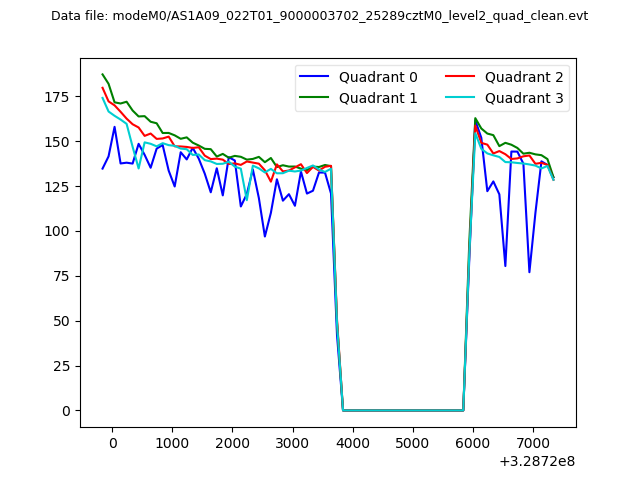
| Quadrant-wise count rates Data is divided into 100 sec bins |
 |
|
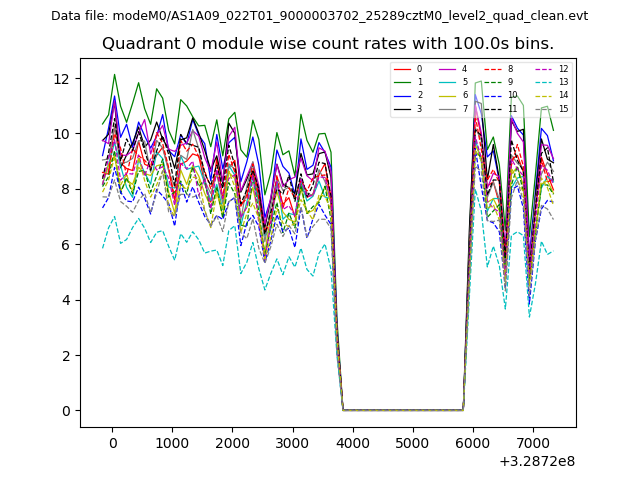
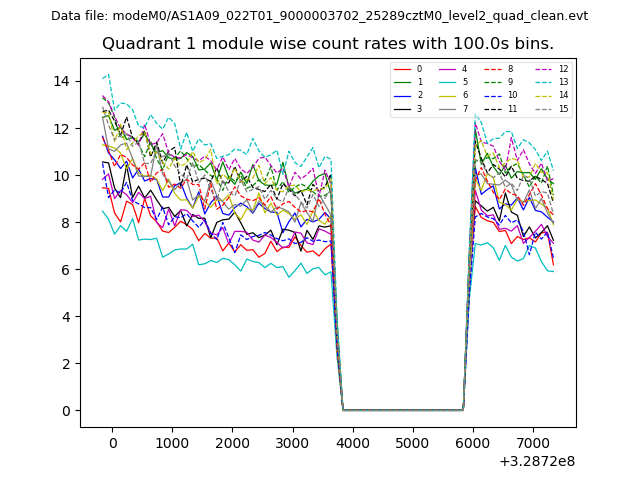
| Module-wise count rates for Quadrant A Data is divided into 100 sec bins |
 |
 |
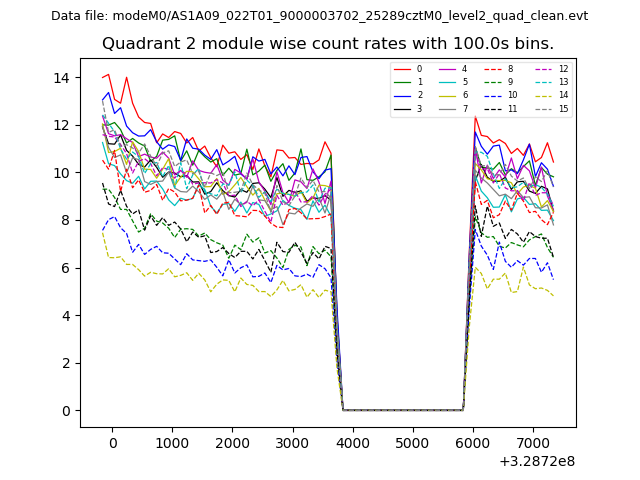
| Module-wise count rates for Quadrant B Data is divided into 100 sec bins |
 |
 |
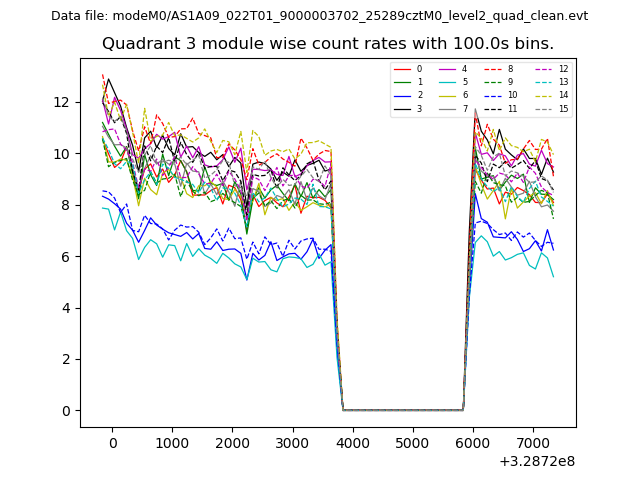
| Module-wise count rates for Quadrant C Data is divided into 100 sec bins |
 |
 |
| Module-wise count rates for Quadrant D Data is divided into 100 sec bins |
 |
 |
| Parameter | Plot |
|---|---|
| CZT HV Monitor | 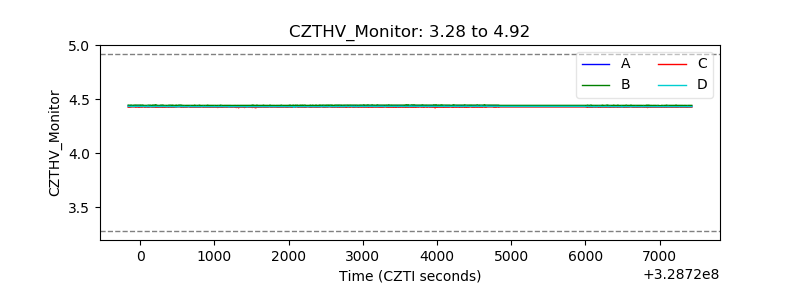 |
| D_VDD | 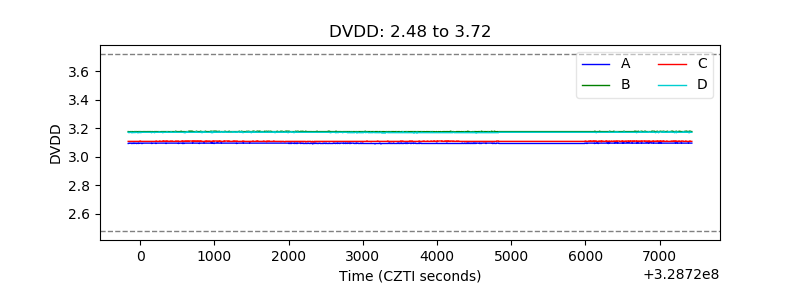 |
| Temperature 1 | 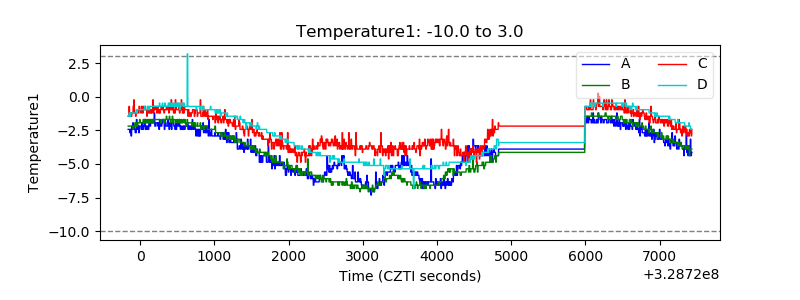 |
| Veto HV Monitor | 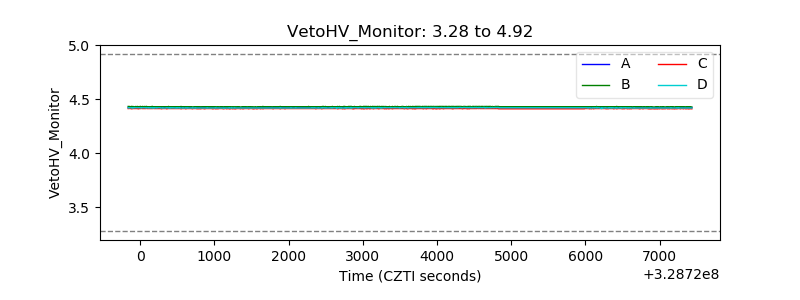 |
| Veto LLD | 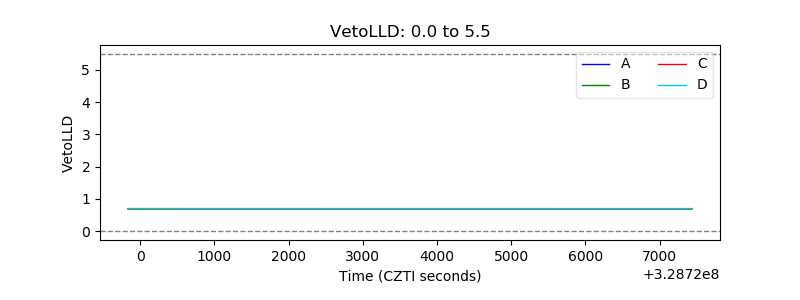 |
| Alpha Counter | 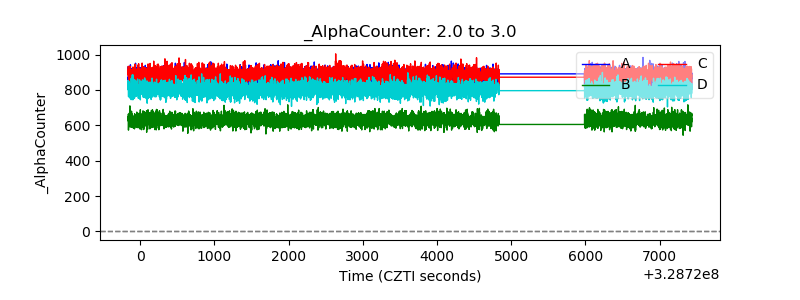 |
| _CPM_Rate | 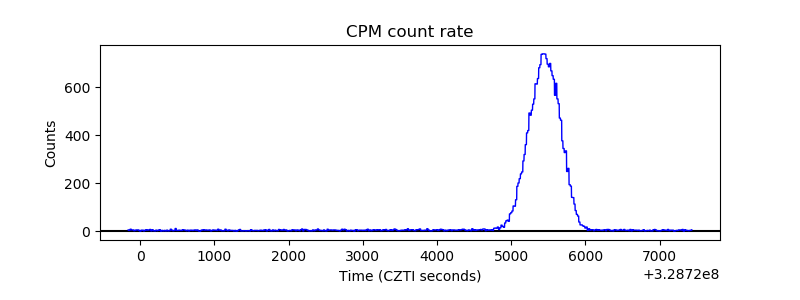 |
| CZT Counter | 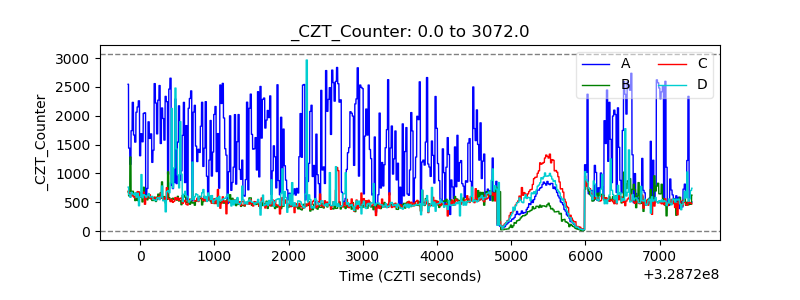 |
| +2.5 Volts monitor |  |
| +5 Volts monitor | 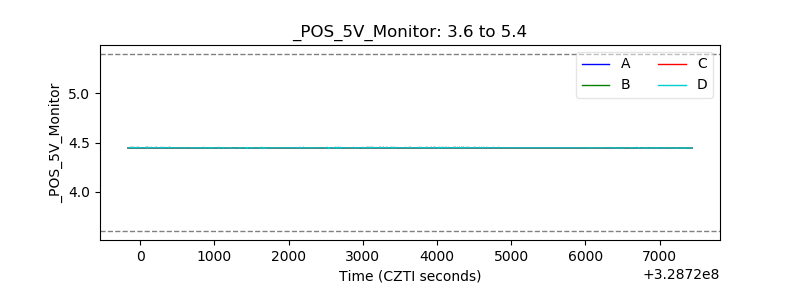 |
| _ROLL_ROT | 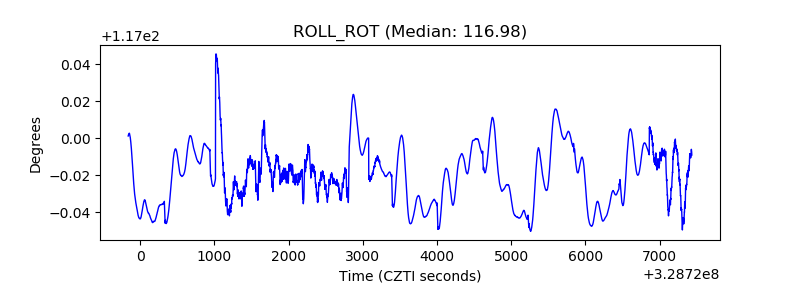 |
| _Roll_DEC | 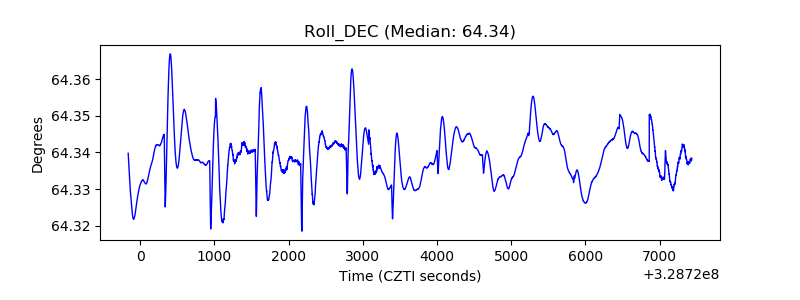 |
| _Roll_RA | 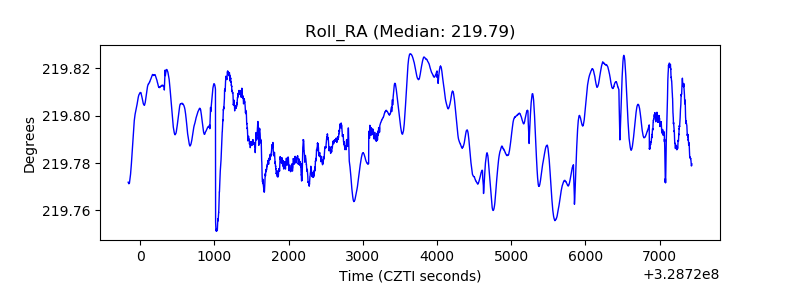 |
| Veto Counter | 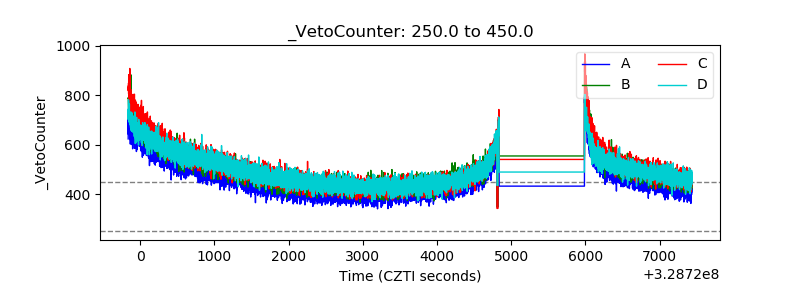 |